With little over 70% ROI, we were able to reach and go beyond the annual planned ROI.
December 2020 is the biggest contributor with a 30.38% gain (at the moment). This is the biggest month in my trading career so far in terms of percentage gain.
We will never achieve this much of success in trading if we…
- Jump from one system to another,
- Trade without sound risk and money management plan,
- Trade without a proper trading routing,
- Trade without having an idea about realistic expectations,
- Trade without not knowing how to manage emotional ups and down
…just like the rest of losing traders out there.
Not just the trading strategy, but all these little pieces lead to our success.
But, Lots of traders mostly spend their time on finding the perfect trading strategy AKA Holy Grail of Trading.
Truth is there is no holy grail in trading, just random distributions of winners and losers, and a trader is one who is skilled in driving the winners and cutting the losers. Or to put it another way, a trader is someone good at managing risk.
With that let’s review the trade from the last week.
NZDCAD Long Trade
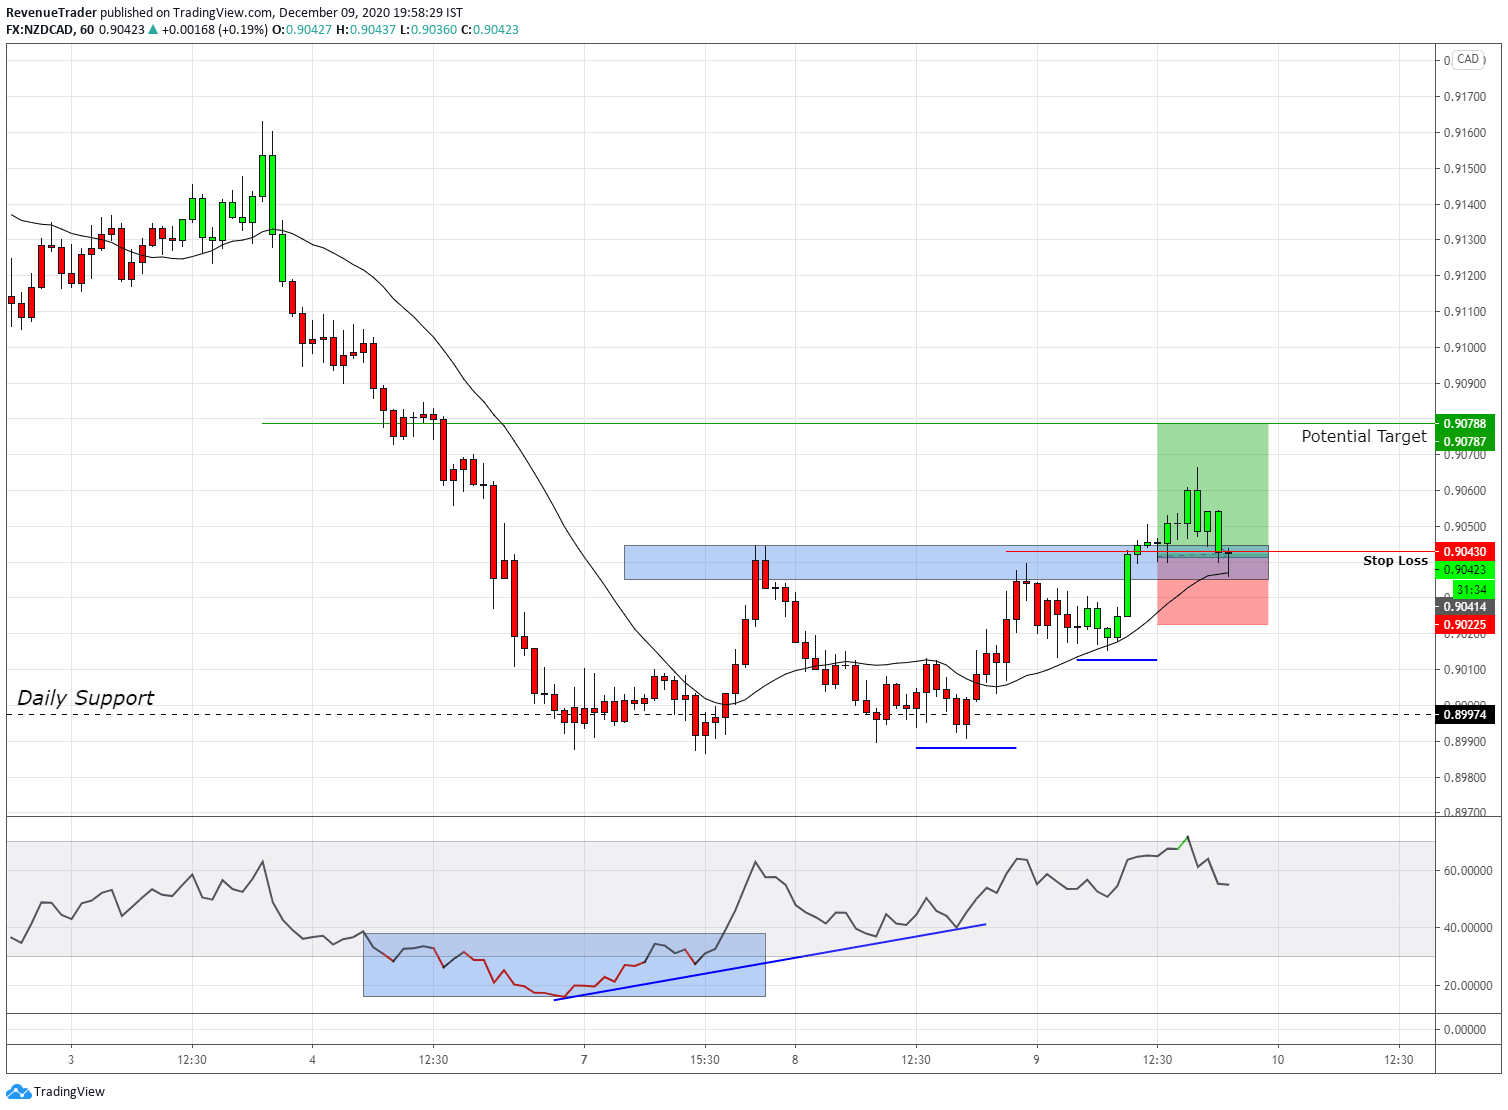
This is a trend reversal trade in NZDCAD. First of all, on the left, we can see that this is a downtrend. But as prices met with daily support, sellers began to slow down. The consequence of this is a double bottom pattern. After the double bottom formation, the sellers were unable to lower the price. Instead, the buyers stepped in and broke over the local structure level, showing bullish momentum.
Upon the price break above the local structure level, we placed a long trade targeting small structure plus 38.6 Fibonacci retracements.
After price reached to the 1R profit level, We moved stop-loss to breakeven and eventually price reverse and hit the trailing stop-loss for -0.1R.
EURUSD Short Trade
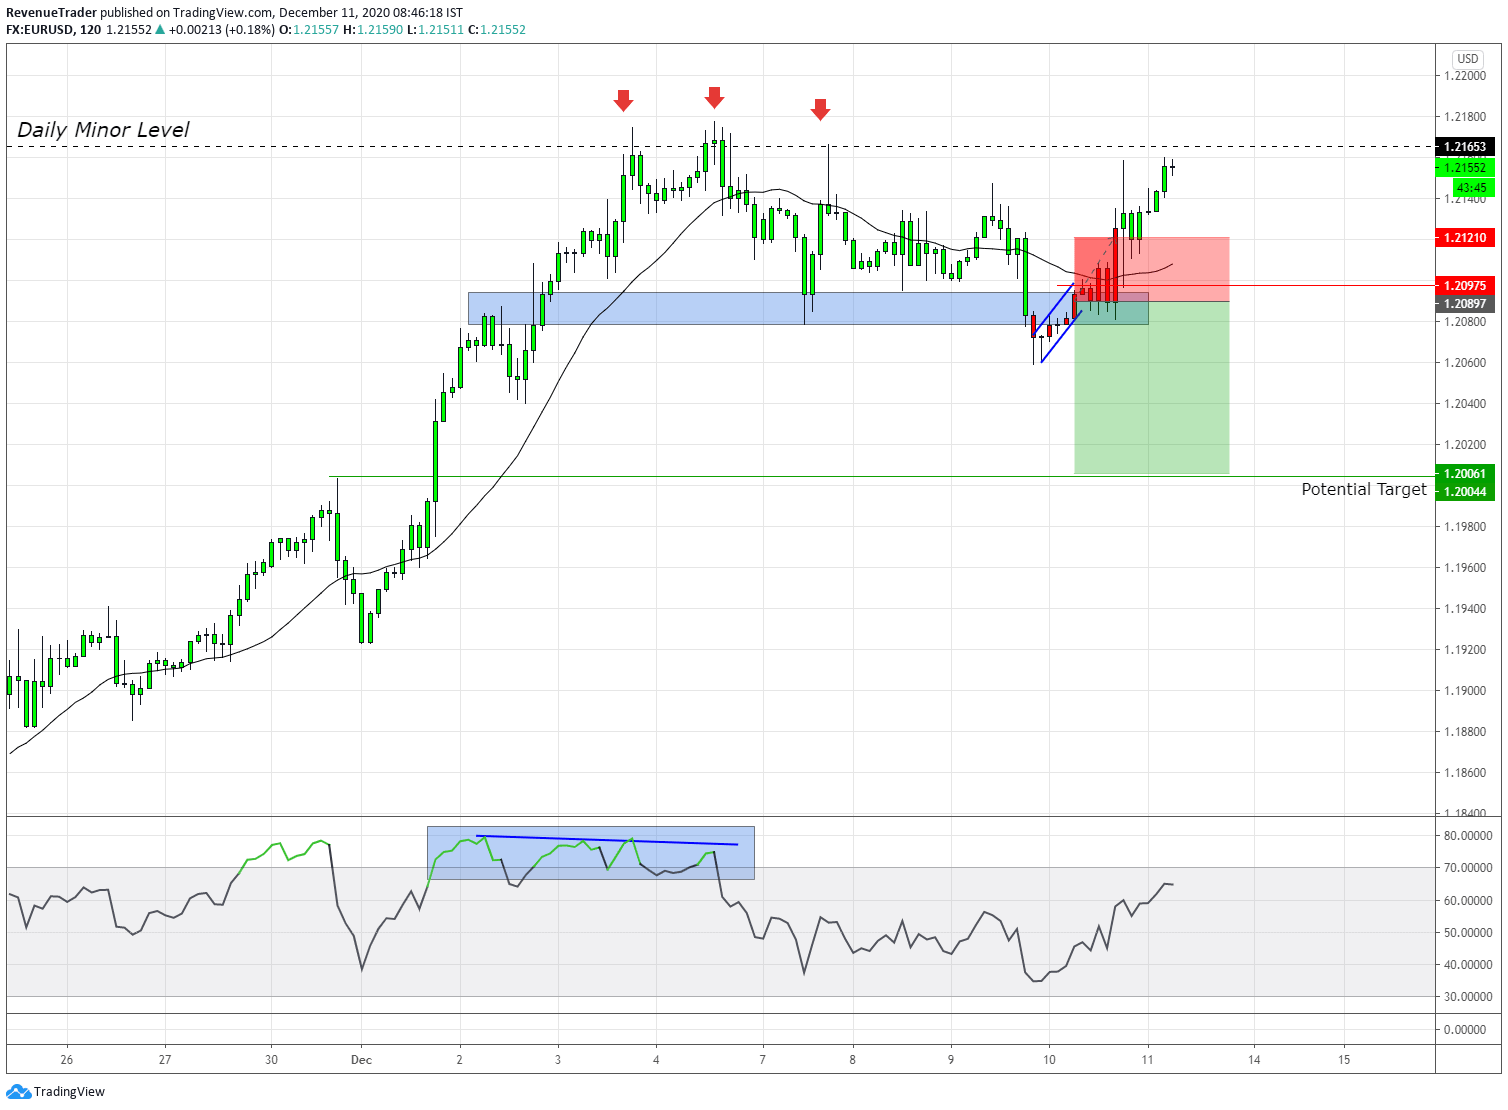
Just like the previous trade, EURUSD was in a powerful uptrend with a series of higher highs followed by higher lows, but as prices met with a daily minor level of resistance, buyers began to show some weaknesses in the on-going uptrend, resulting in a triple top formation. This is exactly what triggers us.
Next, take a look at the breakout. This is where we’ve made a short trade. From the point of entry, the market did not move in our favour, at least with a pip, and the price traded only on the negative side of the trade. This signalled me that there was no selling pressure, as we planned, and I ended up cutting losses for this trade to-0.25R.
Next…
GBPUSD Short Trade
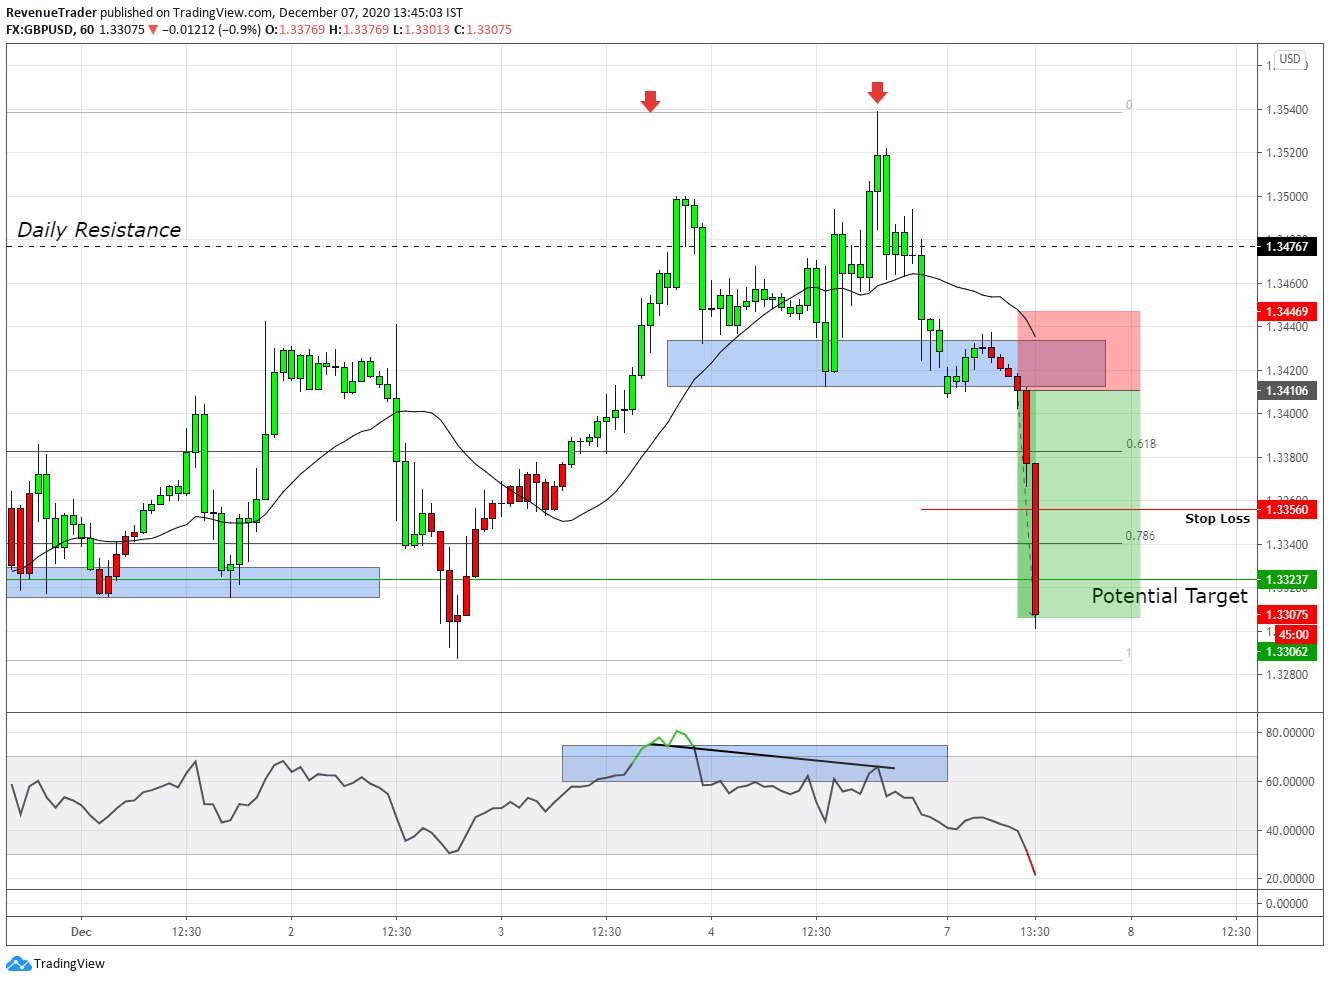
This is the first profitable trade in the last week. First of all, look at the marked higher highs (two red arrows on the chart) and lower lows in the RSI indicator. The price action and the RSI indicator are both out of sync, resulting in RSI divergence. This suggests a lack of buying pressure.
Next, look at the strong retracement (after the second red arrow) against the uptrend. This is called momentum drive pattern. After that retracement, the price made a slight drawback and a break below the local structure level, allowing us to make a short trade.
And eventually, as you guys can see, we ended up making 2.8R on GBPUSD.
NZDJPY Short
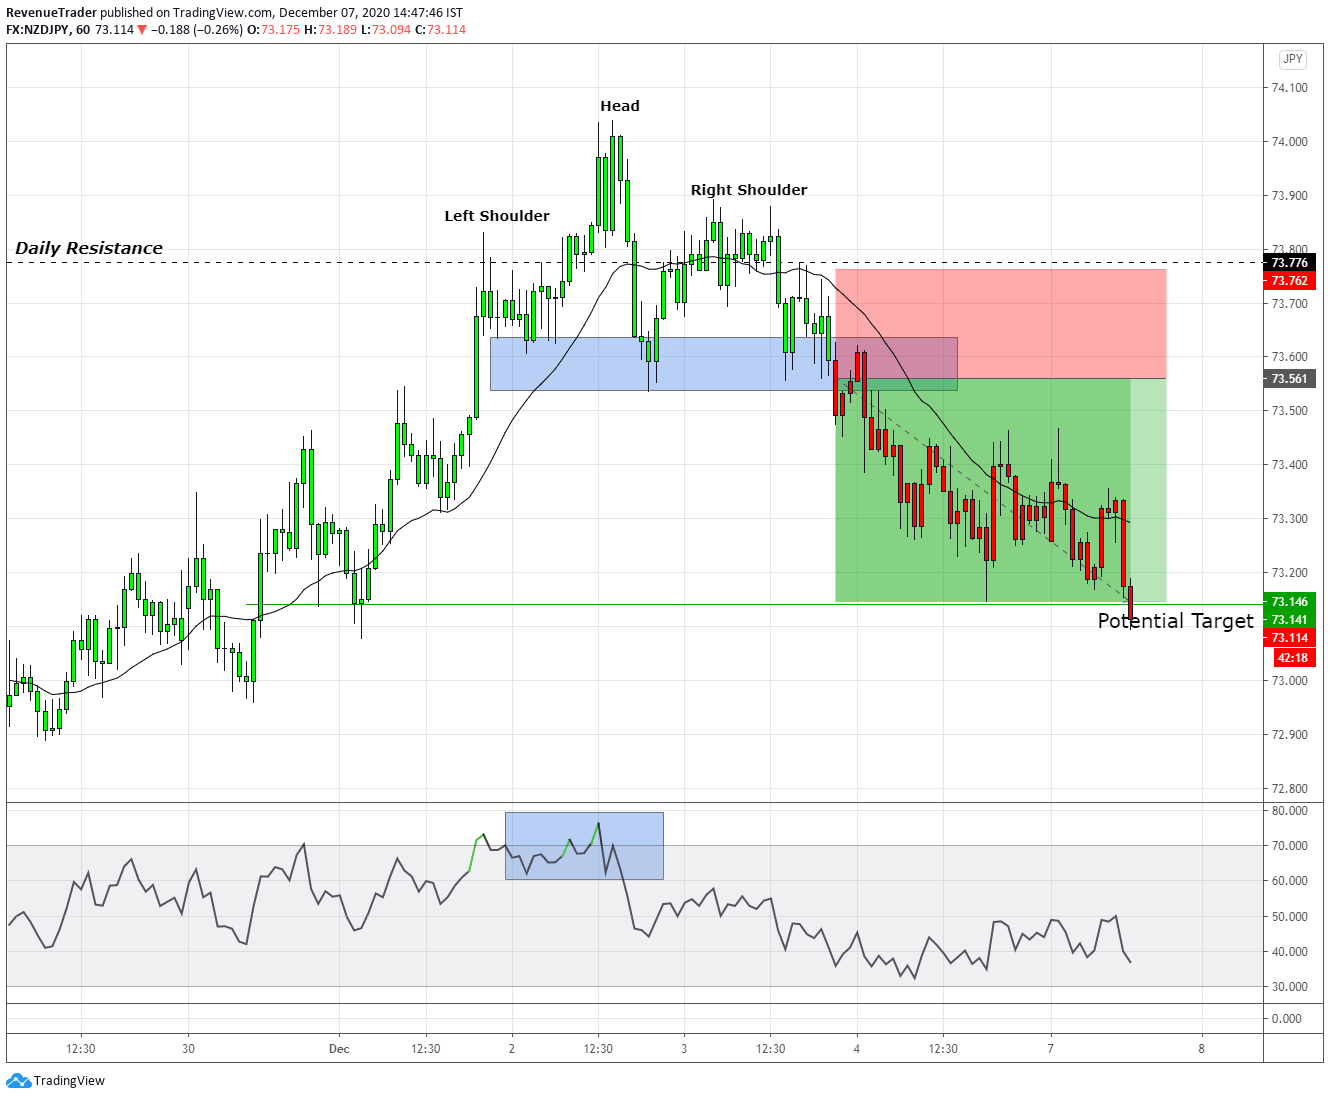
Again we’ve been able to catch a reversal of an uptrend. This time it wasn’t a sharp turnaround, but we eventually met our targets.
The head and shoulders at the daily resistance level suggest a lack of buying pressure. RSI also indicates some divergence at that point. With these confluences breaking below the local structure level, it’s what makes us short on NZDJPY. Finally, as predicted, the price went down and hit our take profit for another 2R.
In sum, with these four trades, we were able to earn 4.45R, which is equivalent to 8.9%.
Next, let’s take a look at the trade ideas for the coming week.
Disclaimer: Trade Revenue Pro’s view on the Forex Charts is not advice or a recommendation to trade or invest, it is only for educational purposes. Don’t Blindly Buy or Sell any Asset, Do your own analysis and be Aware of the Risk.
Keep in mind, These are Just Market Predictions and not a Trade Signal or Trade Ideas, At Trade Revenue Pro We are Using Daily Time Frame to Identify Major Price Movements and Push Down 4-Hour Time Frame to Get Favourable Risk to Reward For Our Trades, Furthermore, We are Using Tight Risk Management Method to Preserve Our Trading capital.
CADJPY – A Momentum Drive Pattern Around the Daily Resistance
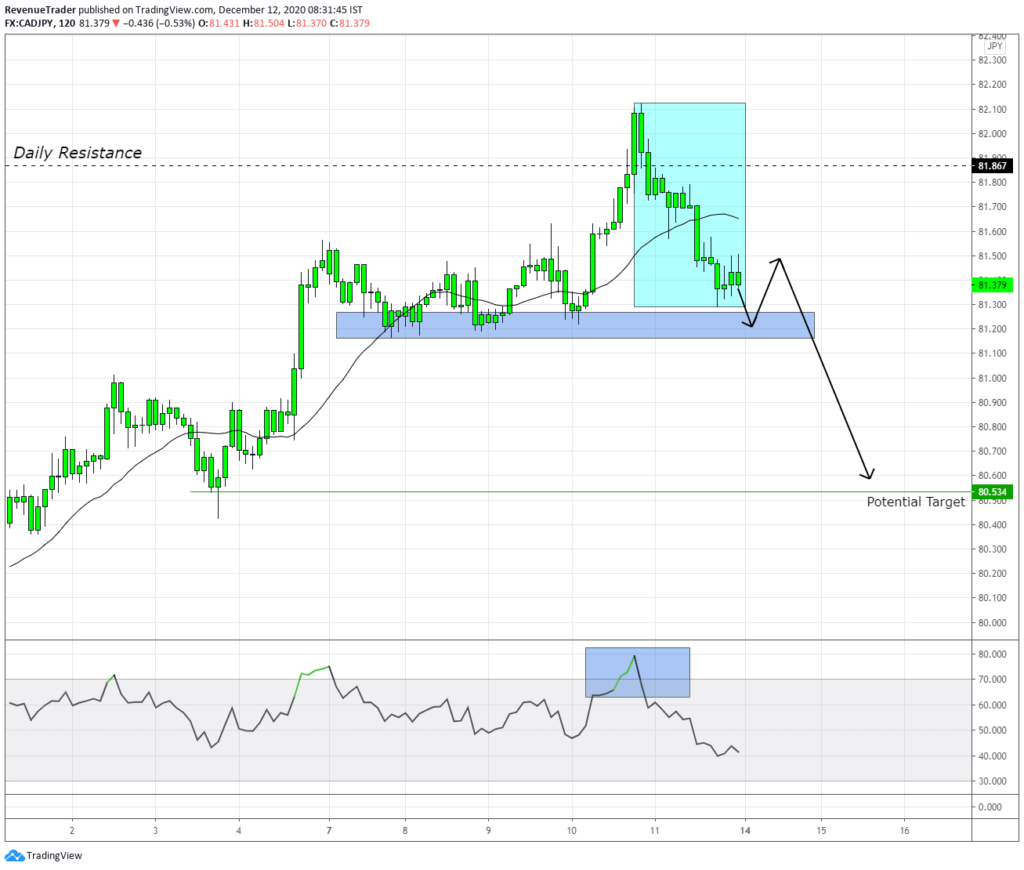
Key Level – At the moment CADJPY is retracing from the daily resistance level. Next, have a look at the retracement, When comparing to the previous retracement, this one is sharp, indicating selling pressure at the daily resistance at 81.867.
Momentum Drive Pattern – Pattern is not complete yet. At the moment we only have momentum leg (yellow box). With a small bounce and the break of the local structure level, make this pattern is a complete one. If that happens this chart clearly illustrates the selling pressure.
RSI Overbought – At the moment RSI is also overbought which is an additional confluence for our trade.
Market Forecast – Have a look at the progression of the uptrend, first, we had small retracements and as price met the daily resistance level, the retracements started to getting deeper and deeper indicating the selling pressure currently builds on this pair. With these trade confluences, a break below of the local structure level is very powerful.
Trade Idea – We will consider going short on a sharp break of the local structure level, by targeting 80.534 structure level.
USDCHF Descending Channel on Bottom of Daily Channel
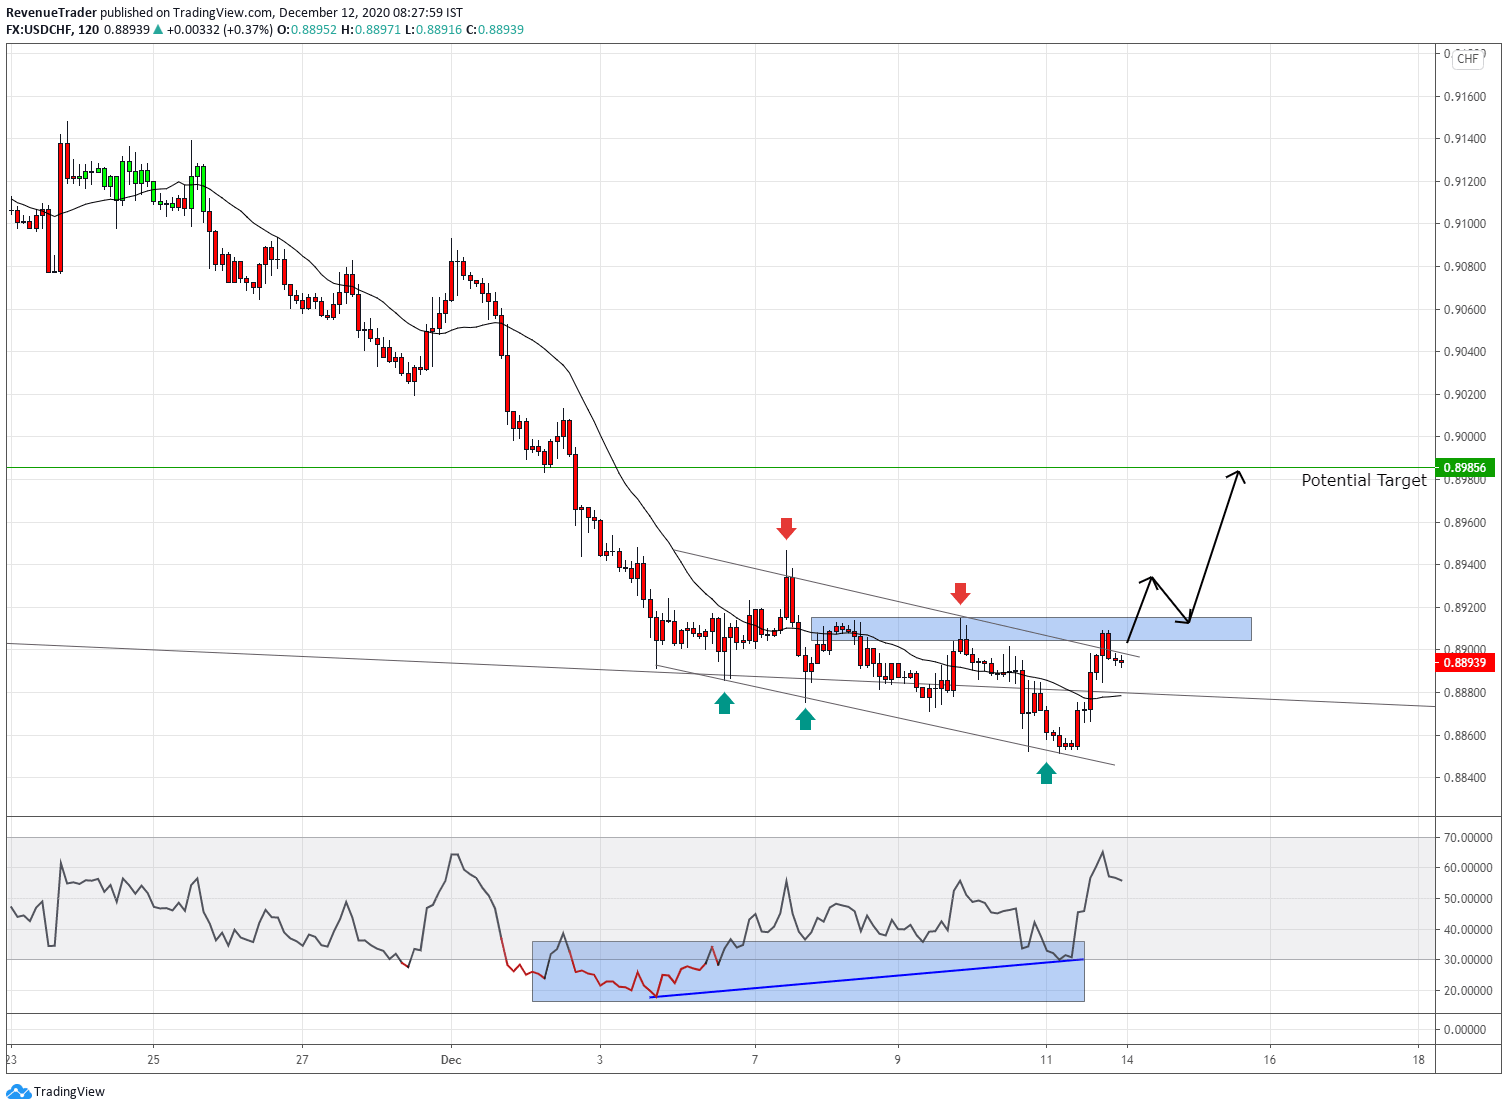
Key Level – At the moment USDCHF is trading right on the bottom of the descending channel comes from the daily chart. A bounce from this level is highly possible.
Descending Channel on 2 Hour – The marked descending channel on the above chart indicating the lack of selling pressure in the ongoing downtrend. The break above this descending channel increases the probability of happening a trend reversal.
RSI Divergence – Have a look at the RSI divergence, It is massive, right? This clearly shows the fading bearish momentum happening in this pair right now.
Market Forecast – at the moment USDCHF is trading inside the descending channel. As long as price trading inside of this pattern, it is neutral and if price break above the local structure level and descending channel, a bullish rally all way up to the previous structure level is highly possible.
Trade Idea – A break above the local structure level indicating the validity of this trade idea, If that happened we will consider going long by targeting 0.89856 level which is a previous structure level.
Finally, Besides these trade ideas, Do you have any trade on your radar? Let us know in the comment section.
Head over to Trade Revenue Pro Trading Blog to learn more about how to trade forex with Proven Trading Techniques and Strategies.
Want more Trade Ideas – Head over to Trade Idea Page.
That is all for this week and If you want constant trade updates – consider following Trade Revenue Por on Tradingview.
Also, consider following us on social media and Pinterest, Instagram and Facebook.


