The relative strength index (RSI) is a widely used technical indicator that measures the momentum of price movements. Just like the MACD indicator, RSI is also an oscillator type of indicator that generate buy and sell signals.
Today we are going to learn how to read RSI indicator in forex. specifically, we are going to learn about…
- How to read RSI over-bought and over-sold signals.
- How to use RSI divergence in forex.
- Why you should avoid RSI signals in trending market.
- A case study with trade examples.
Okay, Let’s dive in,
How to Read RSI indicator #1 – RSI Over-Bought and Over-Sold Signals
RSI Over-bought and Over-sold signal are one of the most popular and widely used trading signals. Some forex traders use RSI over-bought and over-sold as buy and sell signals. In fact, I use over-bought and over-sold as a trading signal to trade on the range-bound markets conditions.
So what is RSI over-bought and over-sold?
As you already know, RSI is an oscillator indicator that oscillates between 0 and 100 by default, RSI is considered overbought when it is above 70 and oversold when it is below 30.
Have a look at the sketch below,
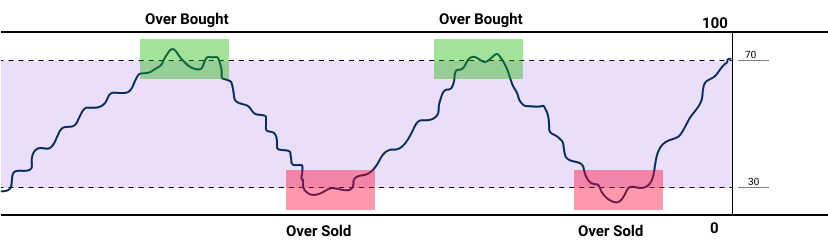
Now you’re familiar with RSI overbought and oversold, right? Next, Let’s see when and where to use RSI over-bought and over-sold signals.
How to Use RSI Overbought & Oversold Signal Correctly?
The overbought and oversold signal is one of the profitable (if used correctly) and easy to identity trading signal in forex trading.
So how to use correctly read RSI overbought and oversold signal? Anyone can read RSI overbought and oversold signal. It easy, right?
But only a few traders can call correct RSI overbought and oversold signals. So what is the secret of these traders?
It is called Market Condition.
Here is truth, If you trade every RSI buy and sell signal you’ll end up losing lots of money, specifically in a trending market, overbought and oversold signals becomes your worst enemy.
Then, Where we can use RSI overbought and oversold signal.
Based on my experience RSI overbought and oversold signal work best in range-bound markets.
Here is how Range-bound market looks like,
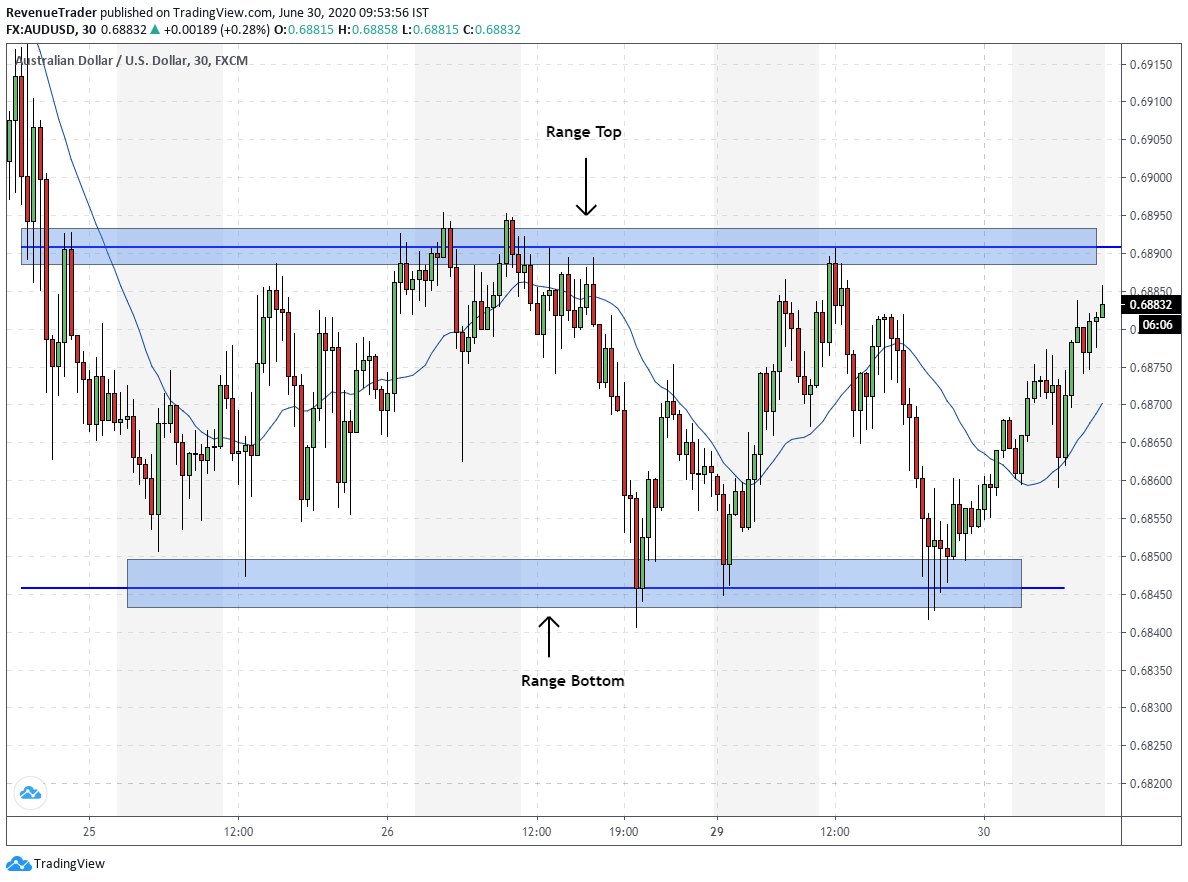
Now let’s see how to read RSI indicator in Range-bound market. Have a look at the USDCAD 2-Hour below,
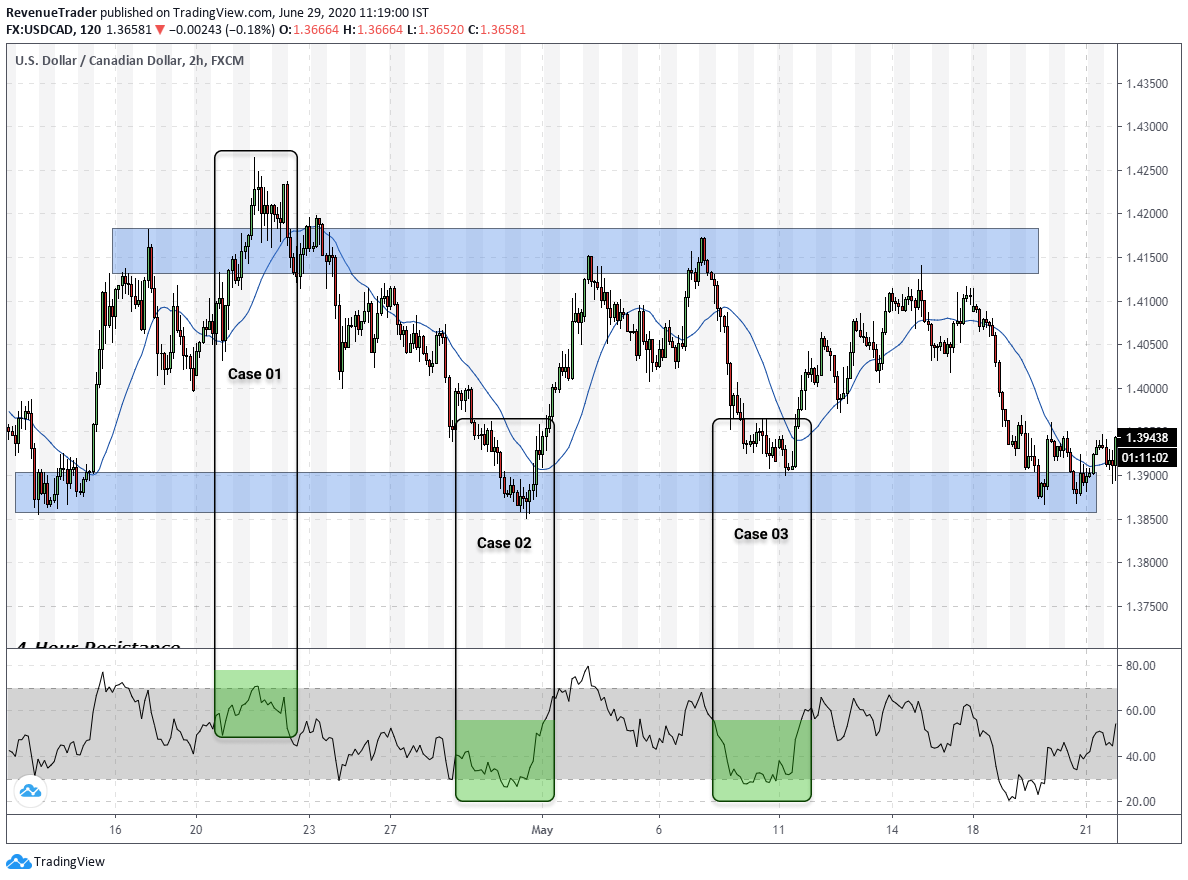
First of all, this is a range-bound market. Price is trading in between blue zones which act as resistance and support.
Now have a look at the case 01,
According to case 01, price is trading around the range-top (resistance). At the same time, RSI is also showing overbought signal. What happened after that? Price fell from the range top very strongly and hit the range bottom.
Next, Have a look at case 02,
The same thing happened but oppositely. According to case 02, RSI showed oversold signal as price approached the range bottom. Just like the previous case, this time also price ended up moving higher.
Case 03 is totally identical to case 02. We got RSI oversold signal right at the range bottom and the result is exactly the same as case 02.
As you saw RSI oversold and overbought signals work better in a range-bound market. If are that kind forex trader who skips trading on range market, I’m saying you should consider it again. Give it one more shot.
Learn more about RSI indicator – The ultimate Guide to the RSI indicator + Free Bonus Strategy
Next…
It is time to talk about RSI divergence, one of my favourite reversal signal that proven to be profitable over and over again.
How to Read RSI Indicator #2 – Identify Reversals Using RSI Divergence.
RSI divergence is one of the best indications when it comes to identifying market reversals.
So what is RSI divergence and how to identify it?
A divergence form when price action and the RSI indicator is doing the opposite thing.
In a downtrend scenario, Price makes lower lows but the RSI indicator makes lower highs.
And in an uptrend, price actions make higher high but the RSI indicator makes higher lows.
Have a look at the chart below which shows RSI divergence in action,
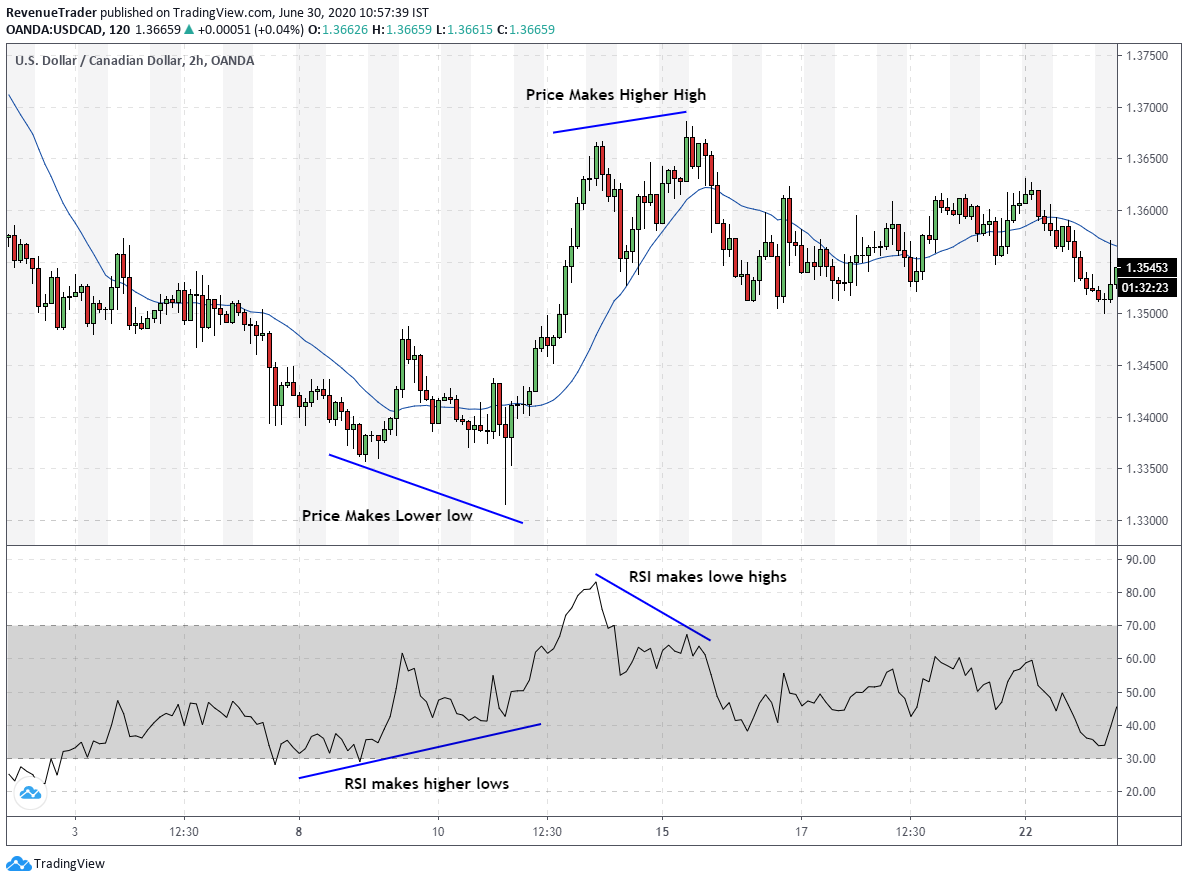
That is how RSI divergence looks on a forex chart.
Next, Let’s see how when and where to use RSI divergence.
How to Use RSI Divergence to Determine Trend Reversals
The overbought and oversold works better in range-bound market condition. Just like that, RSI divergence also has its favourable market condition. That is the trending market.
We are using RSI to identify trend reversal, right? Which mean we need to have an established trend beforehand.
Now Have a look at the USDCAD 2-Hour chart below,
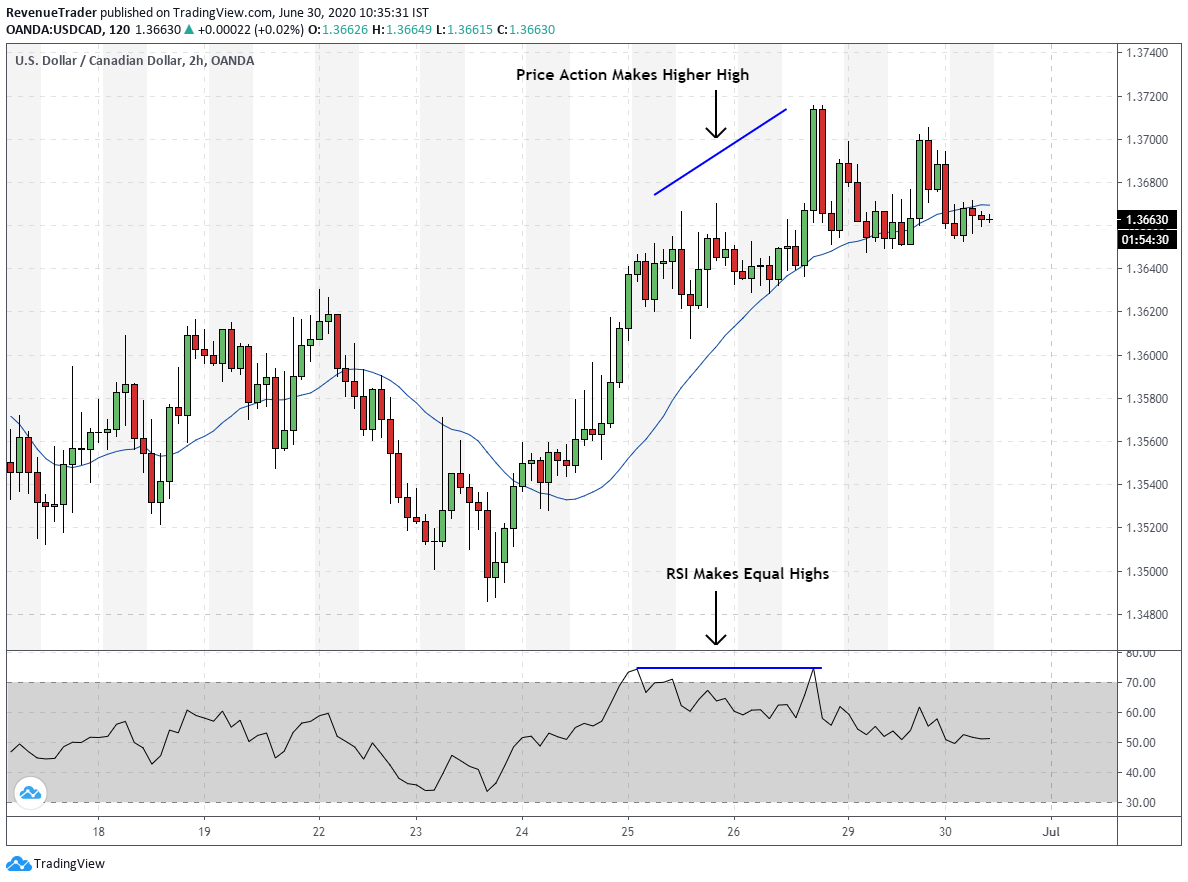
What have you noticed in the above chart? A strong uptrend, right? Is that all? Then you’re missing out very important clue here.
Let’s take above naked USDCAD chart and build trend reversal trade setup. That’s sound better, right?
Okay, What is our first clue? RSI divergence. I already marked that on the above chart.
Next… We have another very important clue. Can you identify that?
Okay have a look at the chart below,
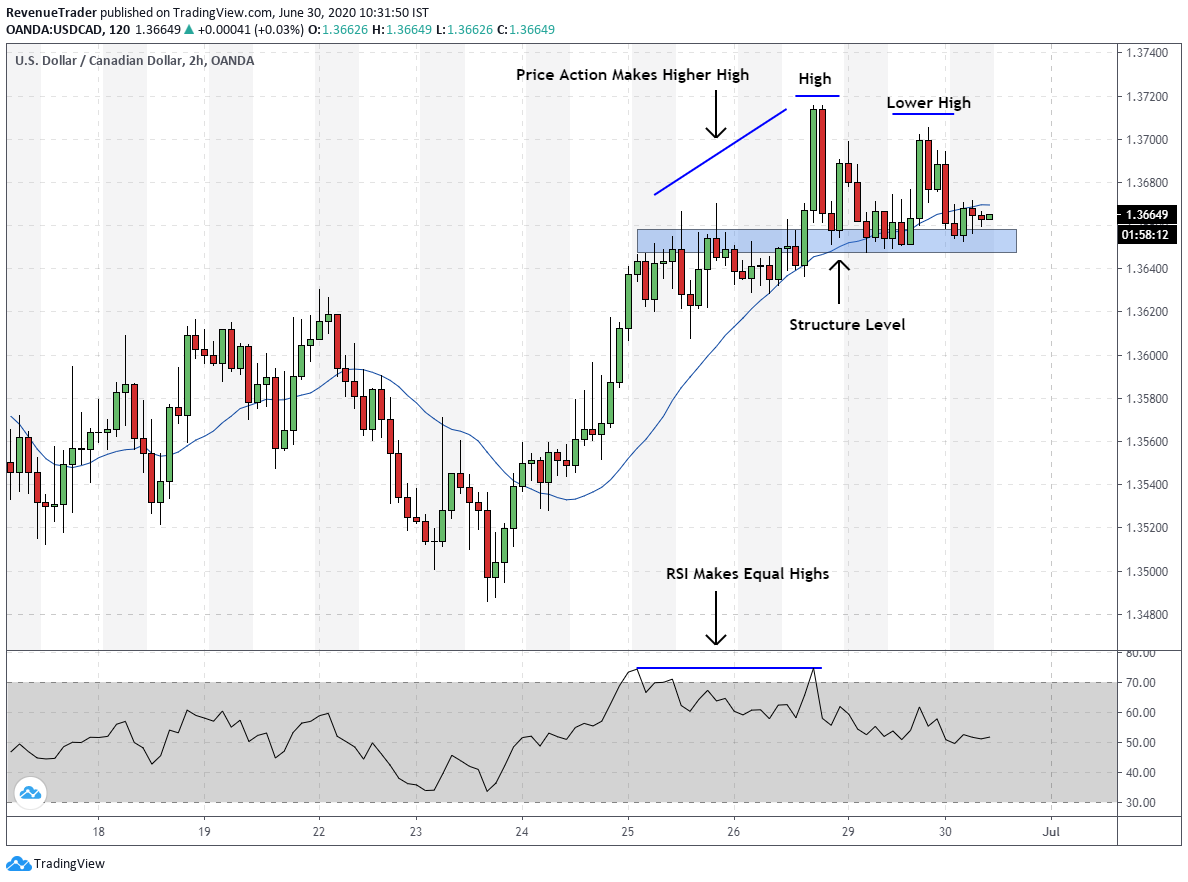
Wow. This is an interesting chart, right? As the chart said above, all the trading confluences indicate reversal signals. Now how to sell this market. That is why we mark structure level in the above chart. We are looking for a break below of that structure level and then we consider going short.
Learn more about RSI divergence – How to trade RSI divergence – 4 Practical Entry Techniques
Okay now you know how and when to use RSI divergence and RSI overbought and oversold signals, right?
What about the trending market? Is there a way to use RSI in trending market? Let’s talk about this?
How to Read RSI Indicator in Trending Market
By now, you are familiar with how to use RSI overbought/oversold and divergence in the right market condition.
So, What about the trending market? Can we use RSI in an uptrend or downtrend?
Well, In a market with strong uptrend or downtrend, the classical trading signal of the RSI indicator is much less profitable.
Have look at the USDCAD uptrend market below,
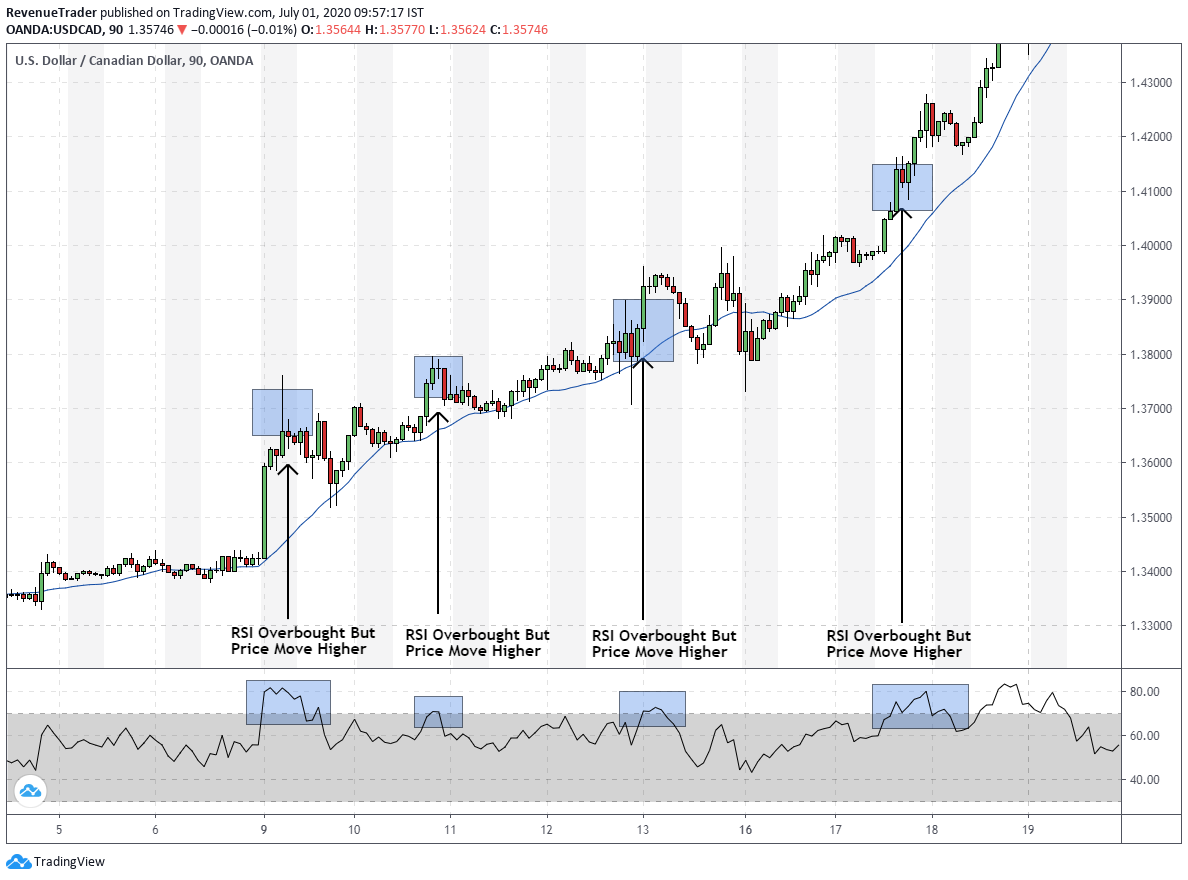
The above USDCAD chart shows sharp uptrend with a series of higher highs. Even a beginner trader can easily identify this uptrend. Now have at the RSI overbought signals that occurred during the uptrend.
What have you noticed? Every RSI overbought signal that occurred were false, right? This is the downside of the RSI indicator. When the market is in a sharp uptrend or downtrend, the RSI indicator tends to give lots of false signals.
As long as the uptrend or downtrend continues to increase, it is a good idea to simply ignore the sell or buy signals displayed by the RSI indicator.
Now you know what kind of market condition you should consider or ignore when trading with RSI indicator.
Next, Before wrap this article let’s talk about some of the real-world trade examples.
Learn How To Read RSI Indicator With Trade Examples
Let’s start with GBPJPY trade. Actually, we post this trade on our Instagram.
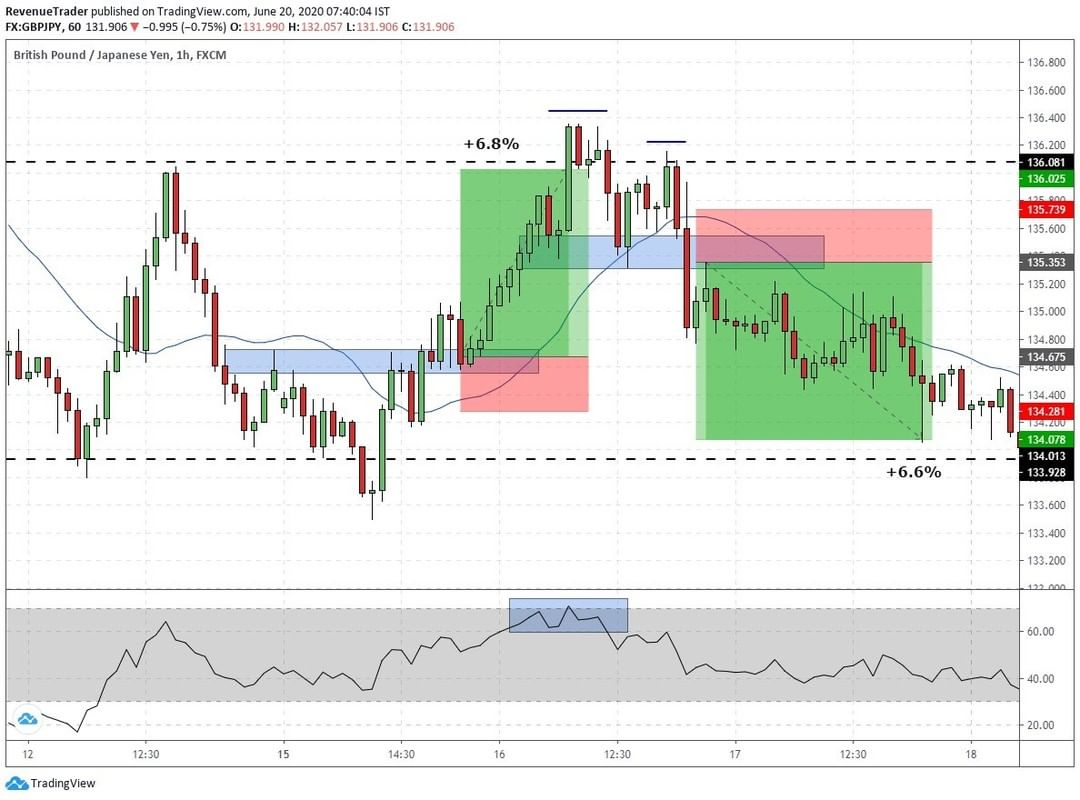
Have a look at the second trade in the above chart.
First of all, we can see that GBPJPY is trading inside a range. The marked RSI overbought signal (blue box) occurred when the price was at range-top, right?
So what happened after that? Price did reverse all the way to down to range bottom.
If want to know how to trade like these – Check out this article.
Next, Have a look at the USDCAD uptrend below,
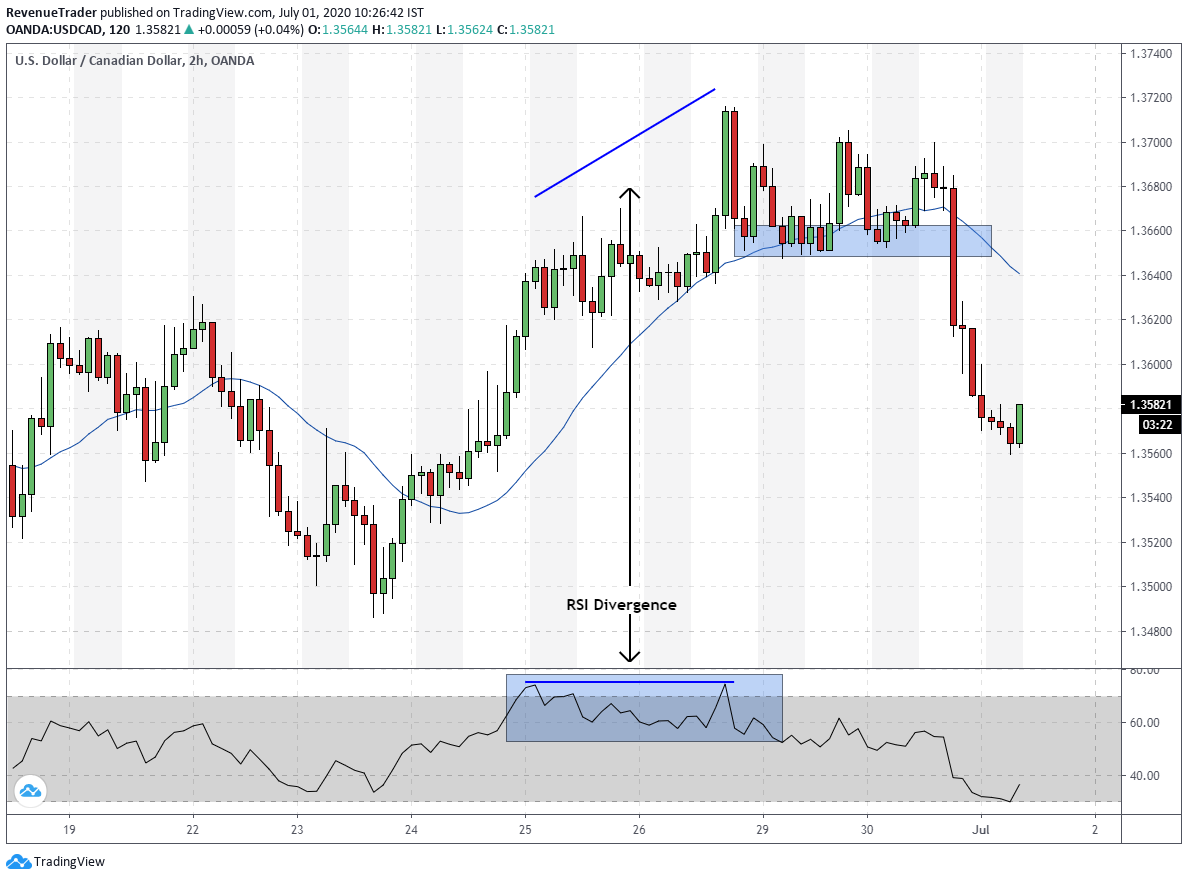
This is a Reversal market condition, right?
If you look left market was in strong uptrend but eventually, RSI stops creating higher highs while the price keeps on forming higher highs. This is what we called RSI divergence. Observer the above chart.
So what happened after the RSI divergence? Price starts to slow down and stop forming new higher highs. This is a good reversal sign.
In the end, the price ended up reverse very sharply.
Head over to our Instagram or Facebook for chart analysis like these.
Conclusion
Now you are a pro when it comes to reading RSI indicator in forex, you know how to use it and what kind of market condition you should use and more. Is that enough to earn consistence profit from the forex market?
NO!
Even if you become a master of technical analysis, the door to consistent profit is still close to you. Why is that?
Because there are lots of factors that contribute to trading success. Technical analysis is just one part.
Trading psychology (Knowing how to handle trading loses and drawdown, Trading in a period of consecutive loses), Risk Management, Money Management and Journaling, all of these are contributes to trading success.
Trading in the Zone by Mark Douglas is my favourite trading book all the time when it comes to trading psychology. Because of this book, Now I can calmly trade in any situation. So I highly Recommend to Read Trading in the Zone for any forex trader.
Finally, Let me know your thought about the RSI indicator in the comment section.


2 Responses
This was super helpful for a new trader like myself.
Glad you found this helpful.