
What they said, “Trend is our Friend”.
I’m sure that you heard about this at some point in your trading career.
So, is the trend really on our side?
As a trend and reversal trader, without any hesitation, I can say that trend is our friend and as long as you’re trading in the direction of the general trend the odds are going to work in your favour again and again.
So in forex trading, traders use different types of indicators to define trending markets. The most common indicator is the moving average. It helps traders to identify which market is trending and which market is not trending.
Related Reading – What is Moving Average in Forex & How to Use it (4 Practical Ways)
Just like the moving average, we can also use the Supertrend indicator to find the trending markets as well.
Why use the supertrend indicator?
For me, it is because it plots the supertrend on the chart using ATR and ATR multiplier, which means that when the supertrend indicator shows a trending market, it also tells where our stop-loss should be, and placing stop-loss using supertrend is one of the most effective ways of placing stop-loss.
Another reason is that when the market is in a strong trend, we can use the supertrend indicator to catch the whole trend by trailing stop-loss with the supertrend indicator.
For an example have a look at the chart below.
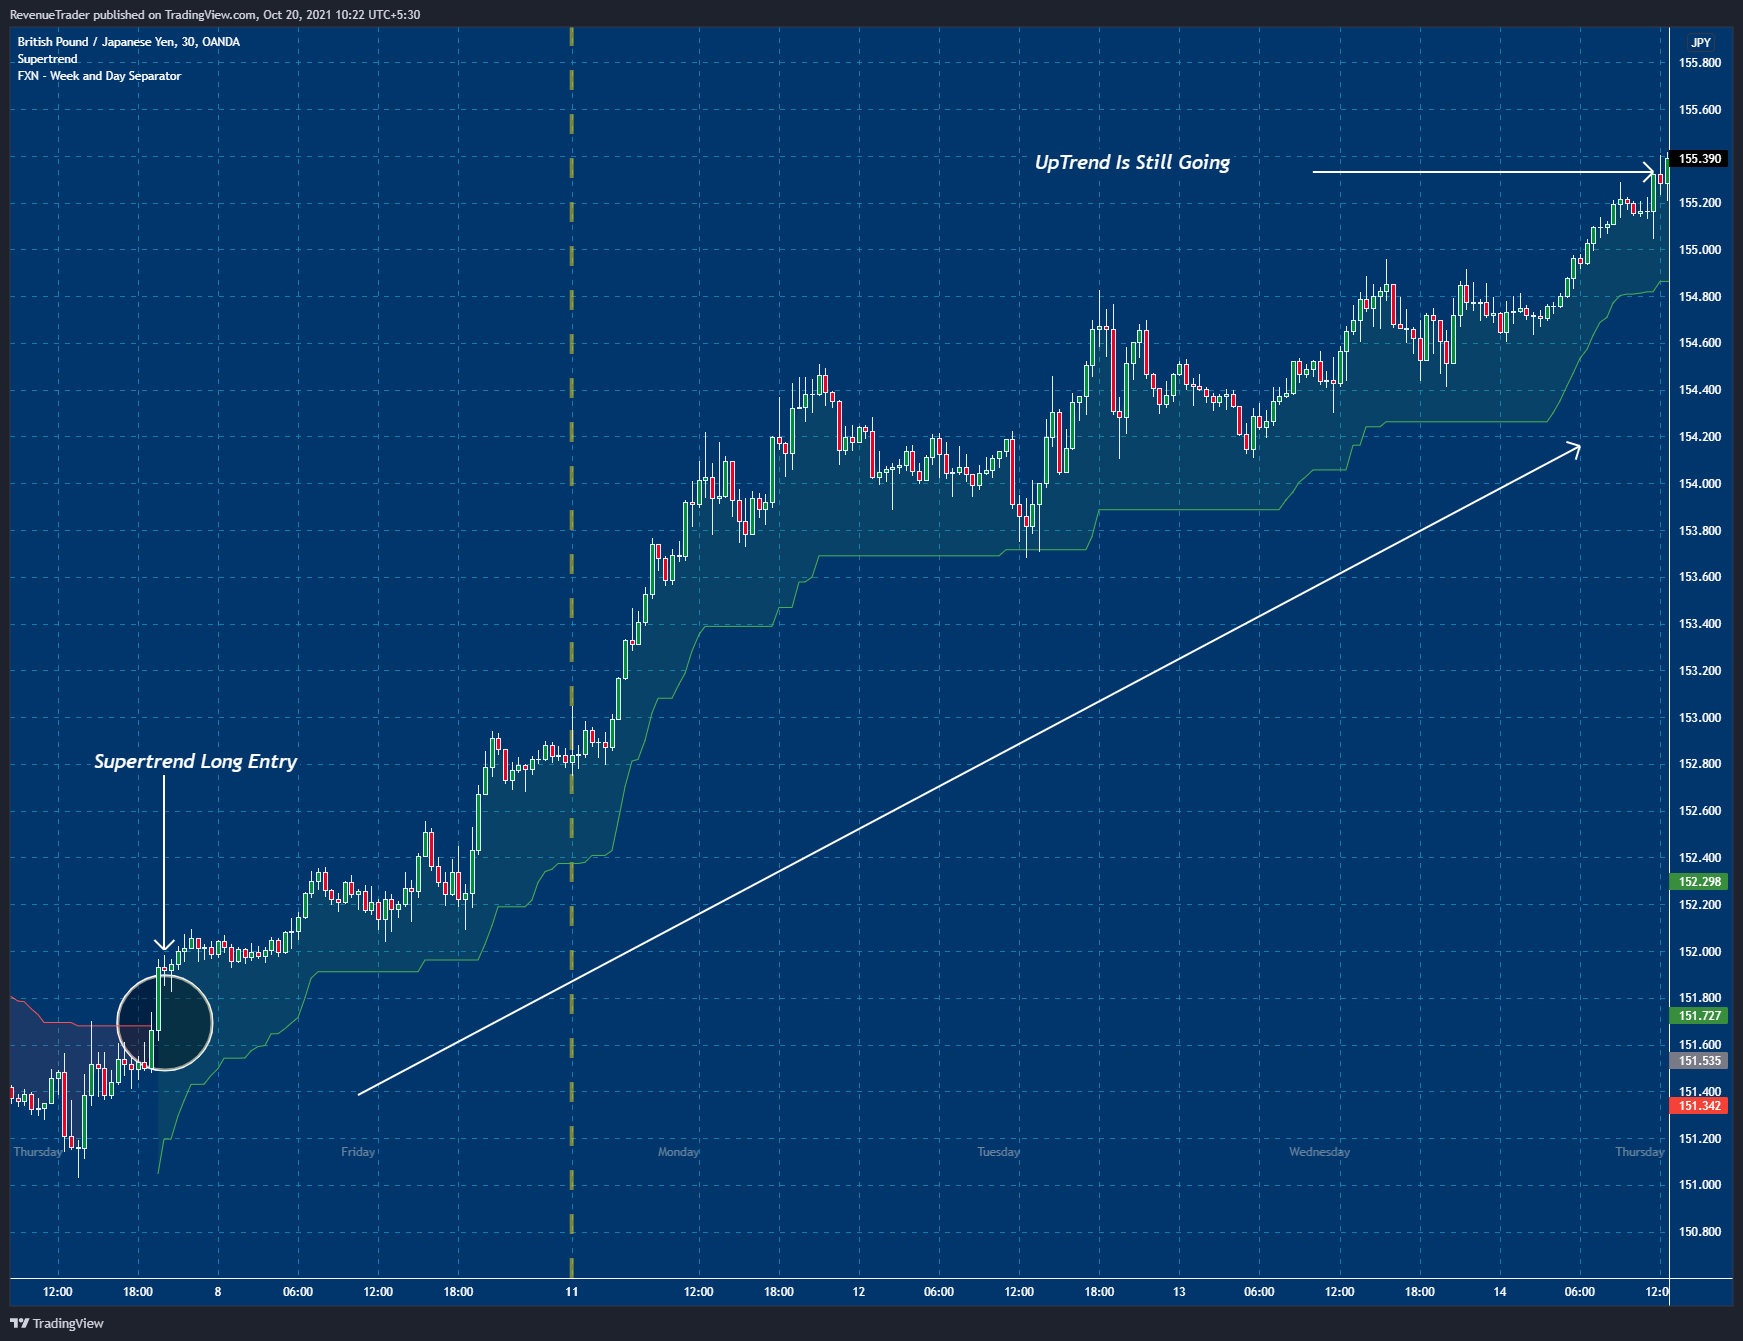
According to the above chart, you can see that the supertrend indicator help us to capture the strong ongoing uptrend early as well as it helps us to ride the trend to get the maximum out of that move.
So as you know now, the supertrend indicator tends to work perfectly in the trending markets.
But…
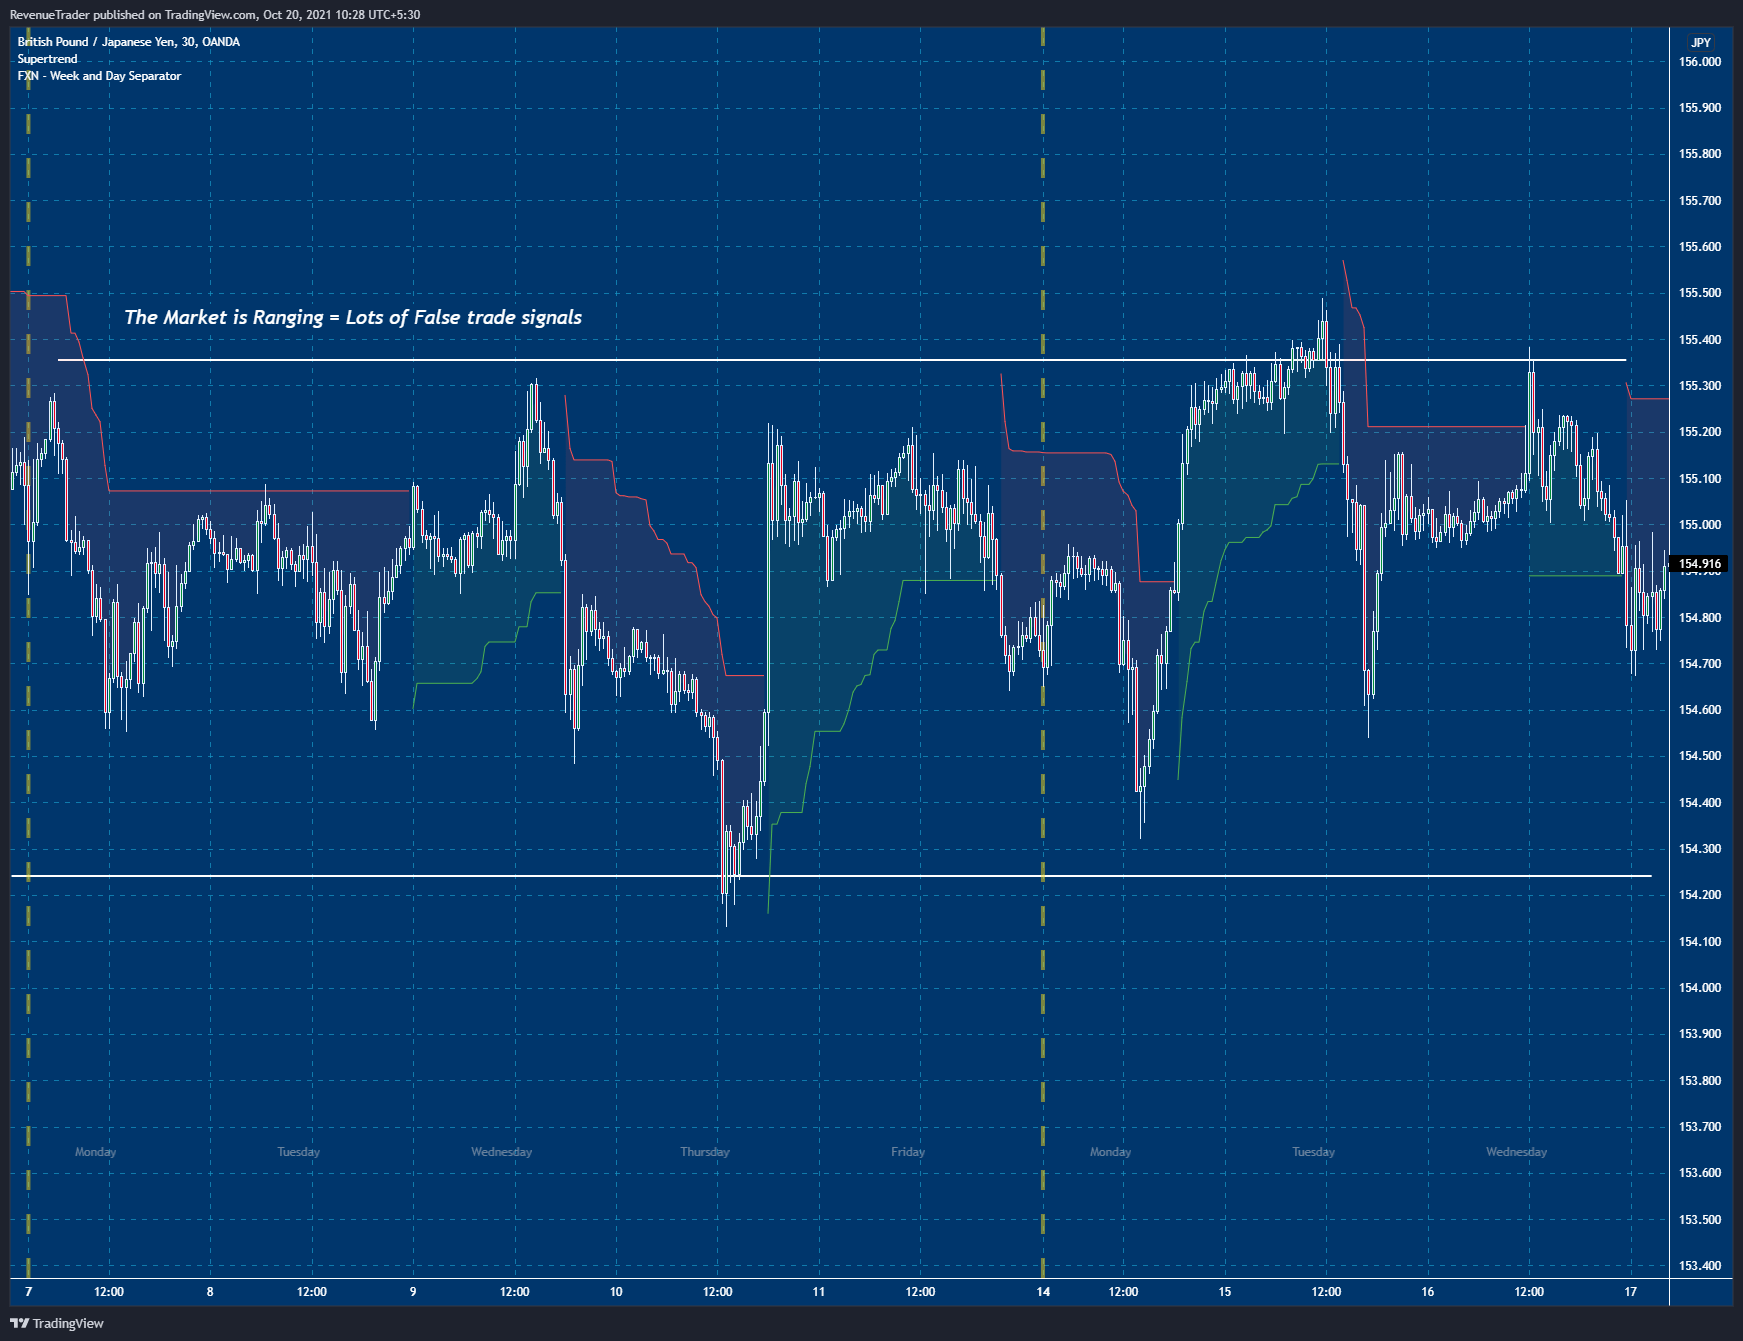
When the market is in a range, supertrend tend to give lots of false trading signals. For example, have a look at the chart below,
Now the question is, Is There Any Way to Avoid These Falsy Signals?
Yes, we will talk about it in the future chapters.
Also, we are going to talk about a highly profitable supertrend indicator strategy that generates simple buy and sell signals.
With that let’s talk about…
What is Suprertrend Indicator?
SuperTrend is a technical indicator that can be used to identify trends and provides buy and sell signals. It can be applied over a variety of timeframes (e.g., 5 minutes, hourly, daily), however, a shorter timeframe may result in a higher frequency of signals being created. It often alternates between two colours: green and red, showing whether the trend is shifted to the upside or to the downside.
Now how the supertrend is working?
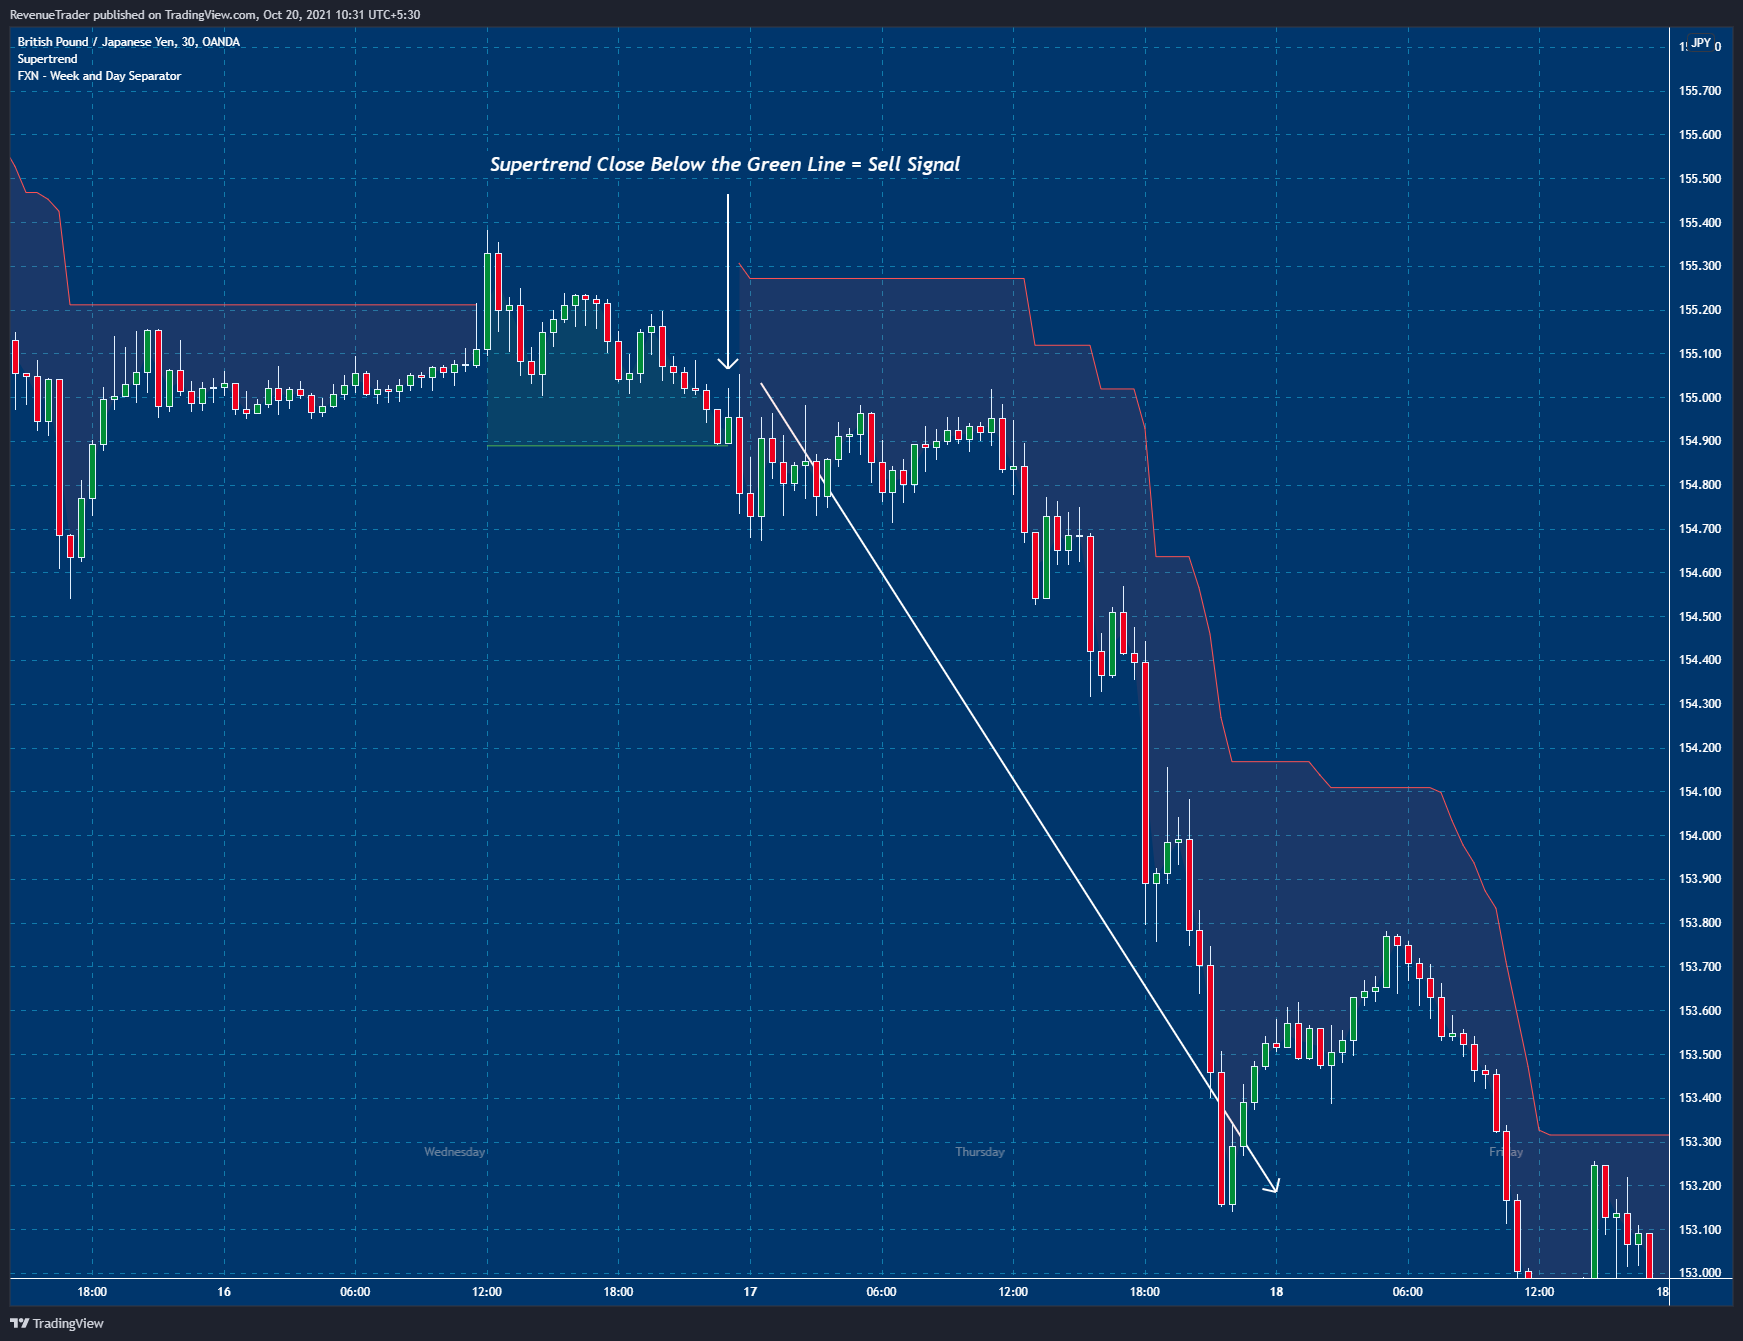
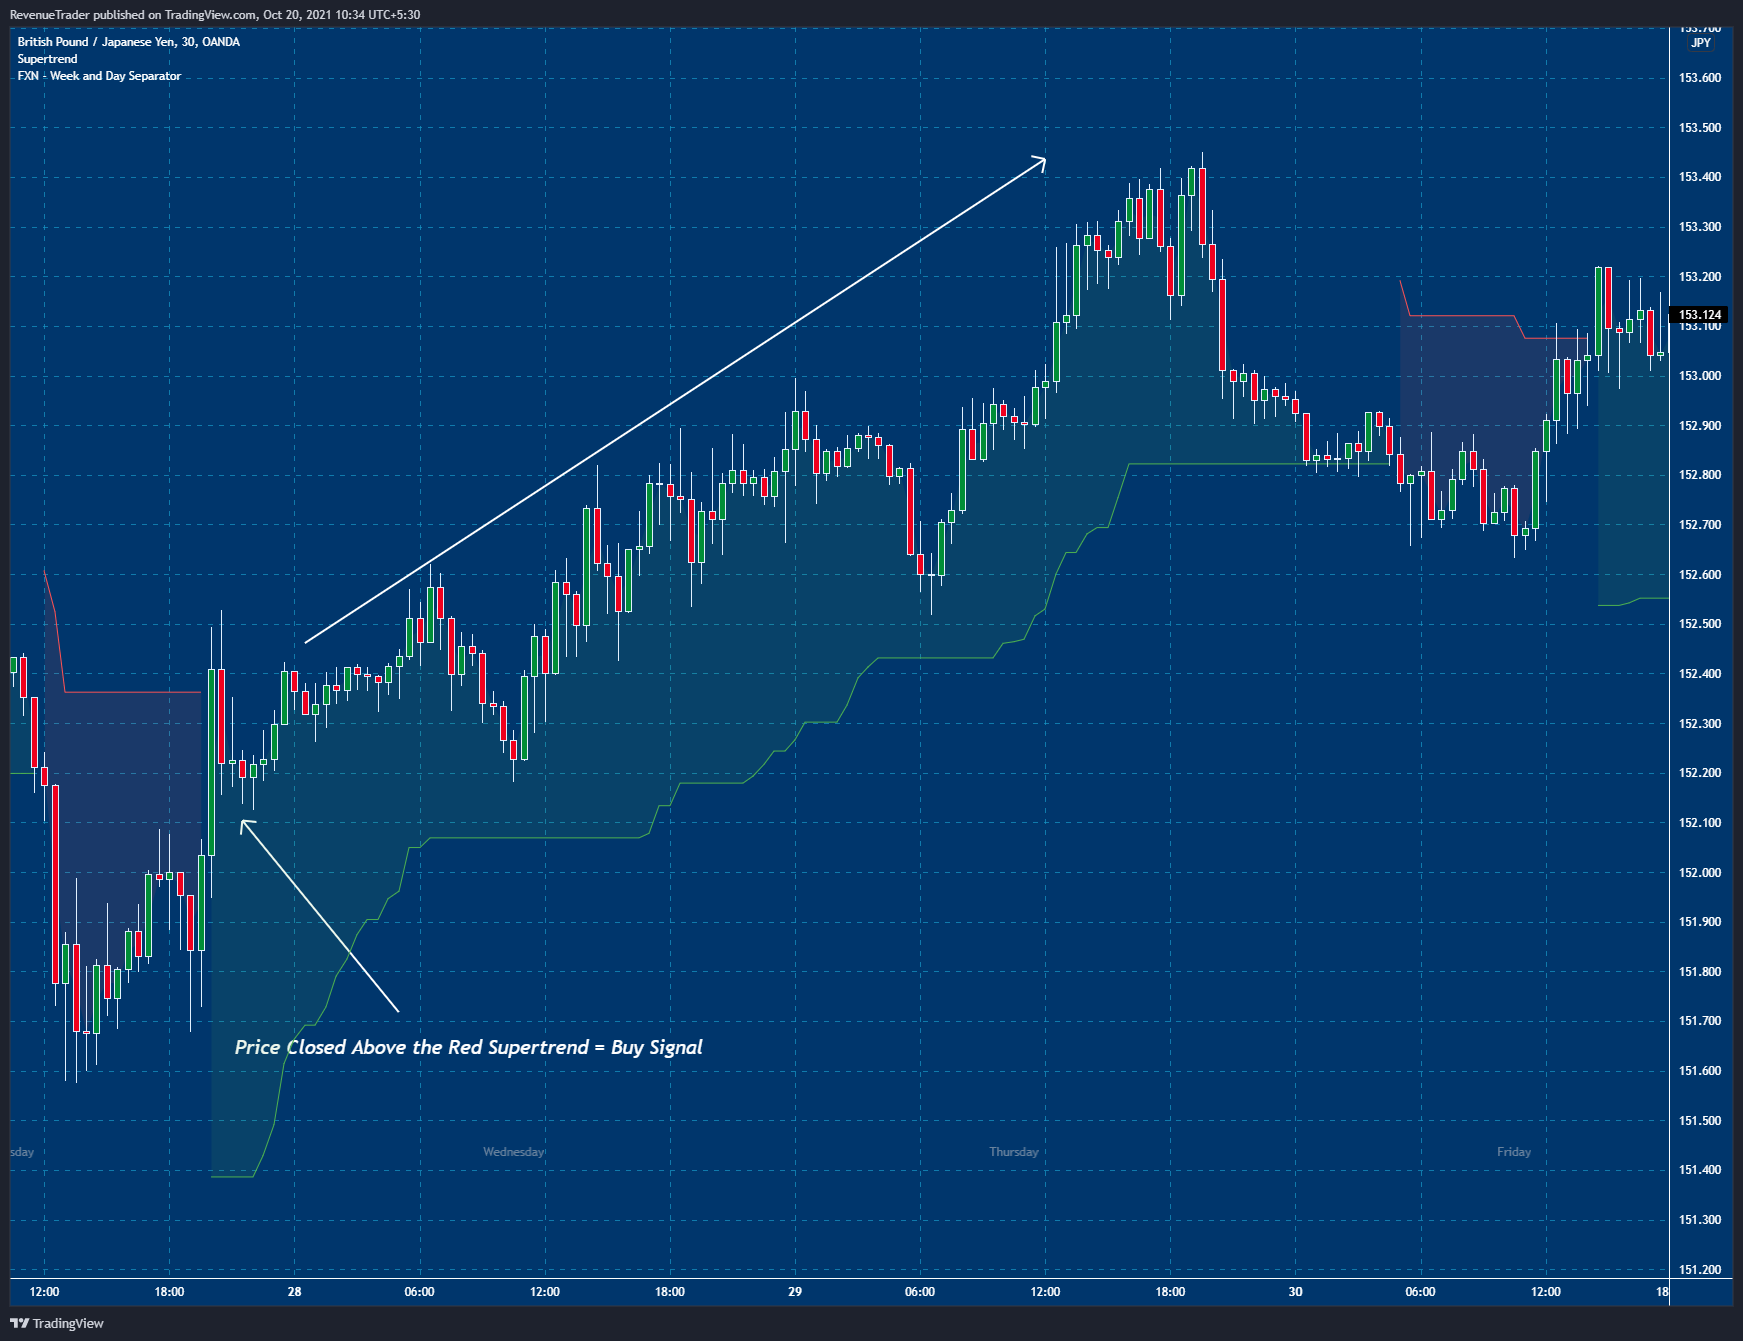
It is simple. When the SuperTrend is shown below the closing price and the colour changes from red to green, a buy signal is generated. When the SuperTrend is drawn above the closing price and the colour changes from green to red, a sell signal is generated.
Have a look at the chart below.
Sell signal generated by the supertrend indicator.
Buy signal generated by the supertrend indicator.
Supertrend Formular and Calculations?
The default setting for the supertrend is 10 and 3. Have a look at the image below.
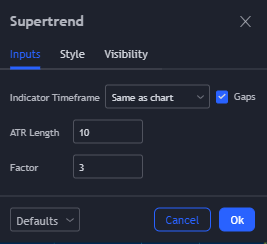
Any changes to these numbers can affect the way the supertrend indicator is plotted in the chart.
Basically smaller setting means that the supertrend tend to catch a smaller trending market and therefore more trading signal will be generated while the higher setting tend to focus on bigger trends and therefore trading signals will be generated.
Calculations for the supertrend is shown below,
Up = (high + low / 2 + multiplier x ATR
Down = (high + low) / 2 – multiplier x ATR
Calculation of Average True Range
[(Prior ATR x 13) + Current TR] / 14
Here, 14 indicates a period. Hence, the ATR is derived by multiplying the previous ATR with 13. Add the latest TR and divide it by period.
Thus, ATR plays an important role in the supertrend technical analysis indicator.
How to Use Supertrend in Forex Trading?
As I stated previously, the supertrend indicator tends to give lots of false trading signals in the range market and when the market is trending, the supertrend indicator tends to give lots of profitable trading signals as well.
Now you may be thinking, is there any way to avoid these false signals and focus only on higher profitable trading signals?
Well, by using 200 SMA we can avoid some of these false signals but it’s impossible to trade without losses, right?
As traders, we all have to agree that, losses are part of the game.
So my point is, just like any other strategy out there this supertrend trading strategy is also suffer from losses and that is okay.
Now with that in mind, let’s see how to set up the trading view chart before straightly diving into the trading strategy.
Have a look at my chart,
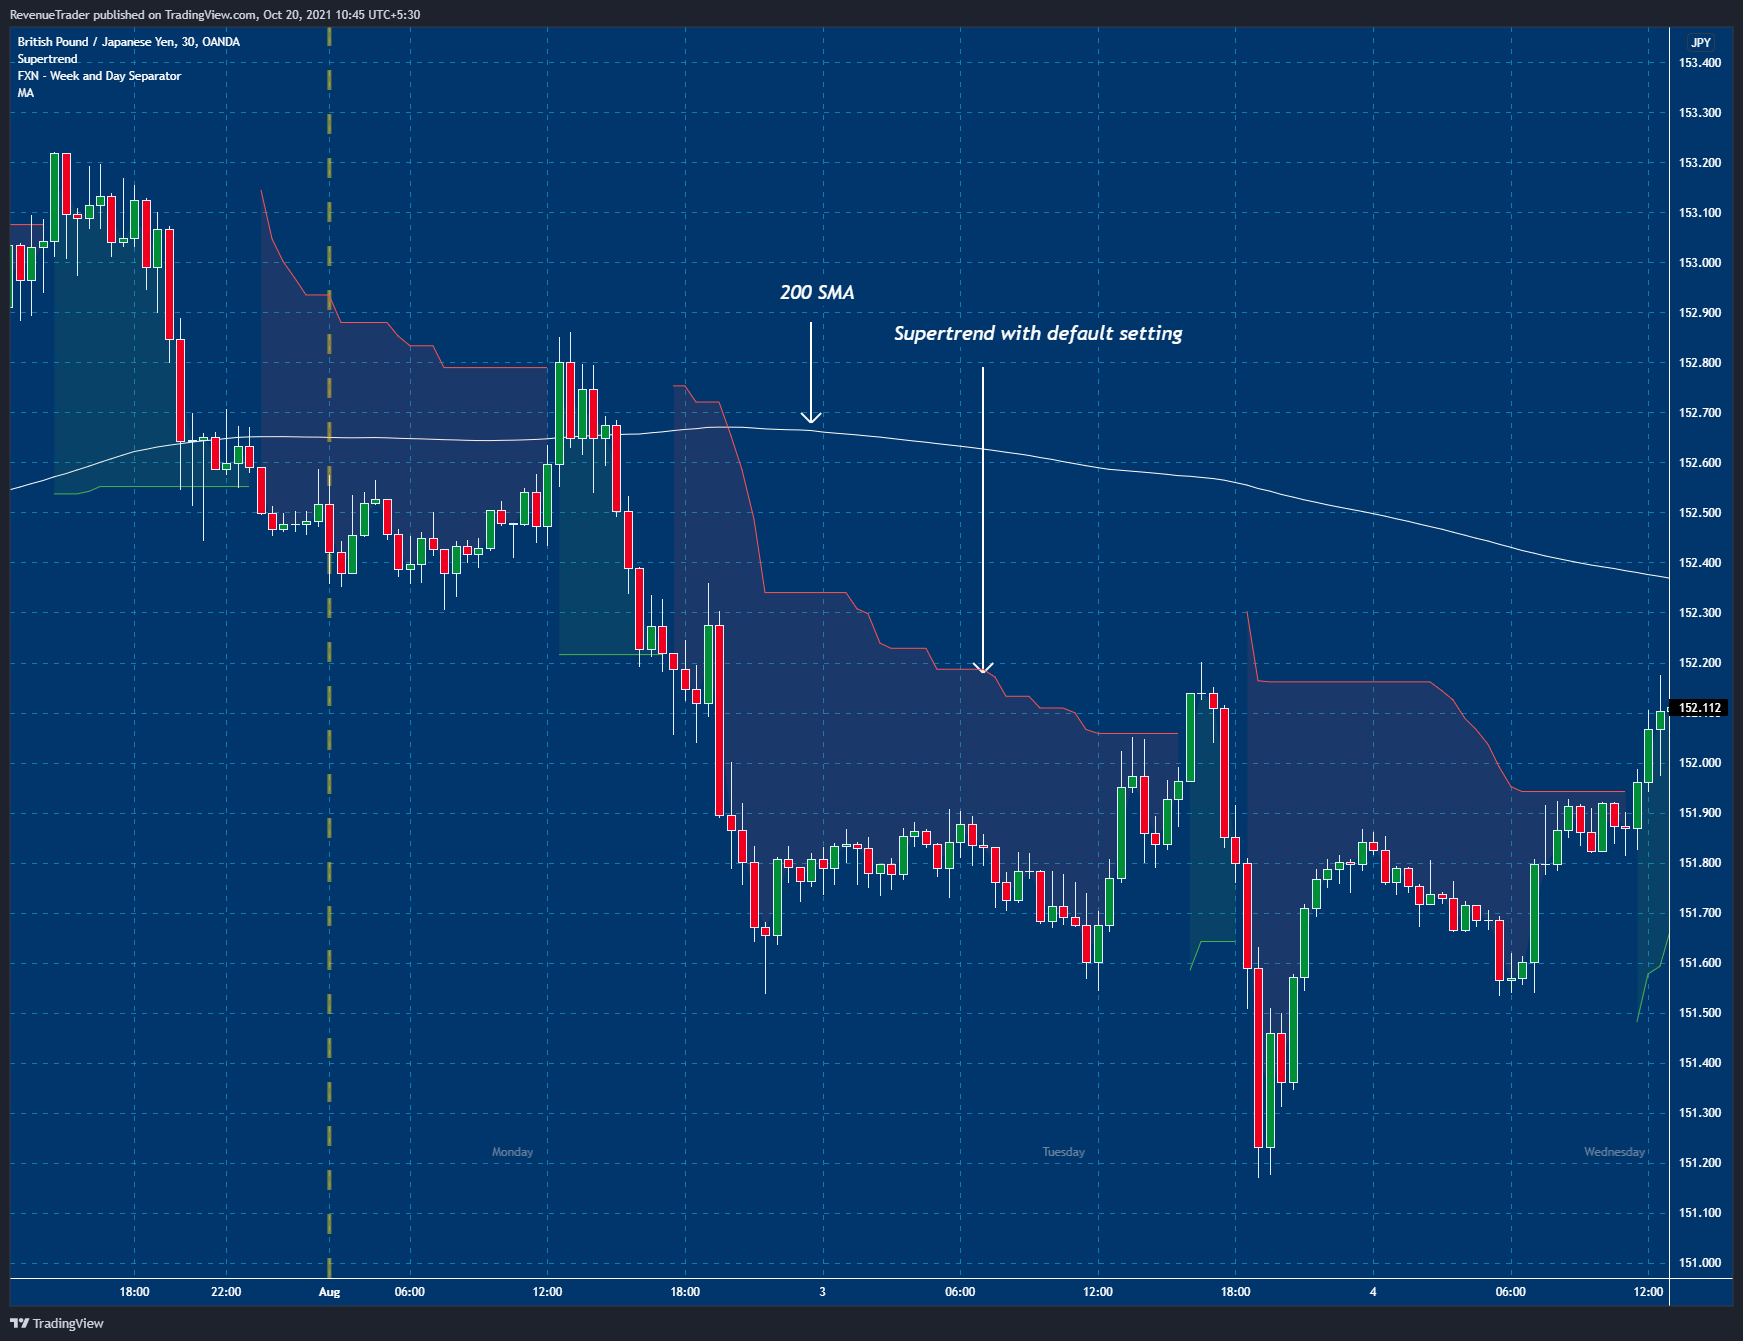
In the above chart, I have added 200 SMA to define trending markets and supertrend indicators with the default setting (ATR Length – 10 and Factor – 3) to generate trade entries.
Ok, now the chart is ready.
Next…
How to Define Trending Markets?
As discussed earlier, when trading with the supertrend indicator we should always look for trending markets and should trade in the direction of the general trend to avoid false trading signals.
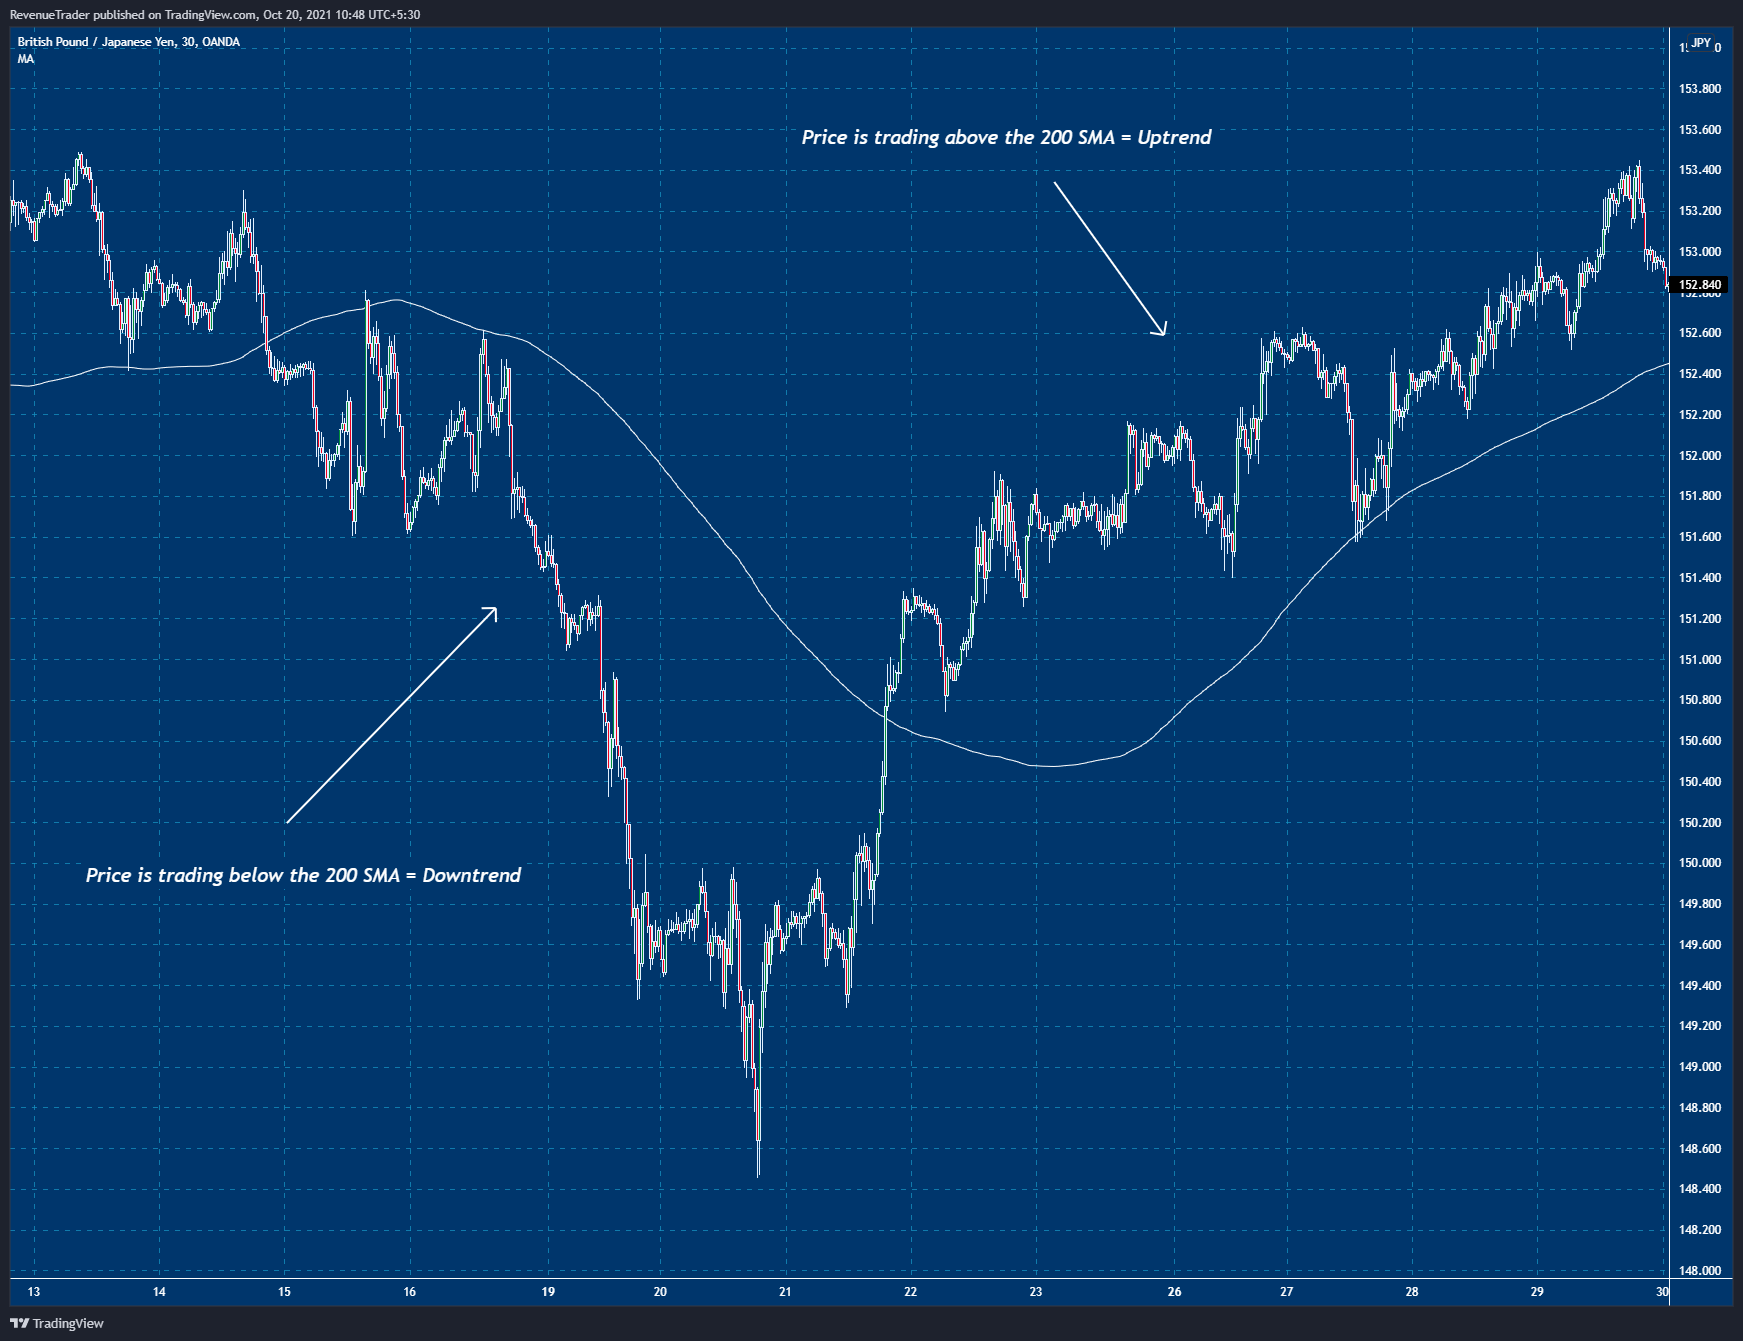
Therefore I use 200 SMA to find trend markets. But how?
It is easy. When the price is trading above the 200 SMA it is signalling an uptrend and when the price is trading below the 200 SMA it is signalling a downtrend.
Have a look at the chart below.
Long Trade Entry
Ok, now we know how to define trending markets using 200 SMA. Next, let’s see how to find a buy trade setup during an uptrend. Note that when the price is trading above 200 SMA we only for long setups only.
Have a look at the chart below.
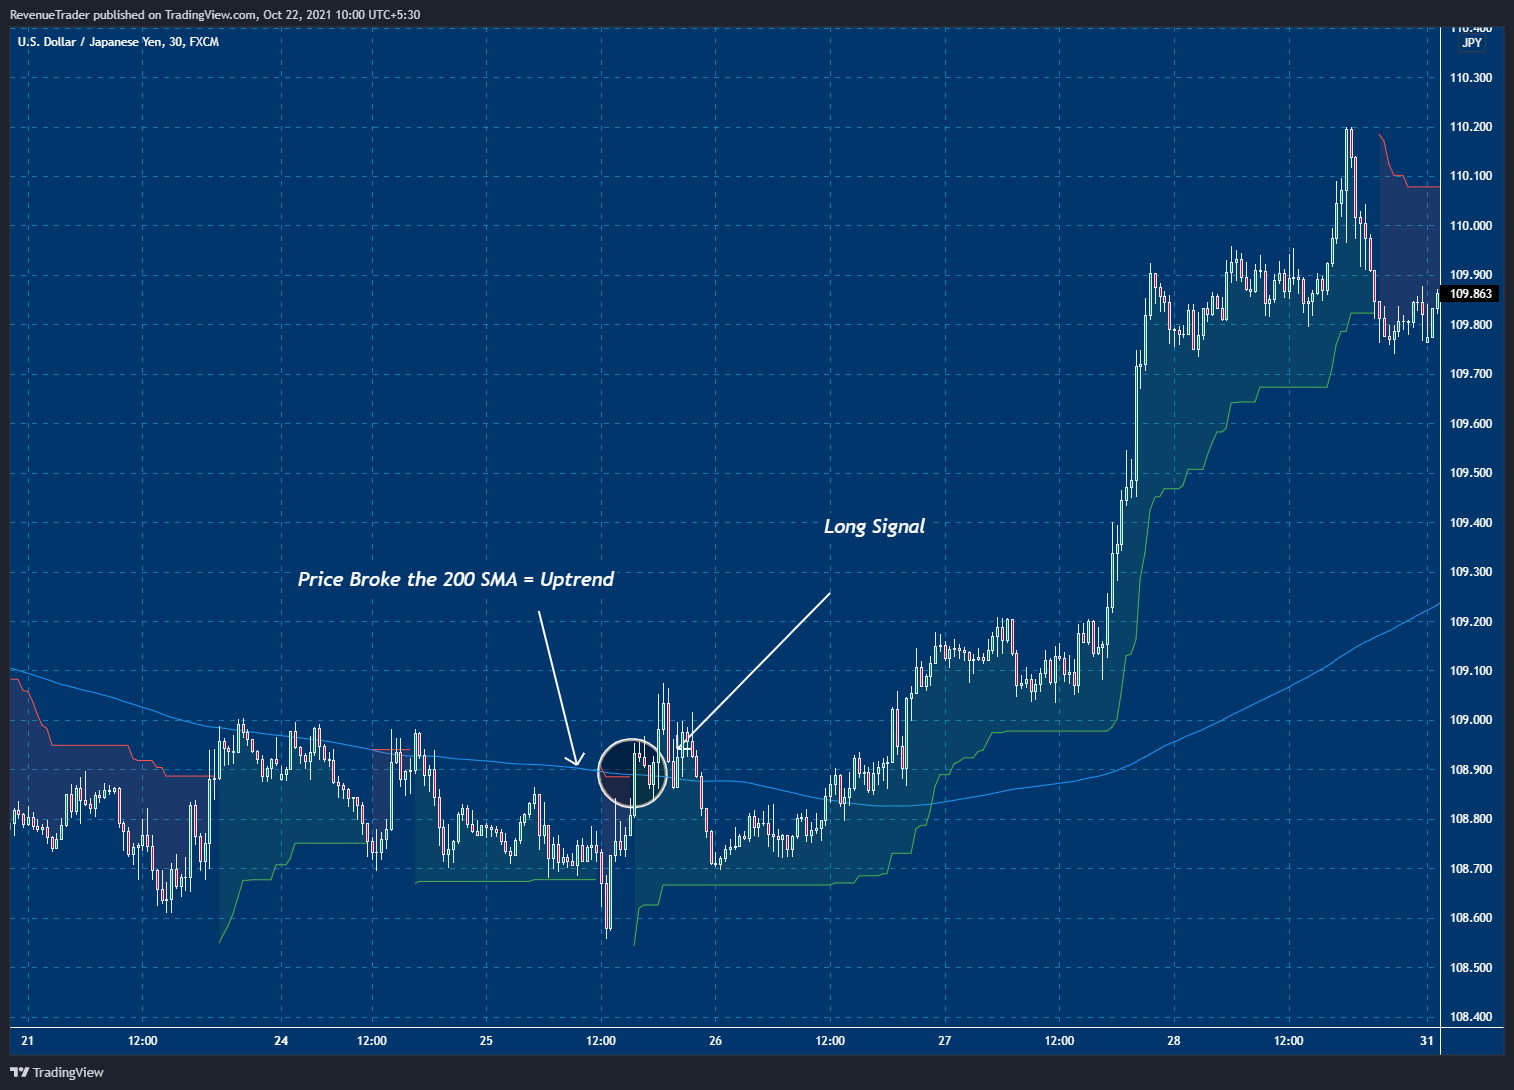
Now, we can see that the price has broken above the 200 SMA, signalling an uptrend, as shown in the chart above.
Next, have a look at the yellow circle. On there price break above the red supertrend line signalling a buy trade. On there we look for a long trade setup.
Now, how to enter the trade and place Stop Loss? For that have a look at the chart below.
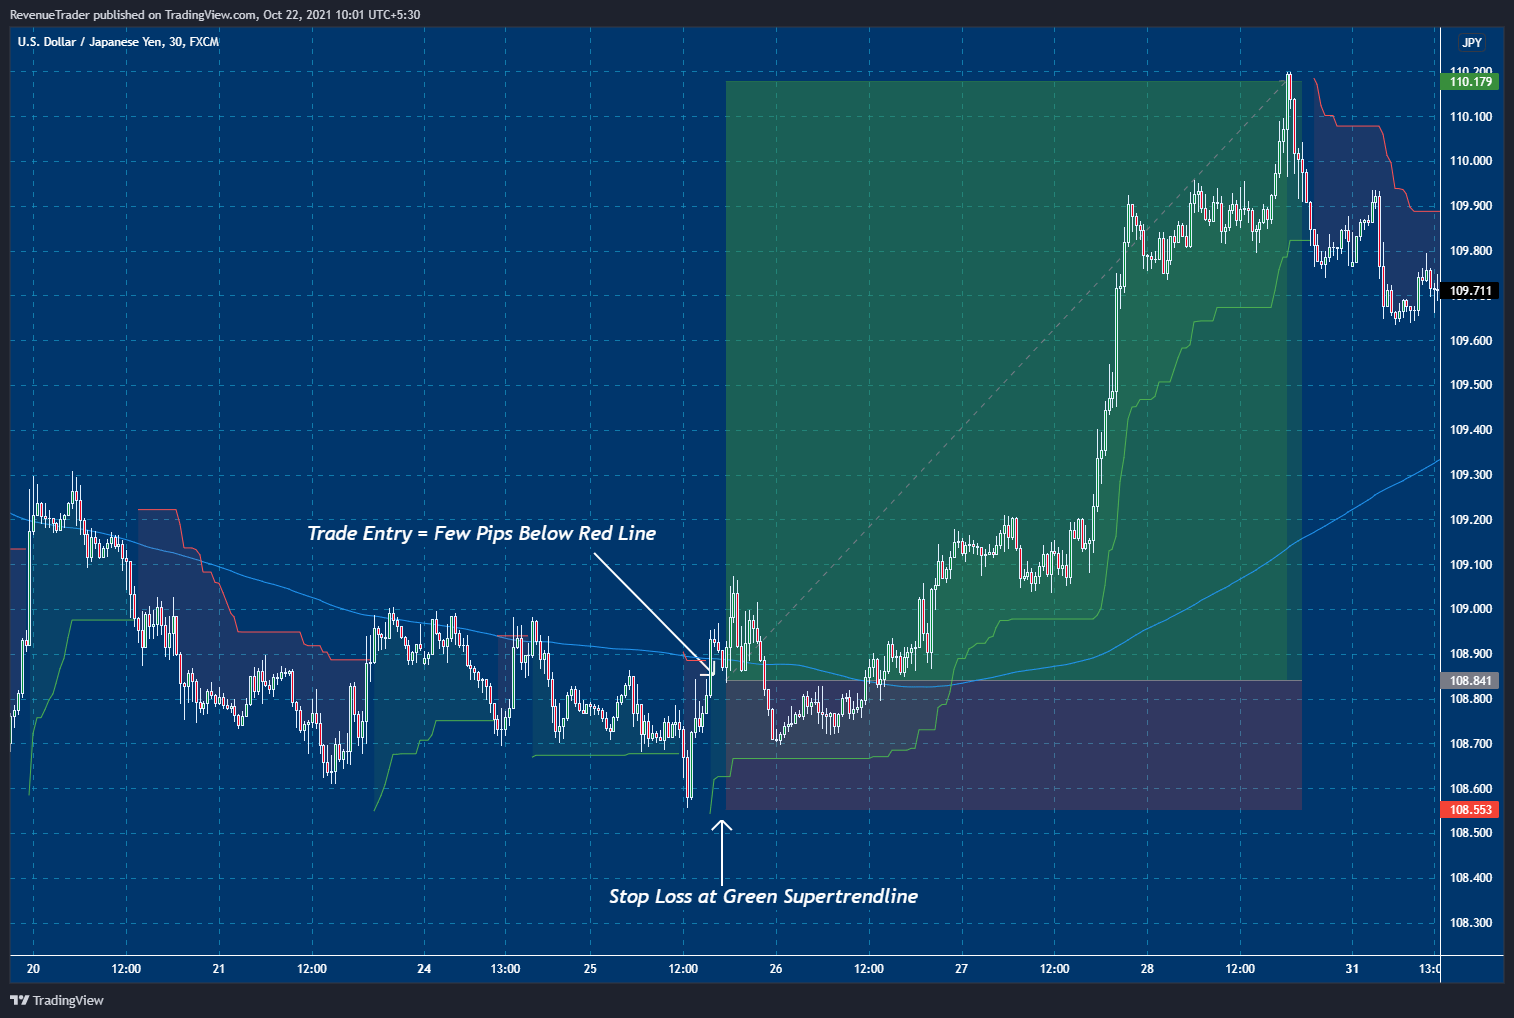
As you guys can see in the above chart, we can place entry at a few pips below the red supertrend line.
By placing the entry a few pips below the red supertrend line, we can get a favourable risk to reward ratio for our trade. Of course on the other hand we missed a few trades here and there, but missed trades doesn’t cost us anything. Therefore missing a trade or two is not a big deal.
Again, have a look at the above chart, specifically have a look at how we placed the Stop-Loss. According to the above trade, we place the stop loss right at the green supertrend line. It is simple as that.
We still missing a part though. That is take-profit. Now how to place the take profit order. It is simple, all you have to do is place your take-profit 5 times bigger than your stop loss. AKA your take-profit should be 5R.
For example, if your stop-loss is 10 PIPs, then your take profit should be 50 PIPs. Have a look at the below chart.
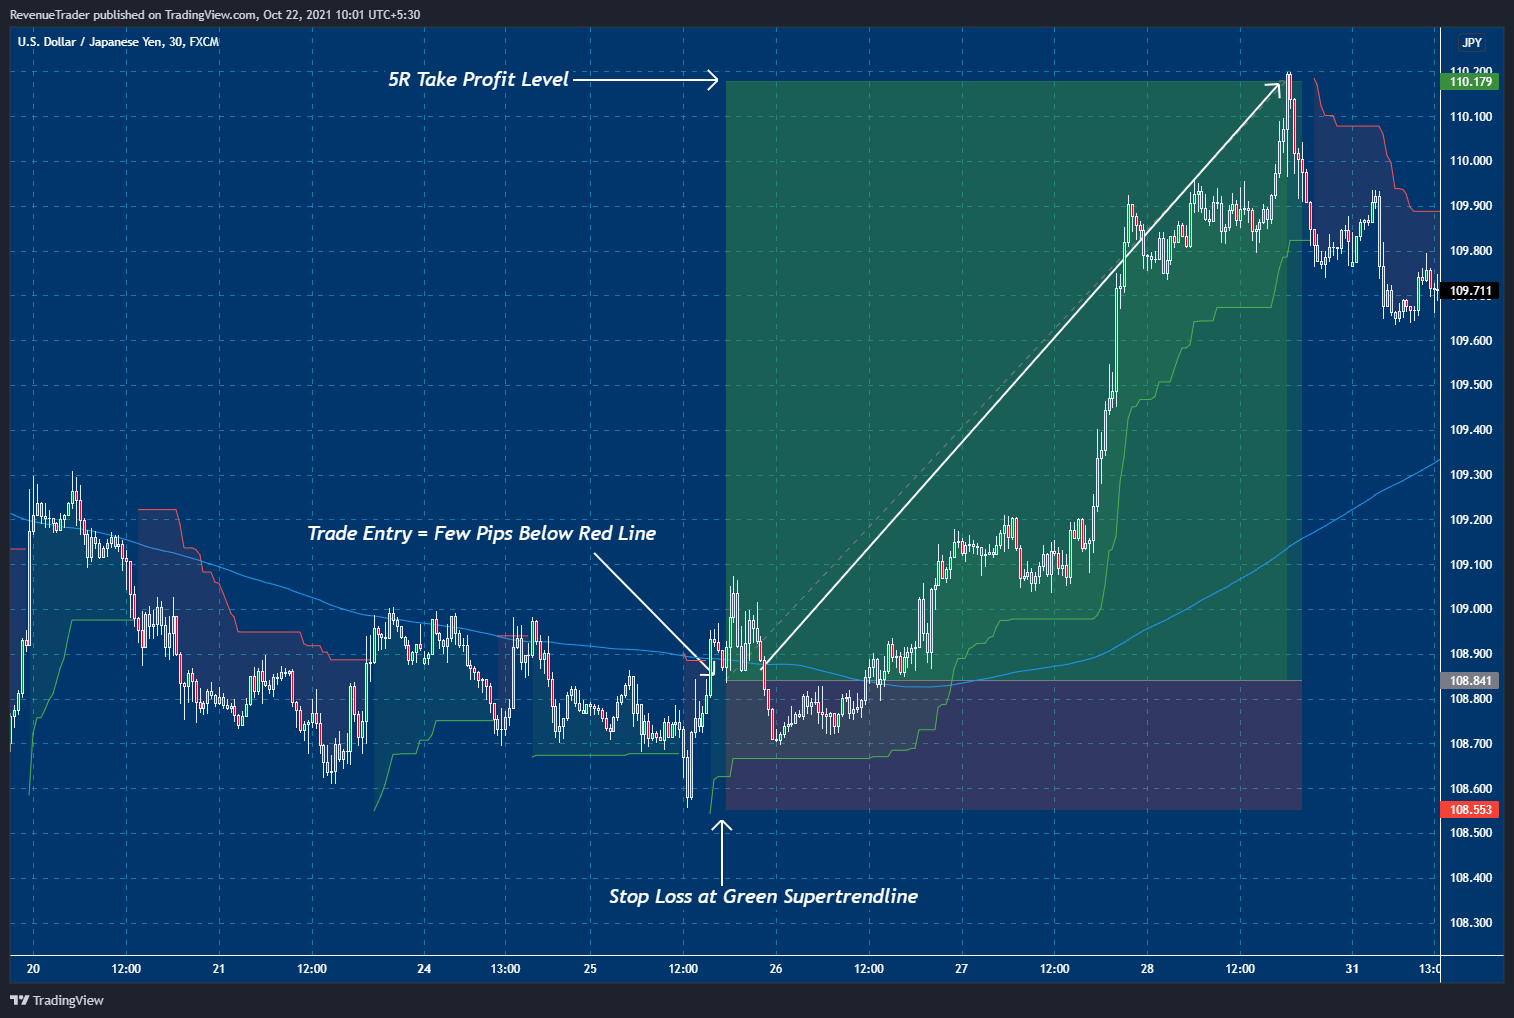
Finally how to manage the trade? Again simple. All you have to do is to trail your stop loss with the supertrend line. That is it.
Ok, This is how you’re going to execute and manage long trades.
With that let’s see how to place a trade when we have a downtrend.
Short Trade Entry
Assume that we have a downtrend which means the price is continuously trading below the 200 SMA. When the price is trading below the 200 SMA we only looking for short trade signals.
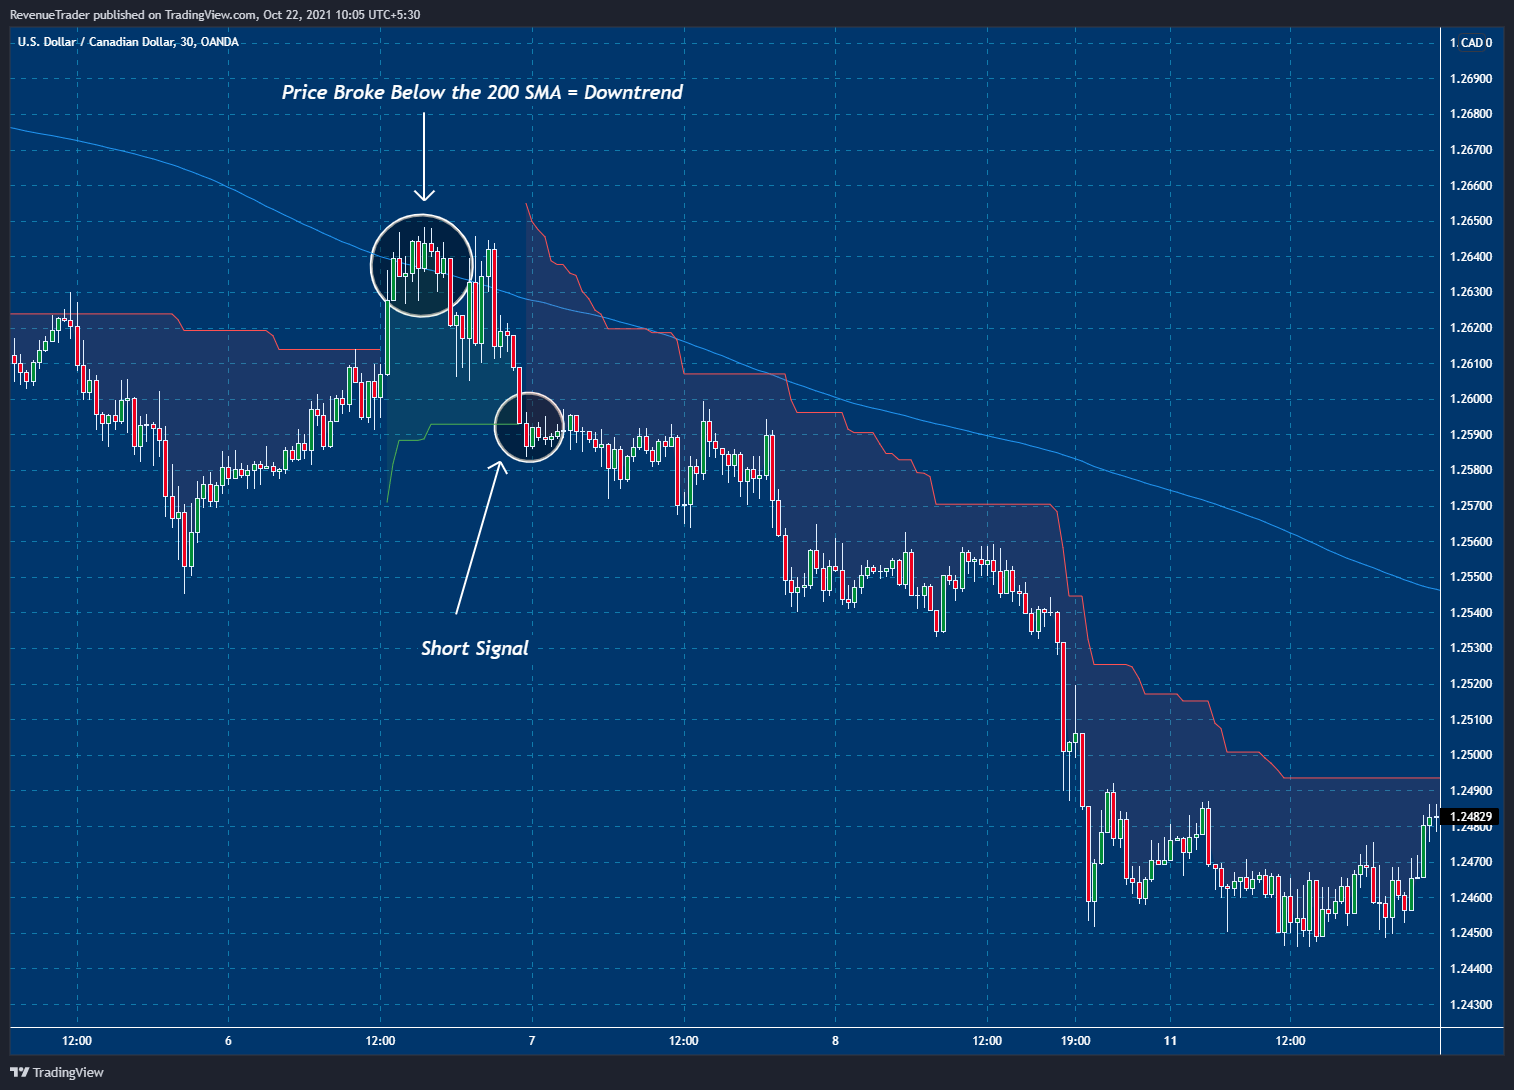
According to the above chart, you can see that the price break below the 200 SMA indicates a downtrend. Now have a look at the yellow circle, on there, the price break below the green supertrend and closed below signalling a short trade entry.
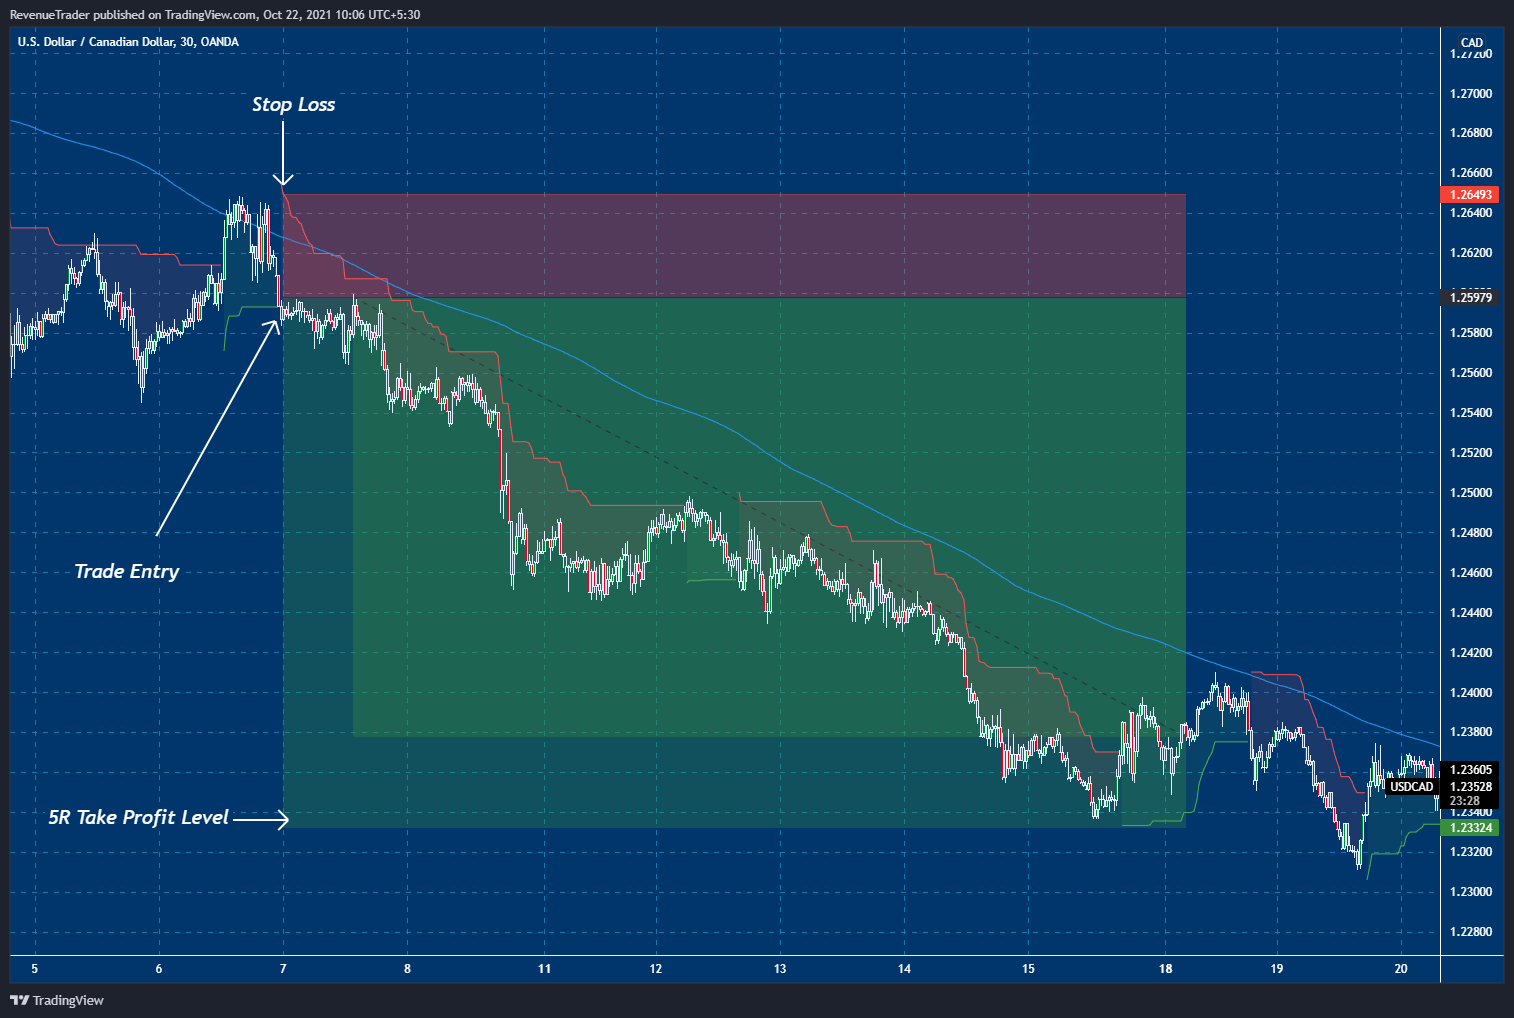
Just like the previous long trade, we can place a sell trade a few pips above the green supertrend line and we can place the stop-loss right at the red supertrend line.
Have a look at the chart below to understand how we placed the trade.
Okay, now you know how to place long and short trades and also to understand how to manage them effectively.
With that let’s see how 200 SMA help us to avoid unnecessarily losing trades.
Now, what are the benefits of combining the suptrend indicator with 200 SMA?
To understand that, have a look at the chart below,
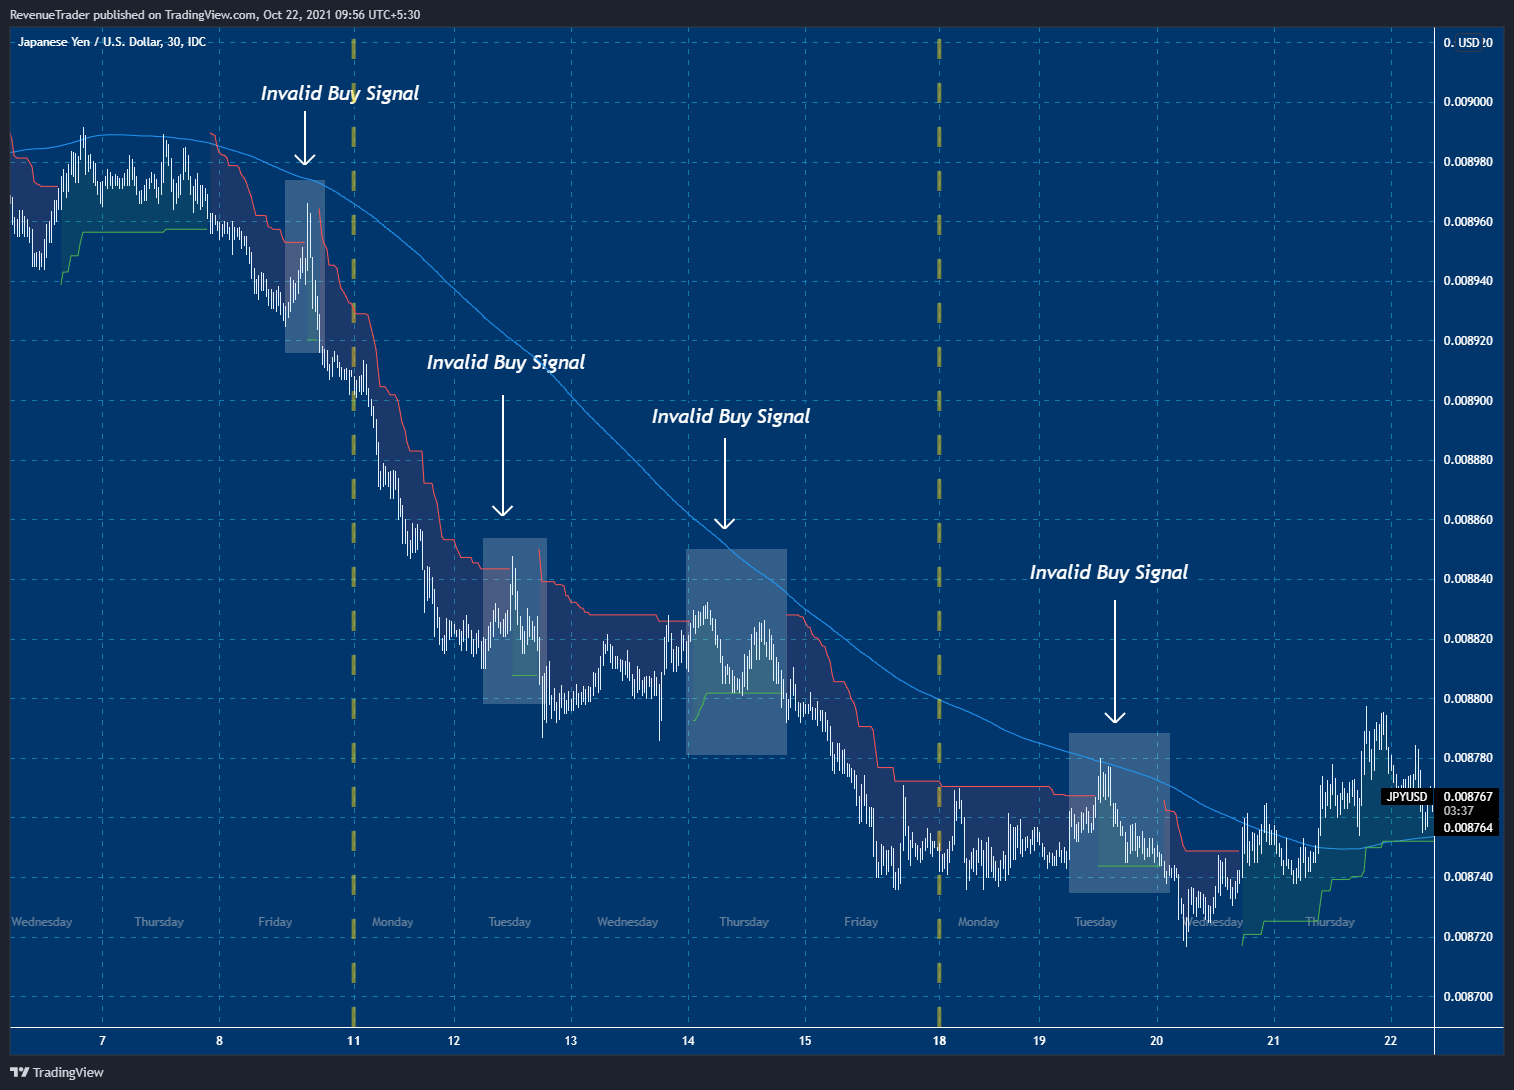
Now according to the above chart, you can see that the supertrend indicator alone generates both buy and sell signals in a strong downtrend, right?
Also, all the buy signals are invalid and false trading signals.
Since we are trading in the direction of the general trend (In this case price is trading below the 200 SMA indicating a downtrend) we are only interested in sell opportunities and as you guys can see all the sell signals are profitable.
This is the power of combining the Supertrend indicator with 200 SMA.
I hope you got the idea here.
So far so good, right?
But there is one problem though?
The Market is trending only 30% of the time, Then…
What Will Happen When the Market is Ranging?
Simple, we will end up in a drawdown and drawdown is a stage that every trader went through in his/her trading career at some point.
Since we are trailing the stop loss with the supertrend indicator, most of the time if the trade goes against our direction, we will end up with a small bunch of losing trades.
That is ok since we have massively profitable trades. One trade is enough to wipe out all the losing trades. So keep your emotions under control when you are trading through ranging markets.
Finally, I hope you found value in this trading strategy, if so, help us by sharing this article with your friend.
Related Articles – A Complete Guild to Risk Reward Ratio & R-Multiple in Forex Trading
Learn How to trade reversals – Reversal Trading: The Definitive Guide


