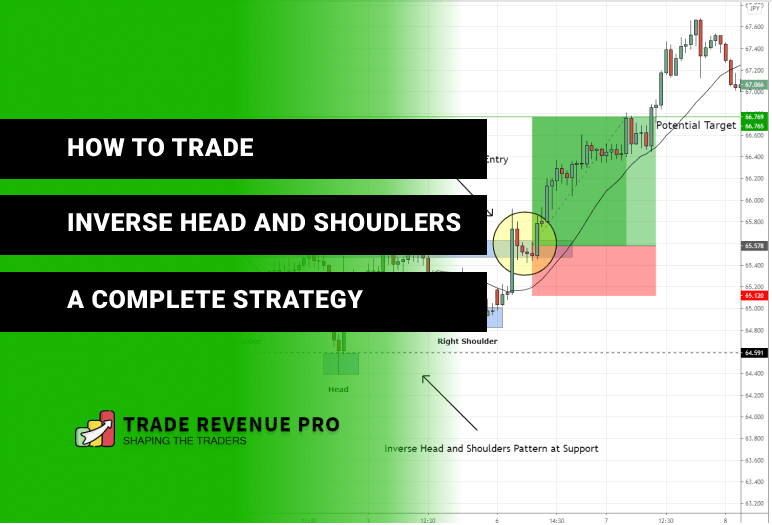
This is the Complete and Proven Trading Strategy to trade Inverse Head and Shoulders pattern in the Forex market.
In this new comprehensive trading article, you’ll learn,
- How to Read and Get Clues Behind the Inverse Head and Shoulders Pattern
- What Does Inverse Head and Shoulders Pattern Mean
- How to Find Higher Probability Trading Opportunities with this chart pattern
- How to Trade Trend Reversals with trade examples
Also at the end of this article, You’ll learn how to place higher probability trades like this one.
Let’s get started.
What is Inverse Head and Shoulders Pattern?
This is the opposite of the head and shoulders pattern. Inverse head and shoulders pattern indicating the reversals of downtrends. The inverse head and shoulders pattern consists of three troughs (while head and shoulders have three peaks) with the middle trough being the lowest.
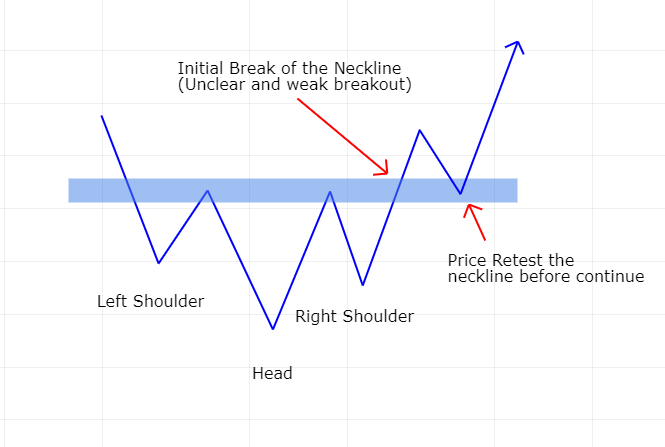
The sketch below illustrates how the inverse head and shoulders pattern looks like.
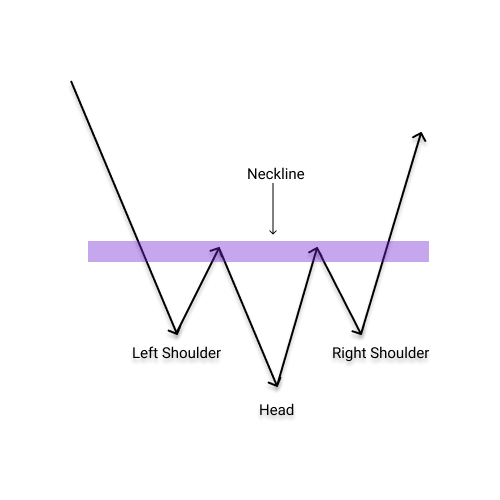
Normally two outside trough are called left shoulder and right shoulder and the middle one is called as the head which is the lowest of trough point in the inverse head and shoulders pattern and at last, there is a neckline which is used to confirm the validity of the pattern.
Have a look at the inverse head and shoulders pattern in a real chart below,

Since inverse head and shoulders pattern has reversal characteristic, It always starts with a bearish trend and then after the occurrence of the inverse head and shoulders pattern, traders must wait for a break above the neckline because this is what confirms the validity of the pattern.
The opposite of this pattern is the head and shoulders. We wrote an in-depth article about the head and shoulders pattern including a reversal trading strategy.
With these identification rules of this pattern in mind let’s see why inverse head and shoulders pattern occur.
Hidden Clues Behind the Inverse Head and Shoulders Pattern
As you already know, the inverse head and shoulders pattern occurs after a downtrend and if you spot this pattern on a downtrend you should prepare for a reversal.
But why?
Because, Unlike the other chart patterns, the occurrence of the inverse head and shoulders pattern is significant.
Have look at the chart below.
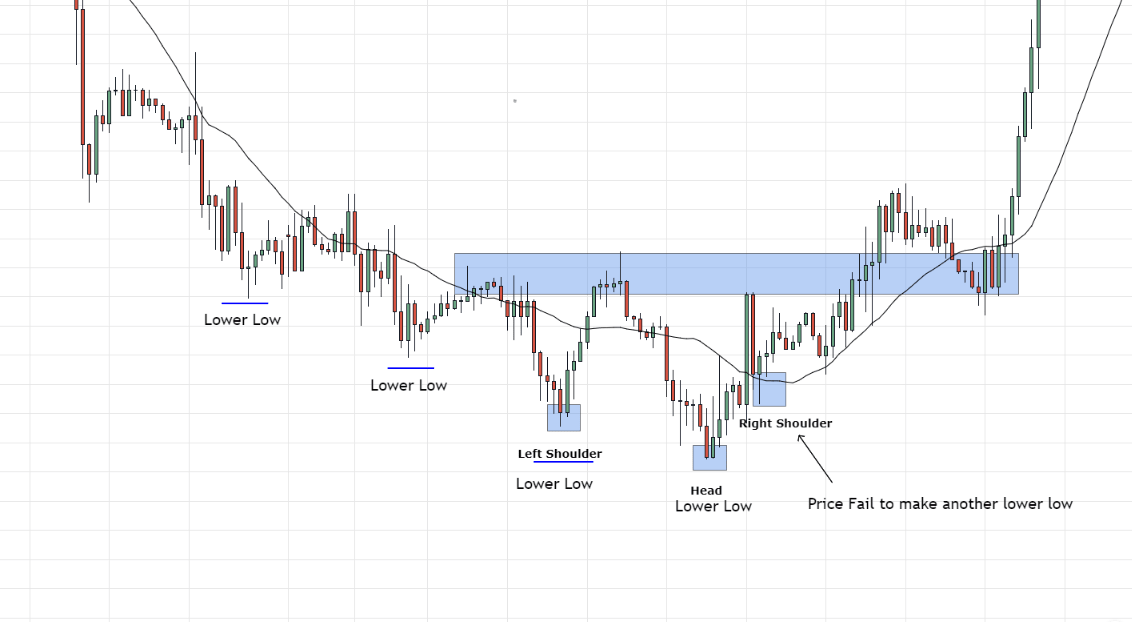
Observe the above chart carefully. On the left side of the chart. You can see that it is a clear downtrend. Each time the price has made new lows. But after the head instead of making new lows, the price action begins forming a higher low, resulting in an inverse head and shoulder pattern.
This kind of price behaviour indicates a lack of selling pressure in the downtrend, and we should monitor such scenarios as reversal traders.
Now you know how to interpret the insightful information carried by the inverse head and shoulders pattern.
So why this chart pattern is occurring and what’s so unique about this pattern that turns trending markets into reversals?
Answer – It is not the inverse head and shoulder pattern which turn the trending markets into reversals. It is the transaction happening between buyers and sellers. The chart pattern is just an outcome of that process.
Just like the inverse head and shoulders pattern, every chart pattern out there carried insightful information about the behaviours of buyers and sellers. The way you interpret and execute this information is what defines how profitable you can trade with chart patterns?
With that let’s see how to pick trend reversals more accurately with inverse head and shoulders pattern.
Inverse Head and Shoulders Pattern Strategy – A Highly Profitable Reversal Trading Strategy
In forex trading, many traders come across with lots of charts patterns like double top and bottom, triangle patterns, wedge pattern and the inverse head and shoulder pattern that we talked soo far.
These patterns can be identified easily in second. However, trading these patterns are not that easy.
The common problem among the new forex traders is that they trade these pattern whenever they occurred and forget about key trading factors like the trading location, market conditions and trading confluences.
This is same for the inverse head and shoulders pattern as well. If trade this pattern whenever it occurs and in NO MAN’S LANDS, you’ll surely be ended up blaming the pattern.
To avoid such scenarios, you must combine inverse head and shoulders pattern with other trading confluences to increase the probability of the pattern. This principle applies to all other chart patterns out there.
Since inverse head and shoulders pattern has reversal characteristic, we must use this pattern to trade trend reversals.
But First…
What is a Trend Reversal?
A trend reversal is a change in the price direction of any currency pair.
A trend reversal can occur to the upside or downside. On uptrend, a reversal would be to the downside. on a downtrend, a trend reversal would be to the upside.
Now keep in mind that, inverse head and shoulder is not a trading strategy, It is an entry technique of complete trading strategy.
With that in mind let’s see how to trade trend reversals using this pattern.
Trade Entry Technique #1 – Break and Retest of the Neckline
We can use two trade entry techniques to trade inverse head and shoulders. One is break and retest of the neckline which is a conservative way to enter a trade.
Simply put we wait for a break above the neckline and when price retests the broke neckline, we’ll place a long trade. Have a look at the sketch below.
Besides the conservative entry, the whole point of using inverse head and shoulders is to get a favourable risk to reward ratio.
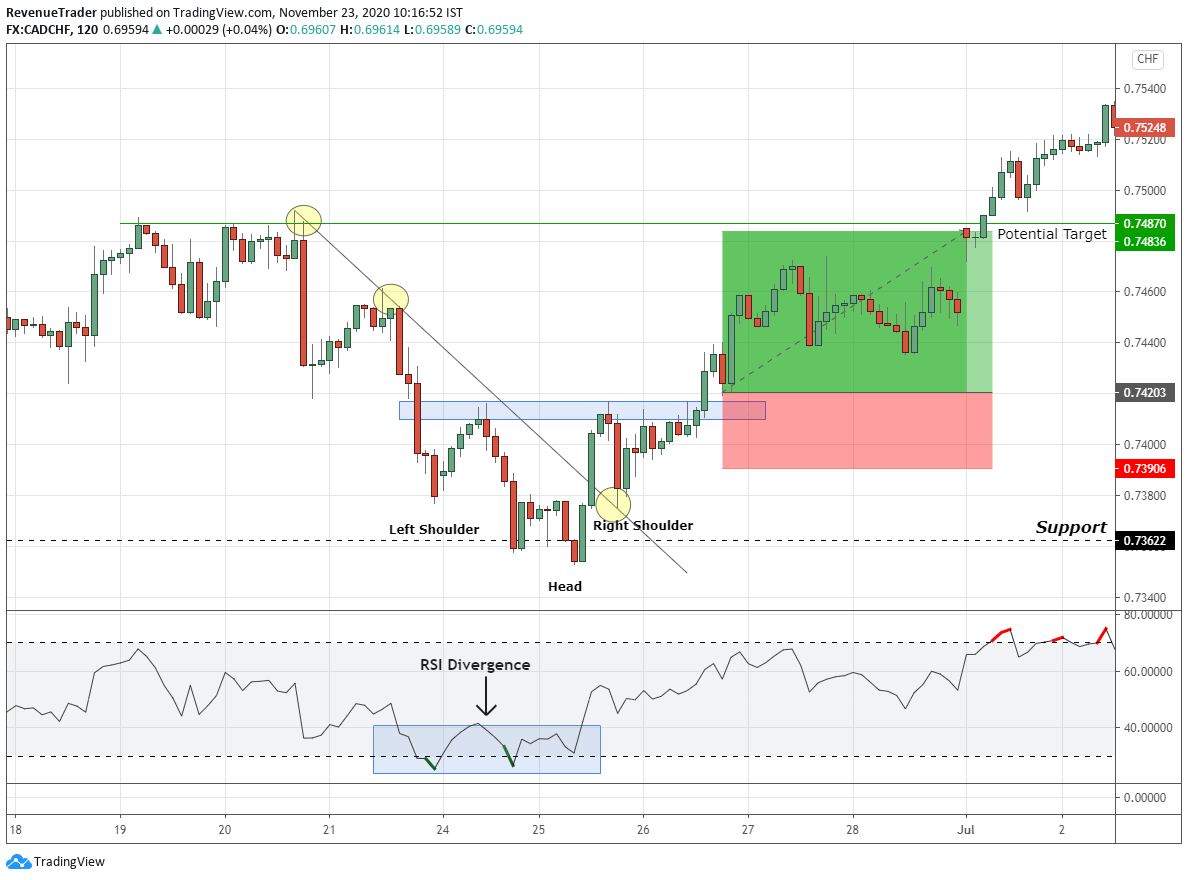
Next, let’s take a real forex chart and see how to use break and retest pattern. Have a look at the CHFJPY 1-Hour chart below.
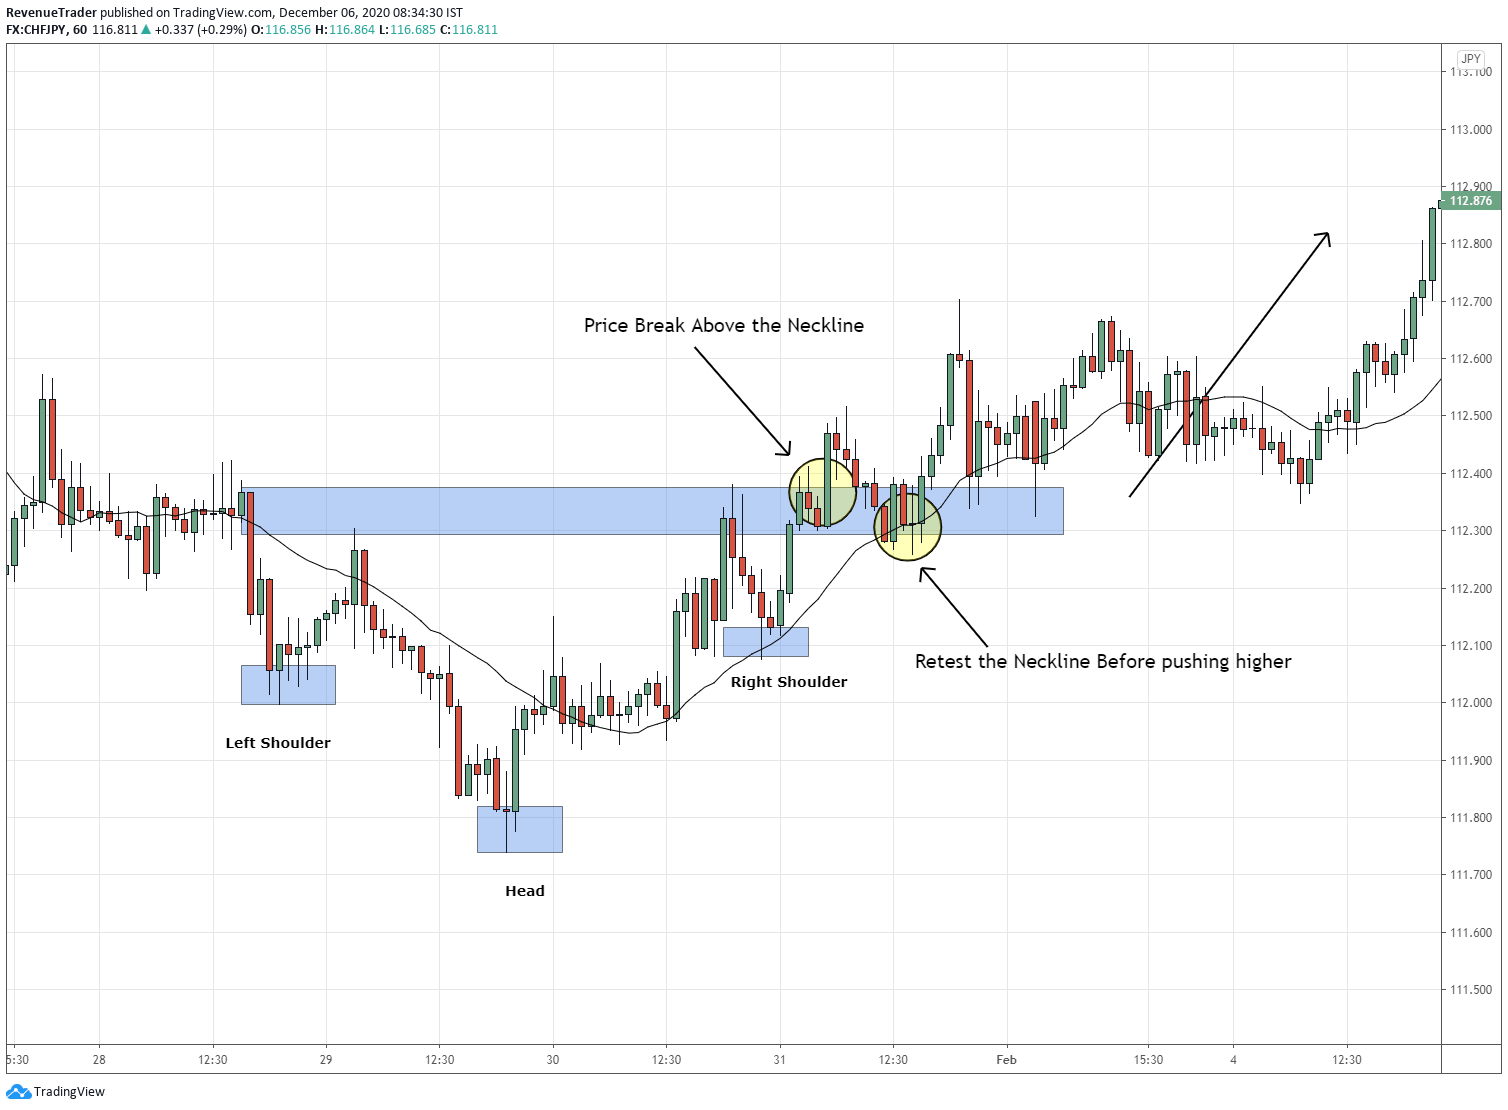
As discussed earlier, the presence of the inverse head and shoulder pattern suggests a lack of selling pressure and all of the sudden price break above the neckline, which confirms the validity of the pattern.
The next question is how are we going to get into the market? This is where the break and retest pattern comes in. We’ve already had a breakout, and after that price came to test the neckline again. This is where we’re going to have a long trade.
This way you can aim for higher Risk to Reward Ratio. This is a key advantage of this pattern.
I think you’ve got the idea here.
Next for the aggressive forex traders…
Trade Entry Technique #2 – Strong Break of the Neckline
As we already know, we only trade the inverse head and shoulders pattern after the break above the neckline. This helps us to confirm the validity of the pattern also this can be used as Entry Trigger as well.
When price break above the neckline with strong bullish momentum, It’s unnecessary to wait for a retest of the neckline because the momentum is in our favour, logical enough, right?
Okay, Let’s take an example. Have a look at the EURUSD 4-Hour chart below,
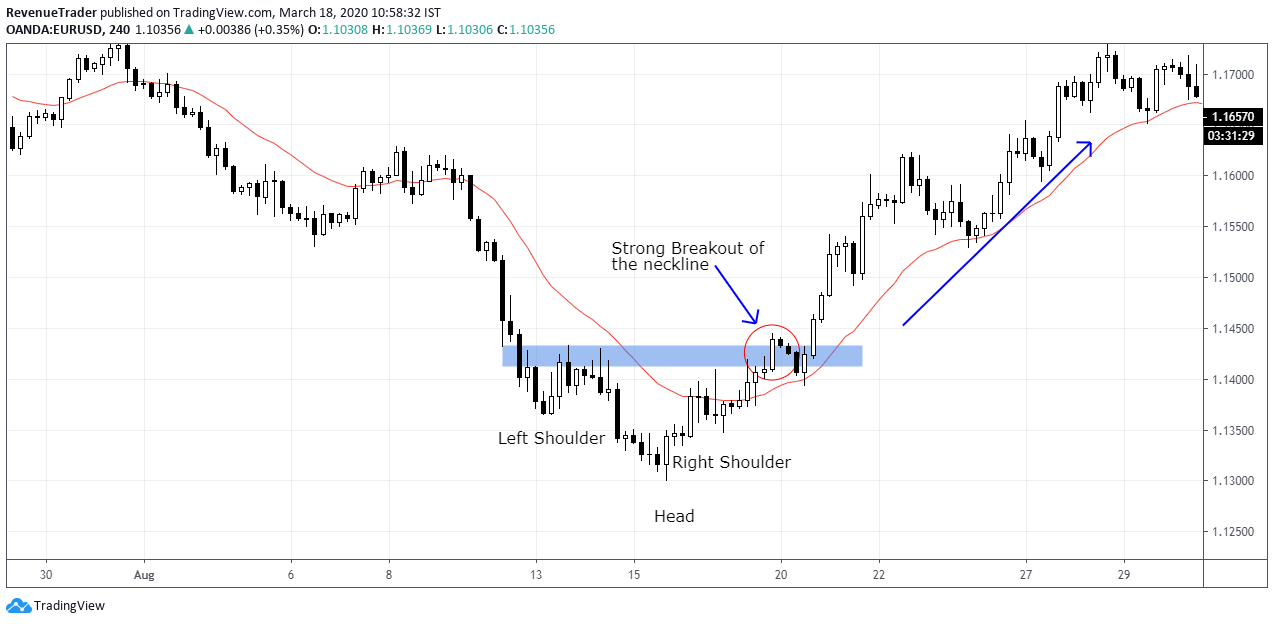
If you look left side, you can see that EURUSD was in a strong downtrend for a quite some times.
Then the occurrence of the inverse head and shoulders pattern indicate the lack of selling pressure.
Based on the above clues, we can expect a trend rotation here in EURUSD.
Now have a look at the strong break above the neckline. A breakout like this indicates the aggressiveness of buyers hence the wait for a retest here won’t be necessary.
Placing a buy order here would be a good idea to catch the bullish trend pretty earlier.
Okay, now you know how to combine these two trade entry techniques with the inverse head and shoulders pattern and when to use it.
- Break and Retest of the Neckline, and
- A Strong Break of the Neckline
Next, Let’s see how to place the stop-loss.
Stop Loss Placement
Good traders are risk managers. They about the risk before thinking about the reward. Also, the way you manage risk is what defines the success of anyone to become profitable forex traders.
So, how to place stop loss when trading the inverse head and shoulders pattern.
There are two ways to do this…
Use Structure Level to Place Stop Loss
Structure levels are the levels on every forex chart that draws the most attention. Which means that, these levels frequently lead to price bounces, thus, placing a stop-loss order of a few pips below is a good idea to minimize your downside of the trading account.
Now have a look at the CHFJPY 1-Hour chart below,
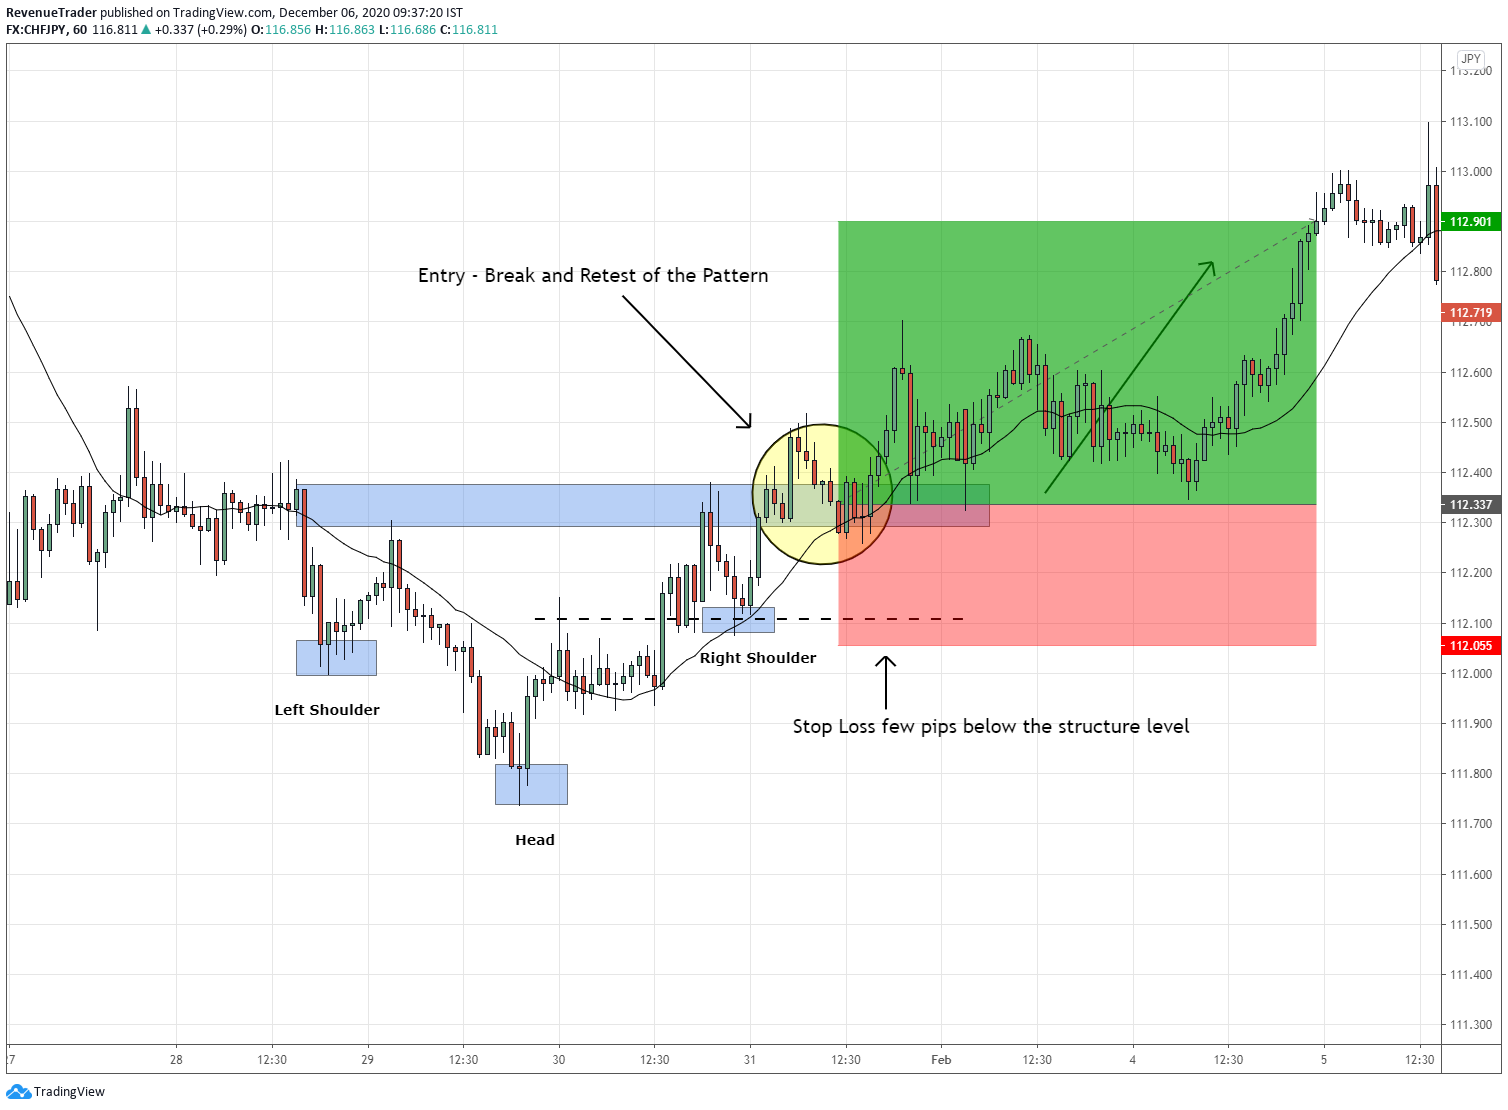
According to the above chart, you can see that occurrence of inverse head and shoulders indicate the lack of selling momentum and upon the breakout of the neckline we entered a long position.
Next, How and where we will place stop-loss? For that we need a structure level, right?
In this case, the mose recent and clear structure level is the right shoulder, therefore placing stop-loss order few pips below the right shoulder is the most secure option here. (Observer the above chart).
See, upon identification of the structure level, it is a matter of placing the stop-loss order. That’s it.
But what if you can’t find a clear structure level?
This is where 21-EMA comes in to play
Use 21-Period Moving Average to Place Stop Loss
Have a look at the USDCAD 4-Hour chart below,
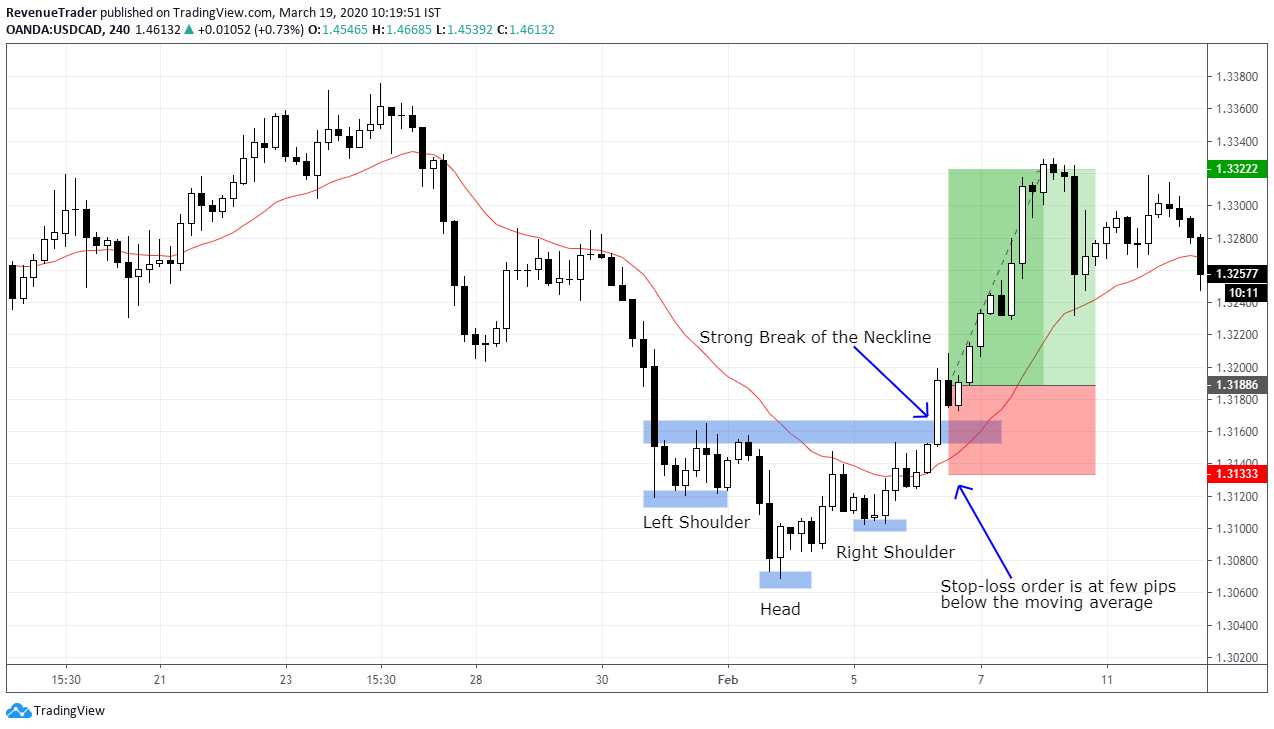
Have a look at the drastic break of the neckline. The breakout candle is very powerful and closed too far away from the neckline.
If we look at this situation in risk to reward ratio context, putting a stop-loss order at the structural level (as we did before) isn’t a smart idea, right?
Therefore, we should go for the second alternative that uses the moving average to place stop loss.
According to the above chart, we put a stop-loss order of a few pips below the 21-period exponential moving average (see above chart) which is a safe place to cut our losses. Not only that, using this method, we have also been able to obtain a favorable risk-to-reward ratio.
See placing a stop-loss order is not a big deal.
But finding a secure market level to place your stop while minding risk to reward ratio is the hardest part and this is the part you need get right in order to get a good profitable trade.
Now timing the trade entry and placing the stop loss is done.
Next…
How to Place Take Profit for Inverse Head and Shoulders Pattern
Placing a take-profit is easy, you just have to place take profit at a recent structure level. But there is a one objective you need to achieve here.
When placing take-profit order you should have at least 1 to 2 Risk : Reward Ratio.
Have a look at the trade example below.
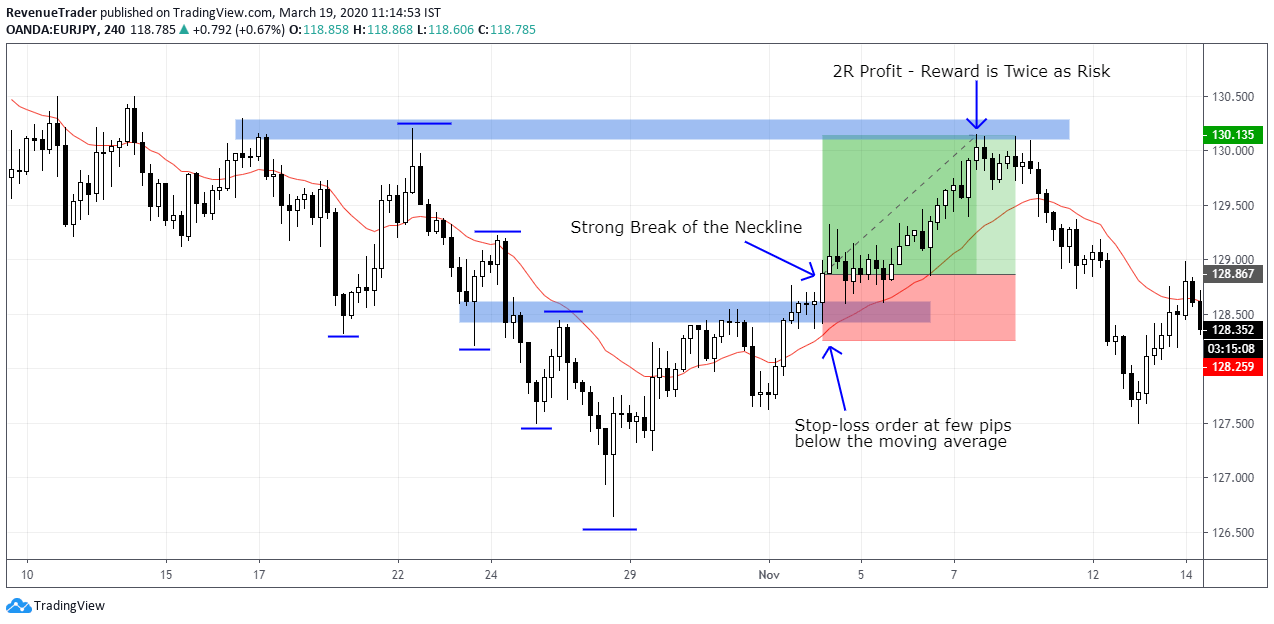
According to the above chart, the pattern of the inverse head and shoulder is formed at the end of the downtrend.
Much like the previous cases, we are entering the market as the price breaks sharply above the neckline and places a stop-loss of a few pips below the 21-EMA.
We use the recent level of structure for profit-taking. In this case, the resistance level (the horizontal blue zone shown in the chart) which has been tested twice before.
Not only that by closing our trade on that resistance level we were able to get a favourable risk to reward ratio for our trade as well.
Learn more about Risk to Reward Ratio.
Okay, up to this point you know how to trade inverse head and shoulders pattern including – trade entry, Stoploss and take profit.
Next, let’s see how to filter out higher probability inverse head and shoulders pattern, so that you’ll end up taking only profitable trades.
How to Filter Out Higher Probabilty Inverse Head and Shoulders Pattern
The primary object we need to focus on finding trading idea is to eliminates the bad trade ideas and focus on only quality trade opportunities.
The same thing apply to the inverse head and shoulders pattern as well. If we trade every inverse head and shoulders pattern that occur, we will surely ended up blowing our trading account.
Instead we need to focus on high probability trade setups, right?
So, to find higher probability trade setups, we need to…
Combine Inverse Head and Shoulders Pattern with Support and Resistance Level
Support and resistance are the levels (Or zones) on the chart where price trend is more likely to reverse or pause.
Which mean we can expect a strong comeback of the buyers at the support level.
Conversely, we can expect a selling pressure at a resistance level.
Now, if we can combine Support level with a inverse head and shoulders pattern, we can easily get high quality trade setup, right?
Have a look at the example below.
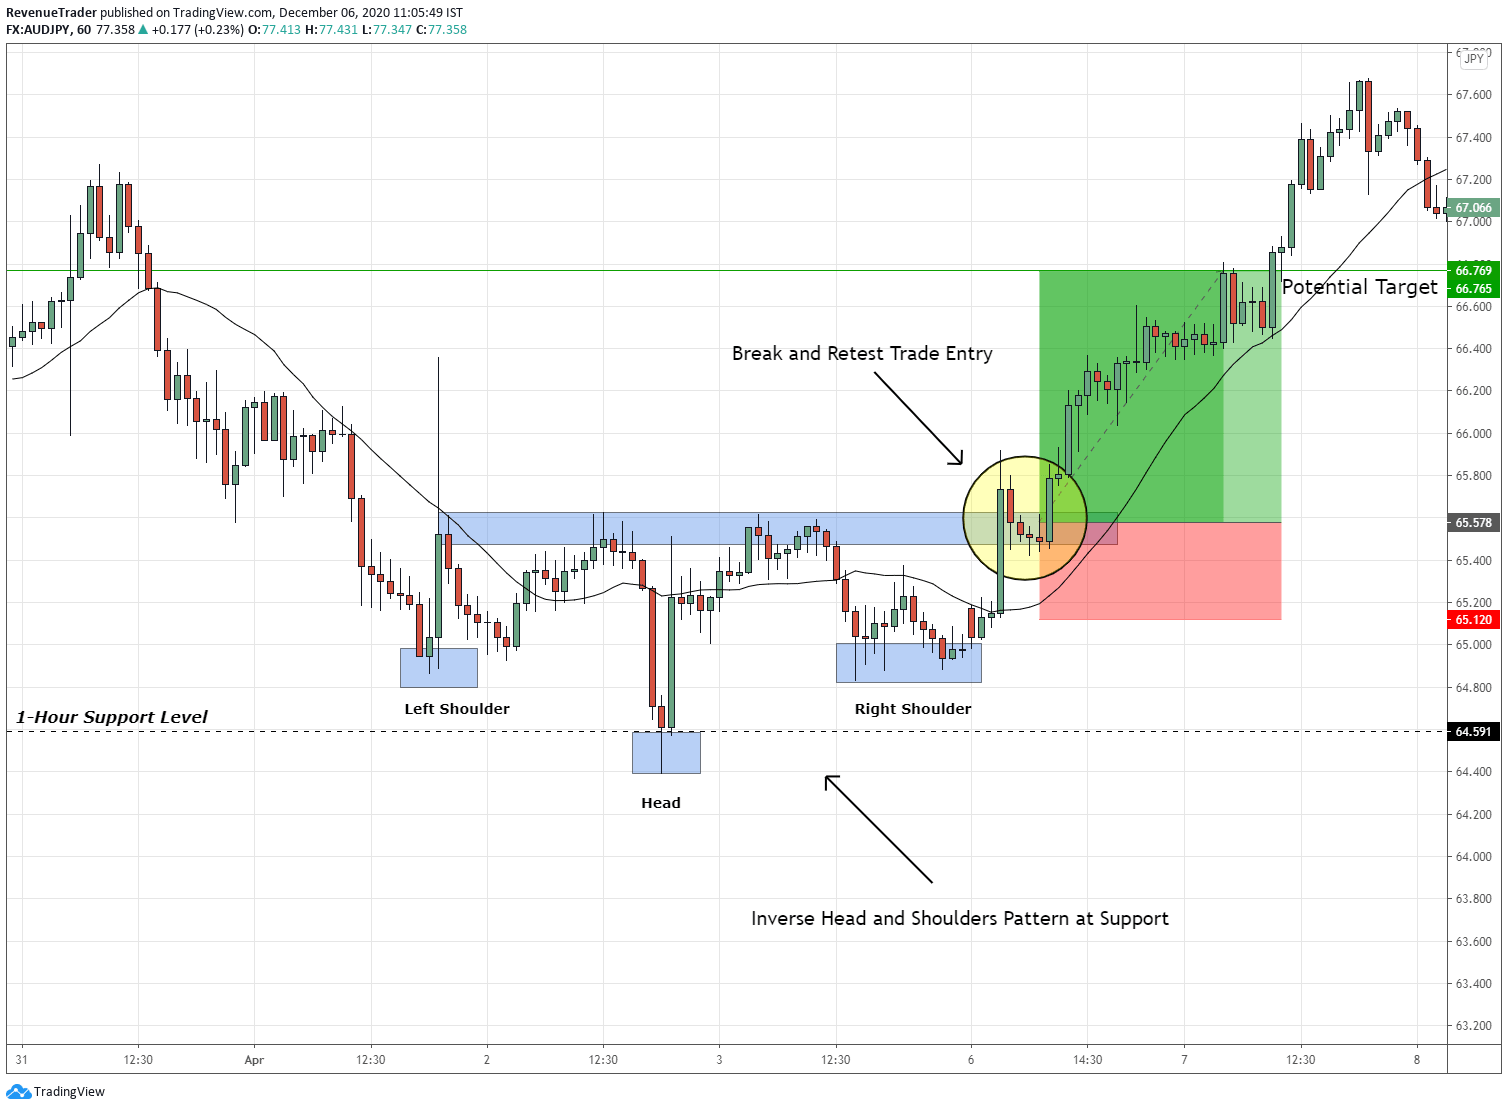
According to the above chart, you can see that the inverse head and shoulders pattern nicely aligned with the 1-Hour support level which increase probability level of the trade. As usual we execute the trade using break and retest pattern.
Another way to increase the quality of this pattern is to combine it with the Round Numbers. Round numbers are type support and resistance on your chart. Go ahead and try if it is true or not.
Finally
Just like this trading strategy or chart pattern, a wide variety of trading strategies can be found on the internet.
But are you going to trade these tactics right away? If yes, then. You’re going to wreck your trading account for sure.
So what do you have to do?
Backtest it to check whether it’s going to work or not and also check whether or not the trading technique you’ve found on google suits your personality.
If a trading strategy works with someone else, that doesn’t mean it’s going to work for you too.
Trading is all about finding your trading edge around the market. So avoid moving from one technique to another. Focus on the approach you’re trading right now and find ways to strengthen it.
If you like the trading strategies we spoke about in this post, feel free to add these techniques to your trading plan.
If you want to learn more about Forex trading strategies and techniques head over to our Trading Blog.
We put an article about chart analysis every weekend. Find those in the Trade Idea section.
Finally, I hope you learned something valuable in this ultimate guide on how to trade double bottom pattern. If so, help us grow by sharing this article.
What do you think about this trading strategy? Let me know in the comment section.


