Relative Strength Index or RSI indicator is a popular trading indicator that comes default with every forex trading platforms.
RSI is a momentum oscillator that measures the strength and momentum of price movements.
RSI indicator is developed by a technical analyst named J. Welles Wilder and this trading indicator is an extremely popular momentum indicator that has been used by many forex traders around the globe.
In this article, we are going to talk about how to use RSI indicator in forex trading, additionally, we are going bust some myths about RSI indicator as well.
As a bonus, in the end, we are going to talk about a simple yet very profitable trading technique that helps me to catch trend reversals very accurately.
Not only that you can download the infographic version of this article in the end.
What is the RSI Indicator?
As said above, the RSI indicator measures the momentum and strength of price movements. By using measurements we can get trade decisions. Let’s see how to use RSI indicator in forex.
Here how the RSI indicator look in a forex chart.
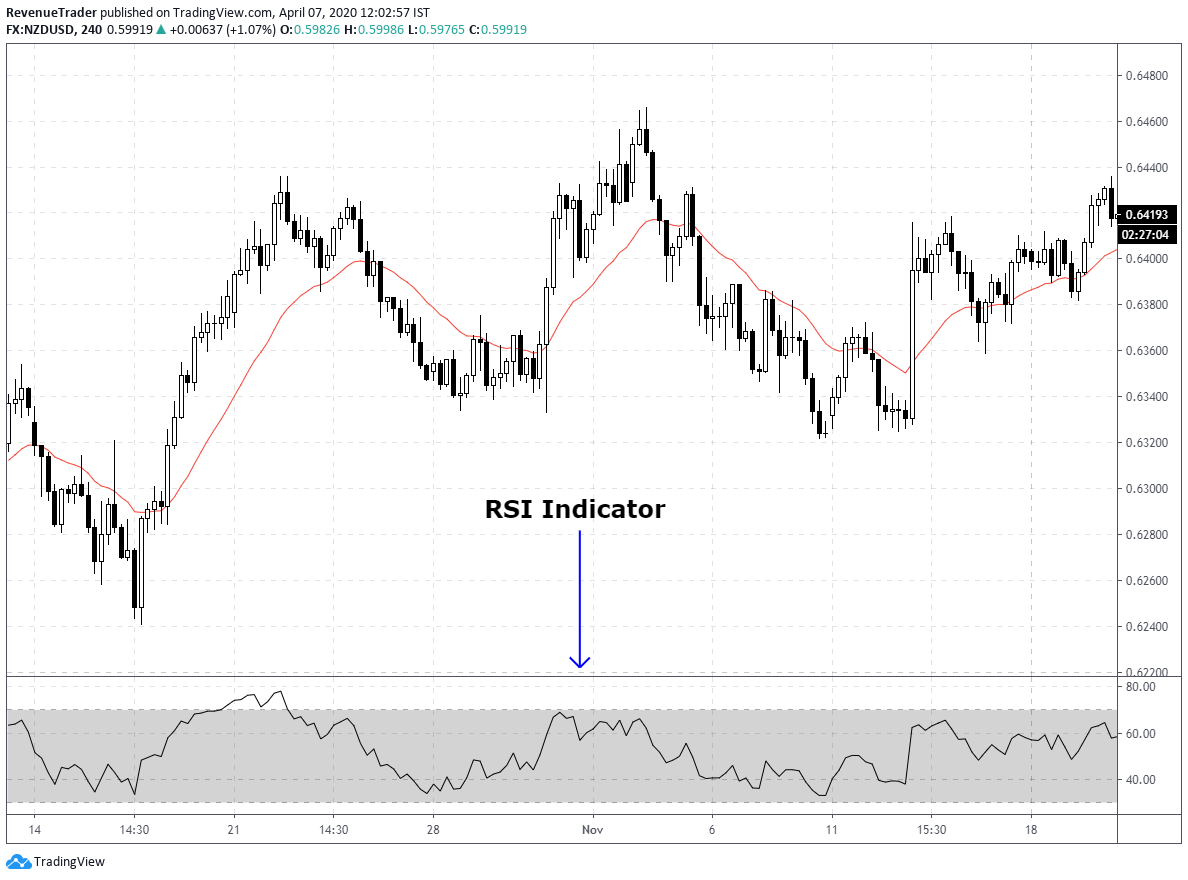
Now have a look at the sketch below.
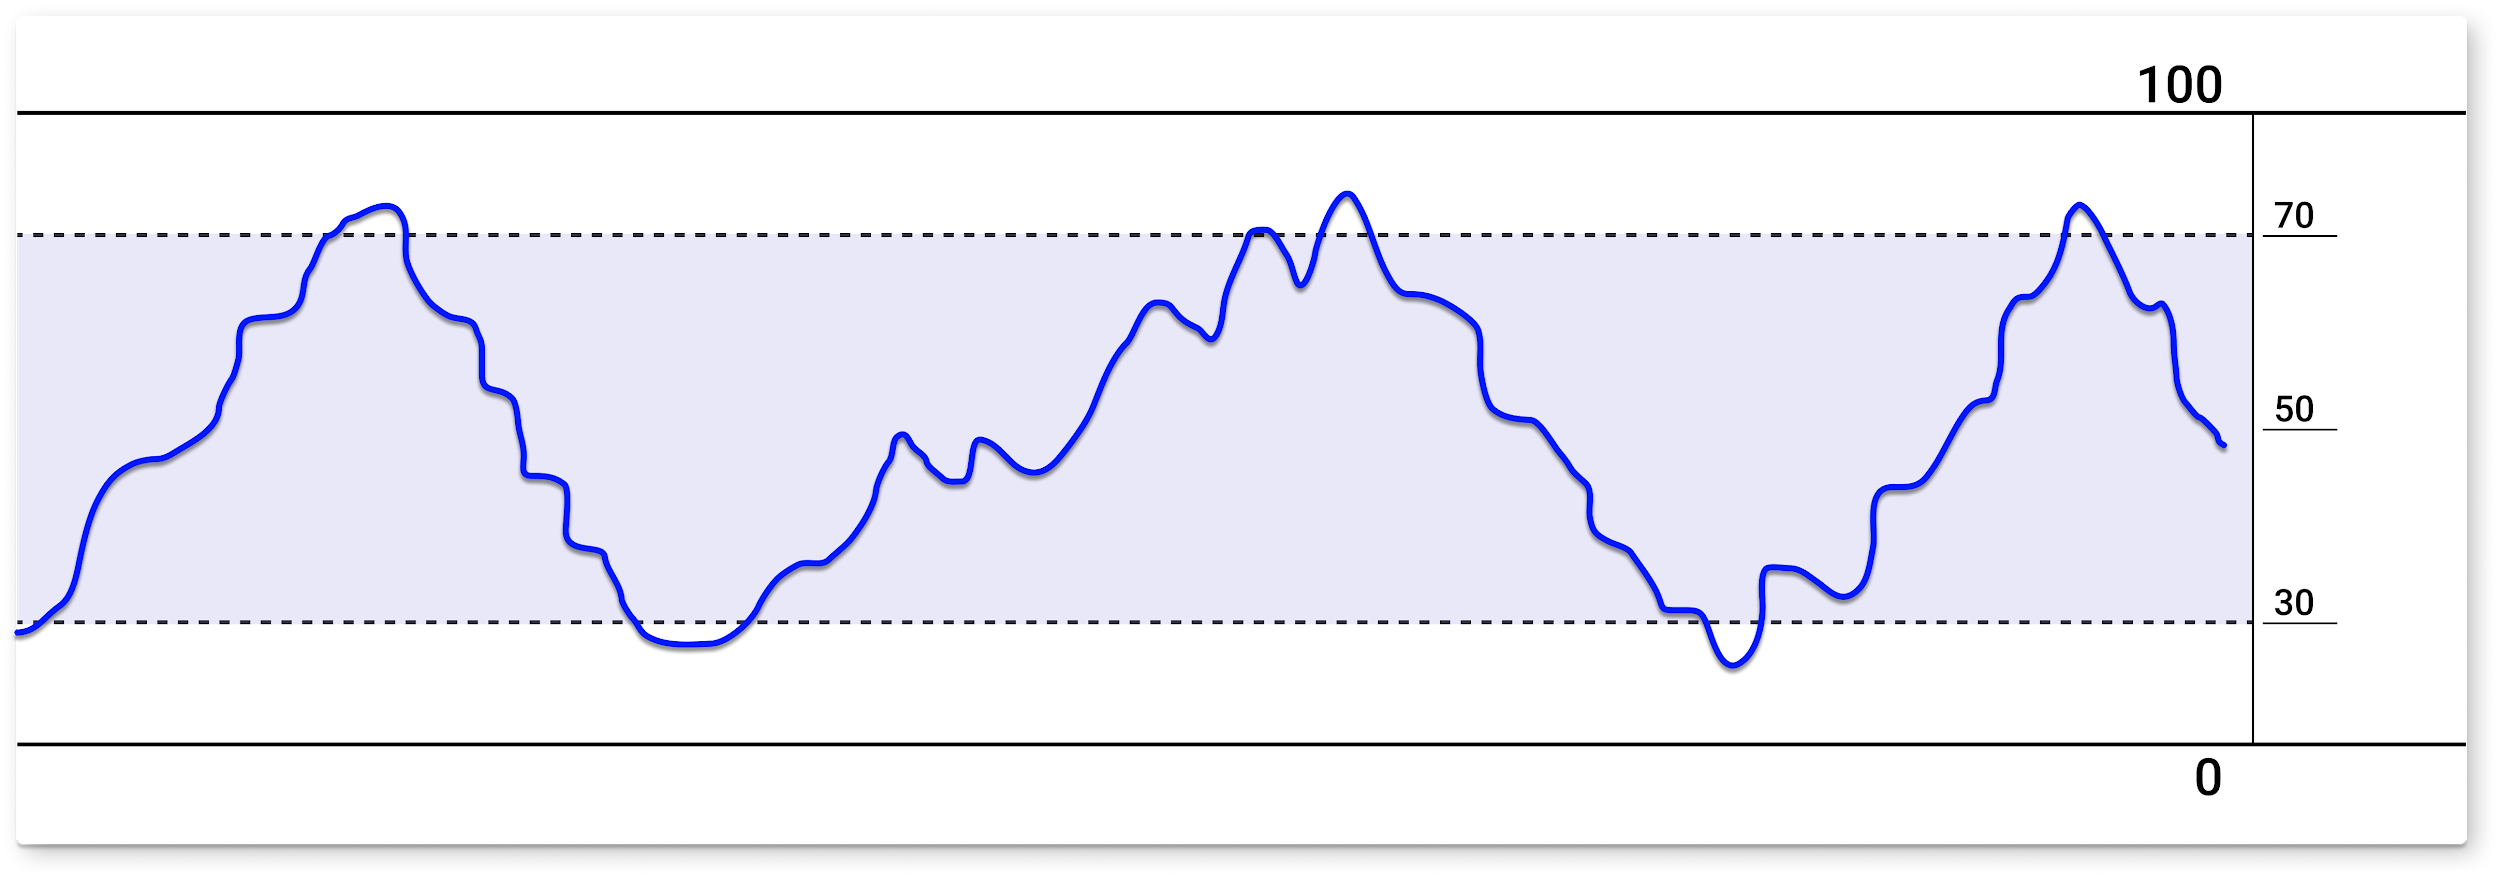
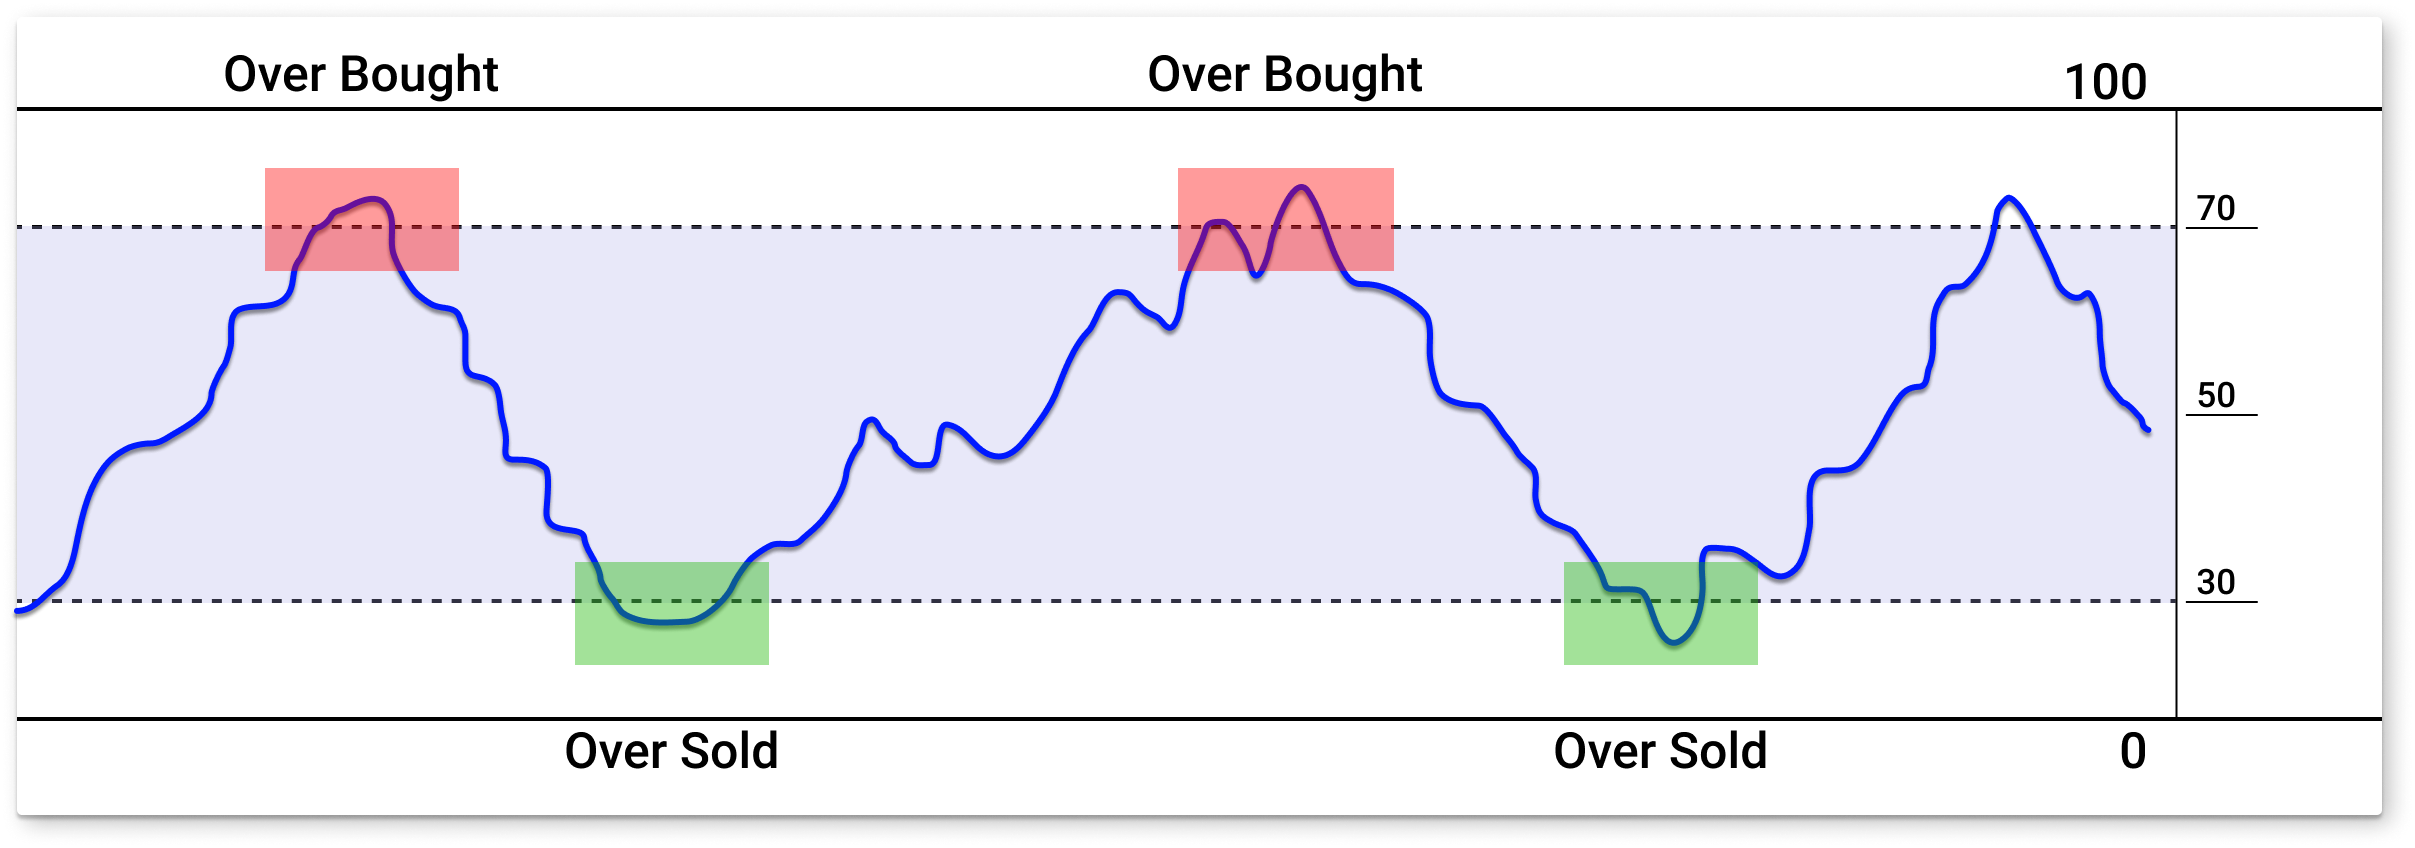
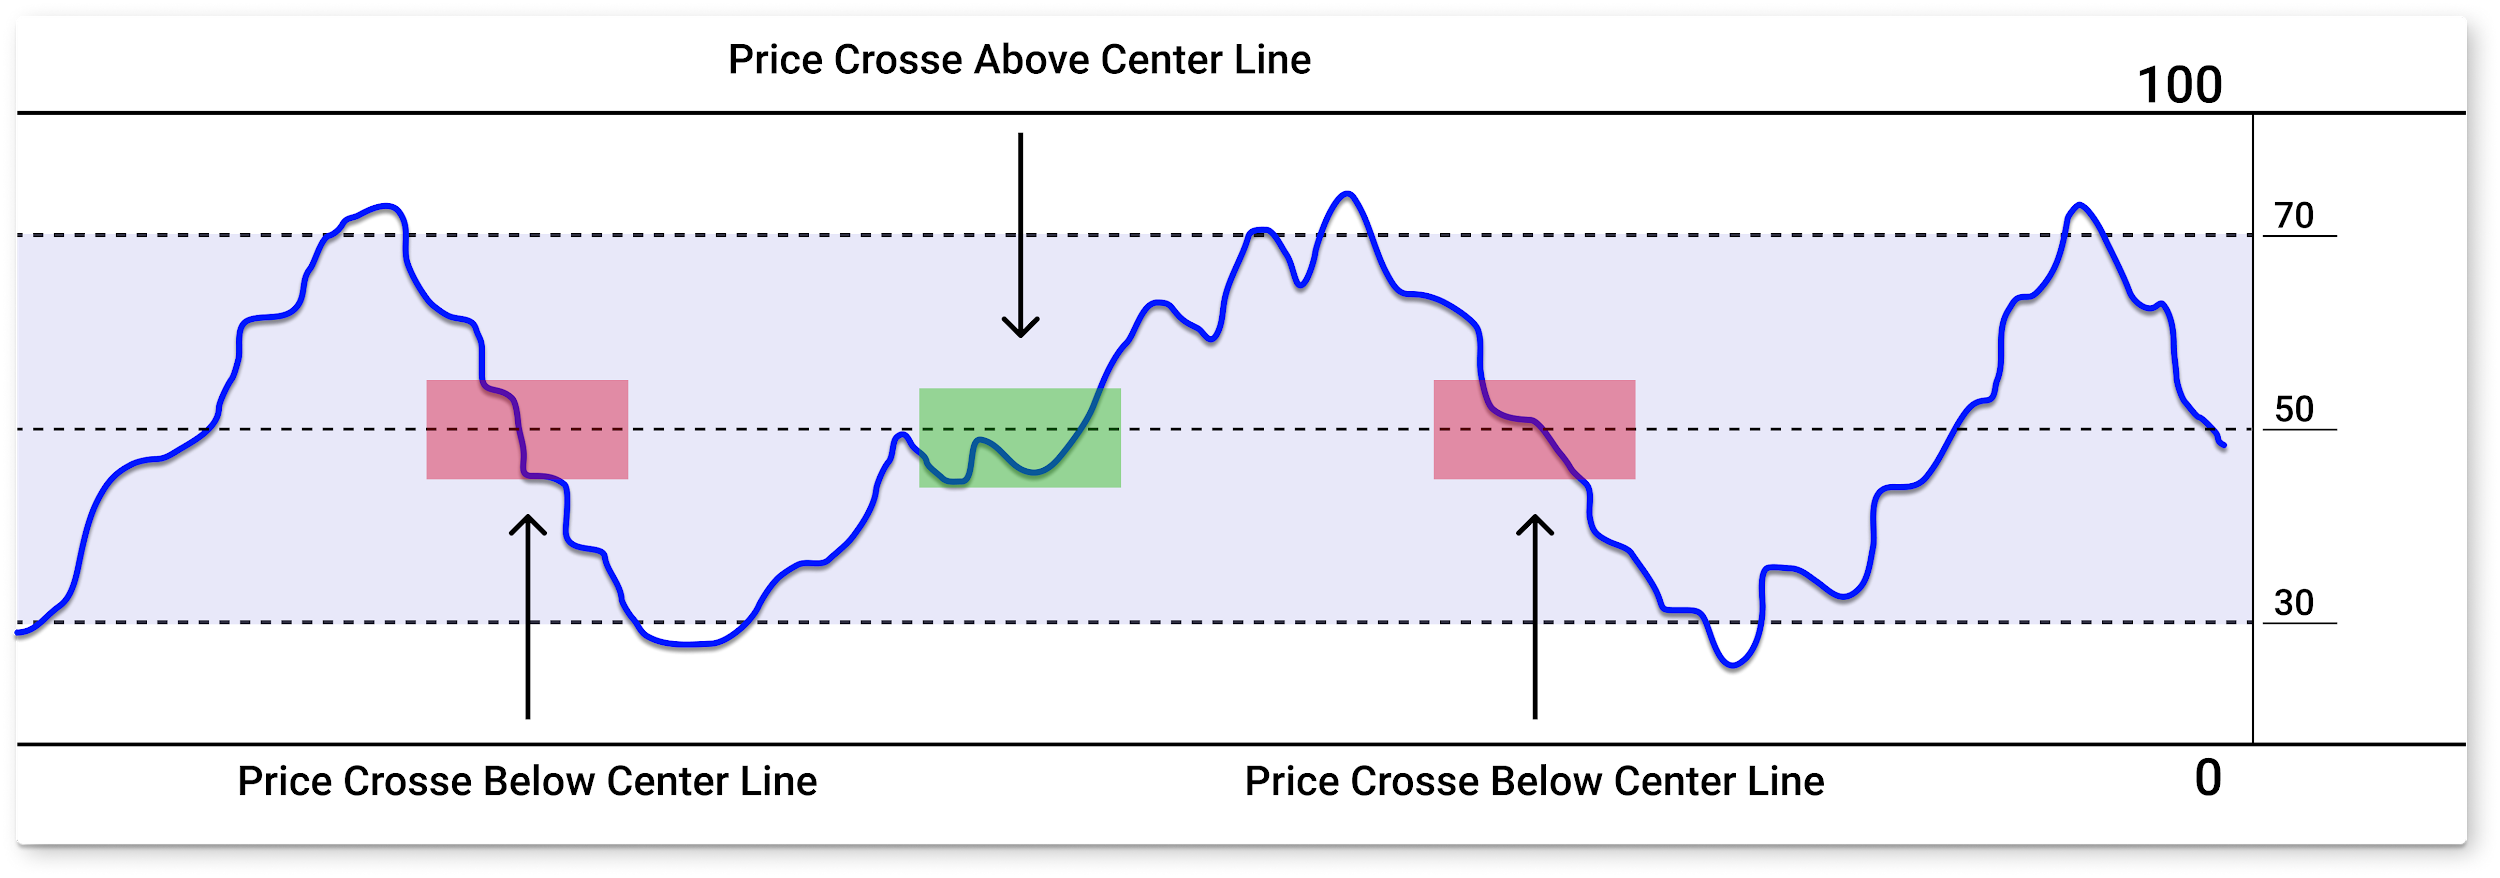
As the picture showed above, the RSI indicator oscillates between 0 and 100 and by default, RSI is considered overbought when it is above 70 and oversold when it is below 30.
Some traders use oversold as an indication of bullish price reversal and overbought as a bearish price reversal. have a look at the pictorial example below.
But keep in mind that RSI oversold and overbought trade signal work only on certain market conditions and in a strong trending market, this indicator tends to generate lots of fake signals. Will talk about this in the next topic.
Next, in addition to the overbought and oversold trading signal, traders use the RSI indicator to determine the trend.
If RSI crossed above the centerline (50), it indicates a bullish trend and if RSI crossed below the centerline (50), it indicates a bearish trend.
Finally, we have RSI divergence which is another trade signal that generates by this indicator which helps us determine the weaknesses of the trend.
So, What is the RSI Divergence?
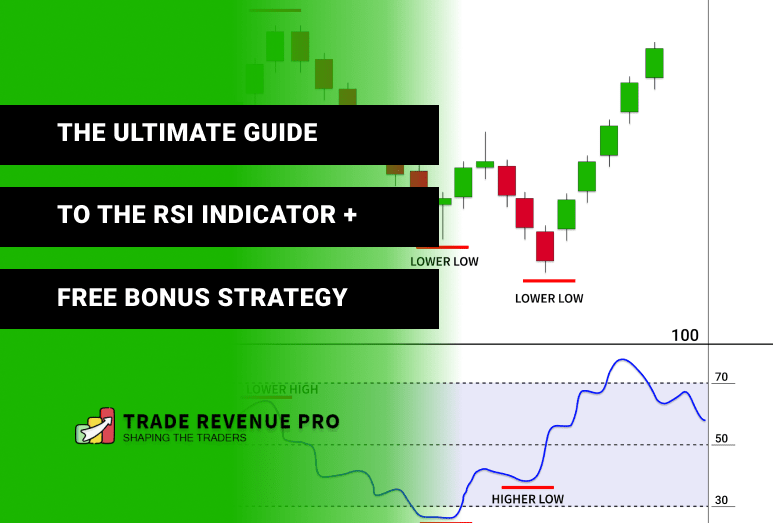
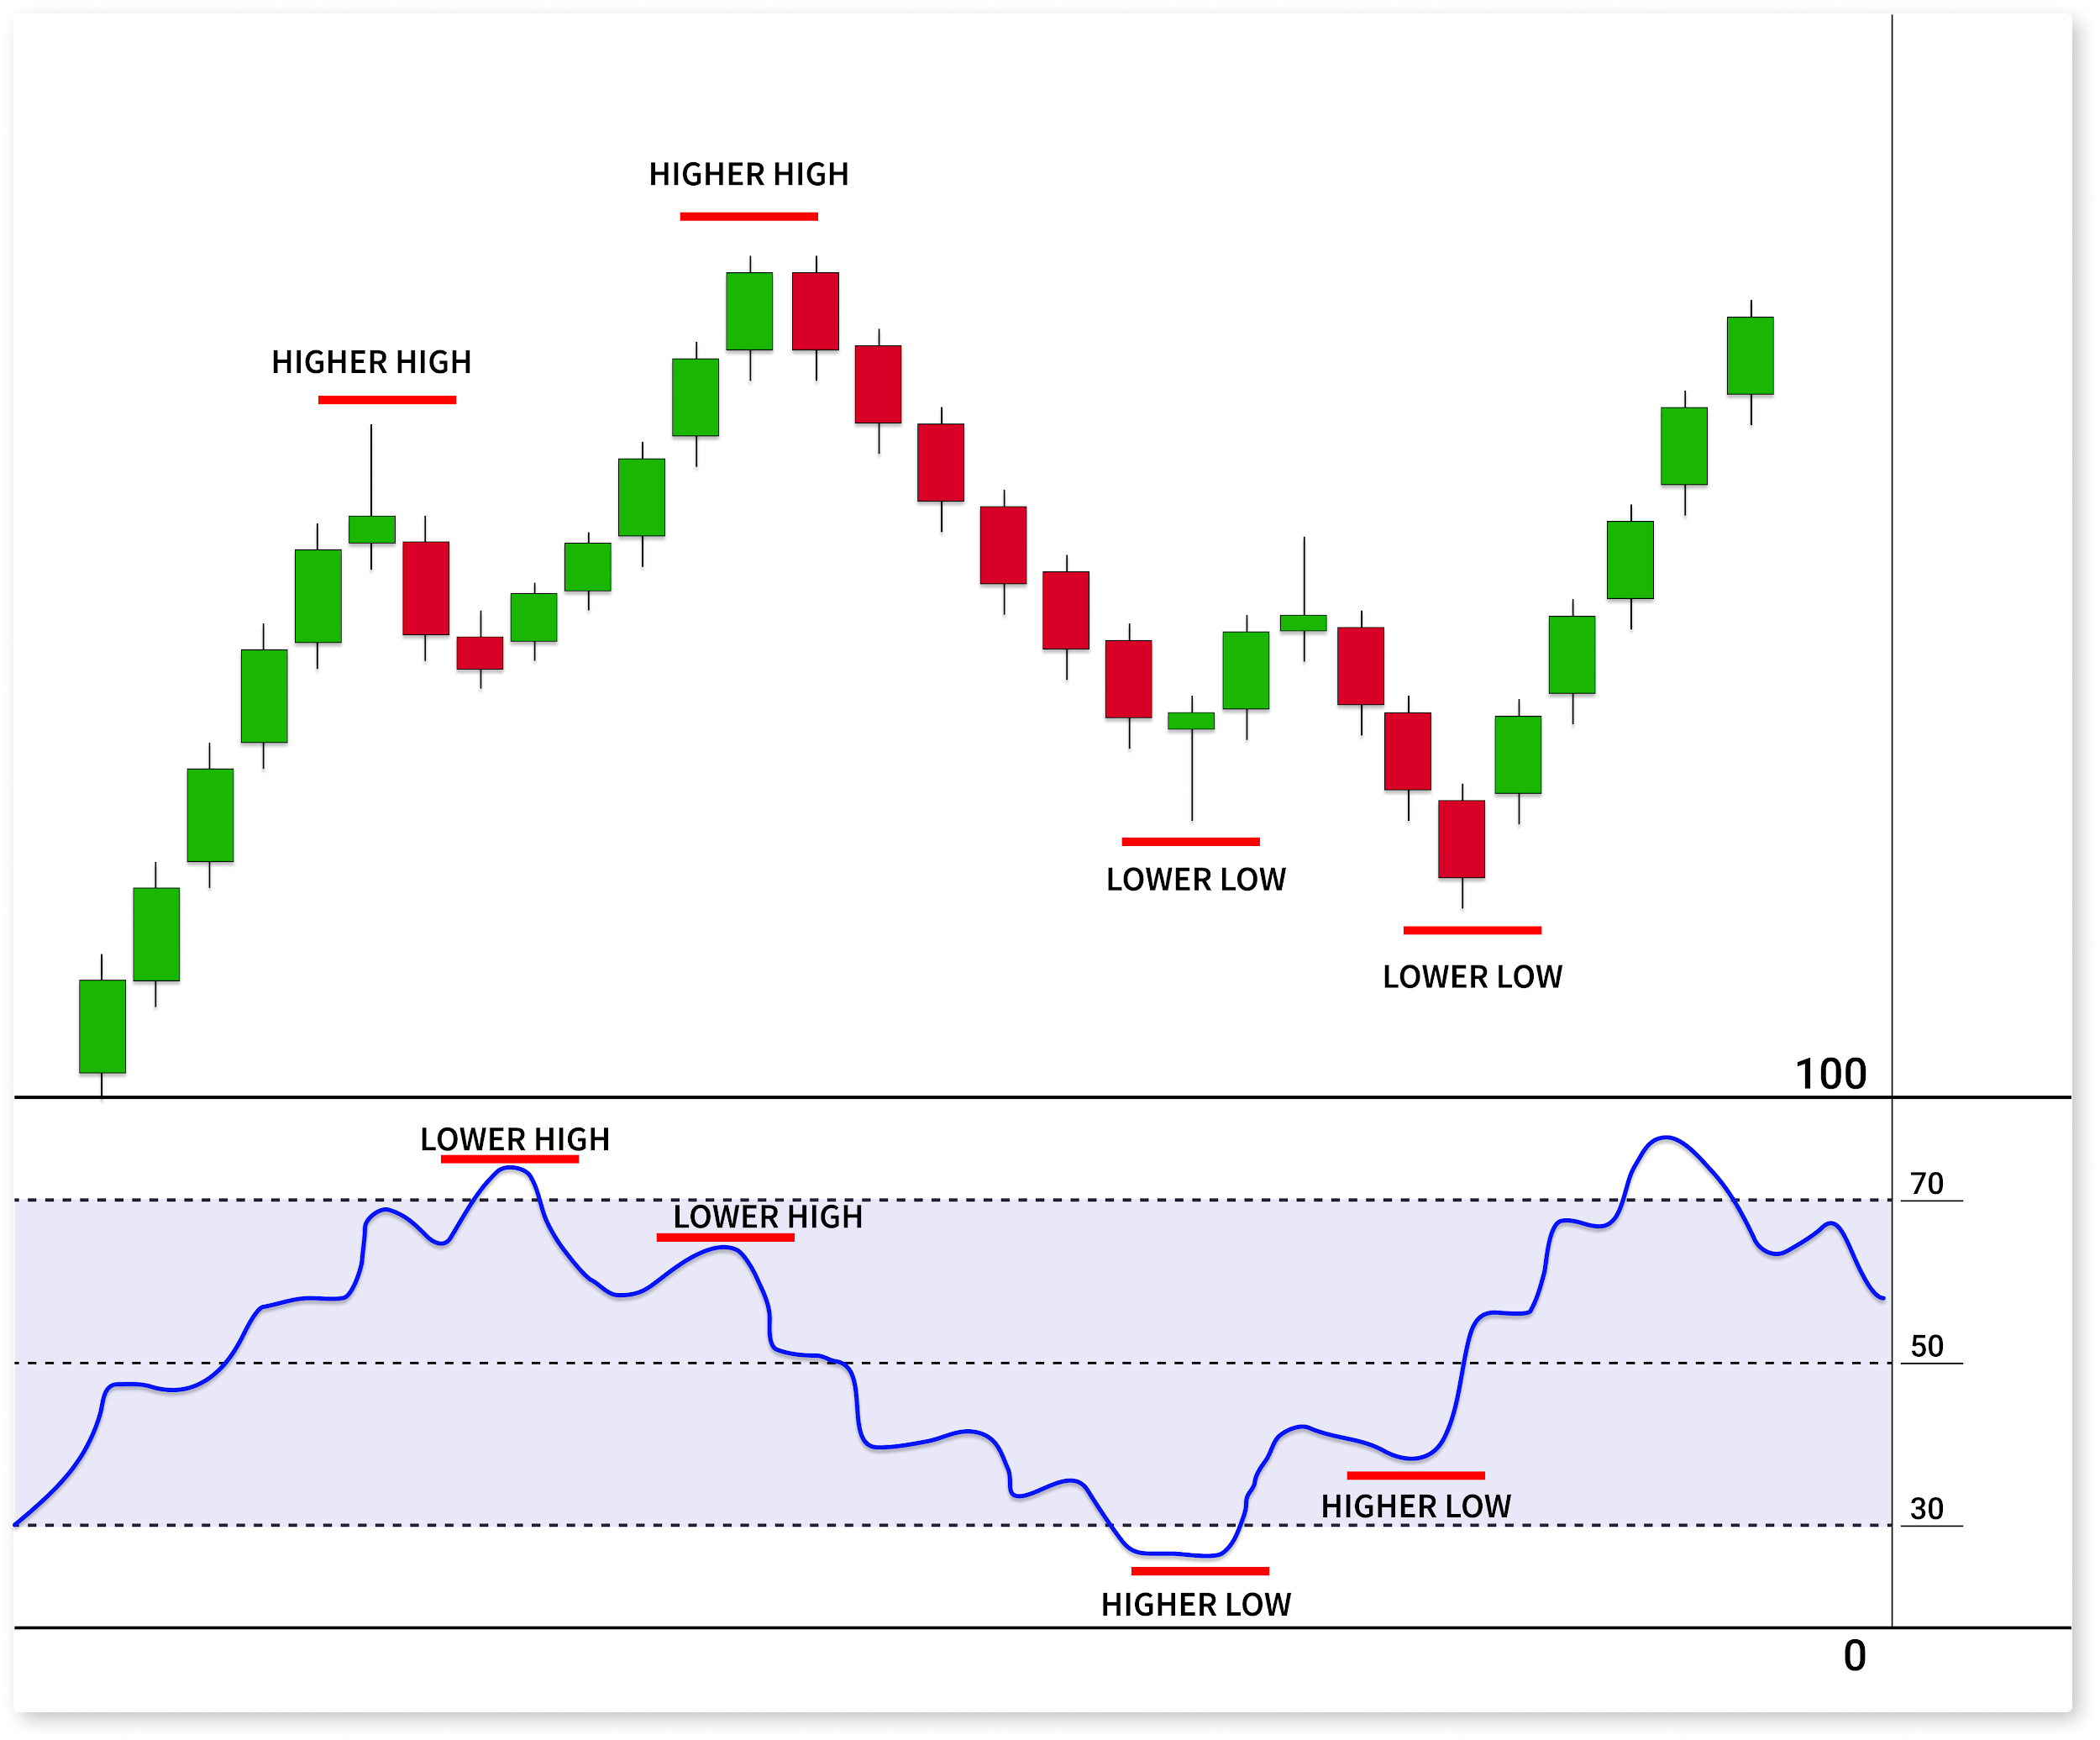
RSI Divergence forms when the price makes a higher high, but the RSI indicator makes a lower high in an uptrend market. In a bearish move, this happens oppositely, when the price makes lower lows and the RSI makes higher lows.
Personally, this is my favourite way of using the RSI indicator. RSI Divergence helps me to identify trend reversals very effectively.
Have a look at the sketch below that explain the basic concept of RSI divergence.
Okay, now you are familiar with fundamentals of this indicator, right?
But there is one question. How the RSI generate these trading signal? What is the magic formula behind it? Let’s talk about this.
Calculation Behind the RSI Indicator
RSI indicator does all the hard work for us, It generates overbought, oversold and divergence for us in an easy to interpret way.
Then why we care about the calculation of the RSI indicator?
To be honest, there is no correct answer to this question, But it is always better to know the ins and outs of the indicator that we used to trade, right?
Let’s assume that we are using 14 periods RSI. now let’s see how this calculation work.
Have a look at the RSI formula below.
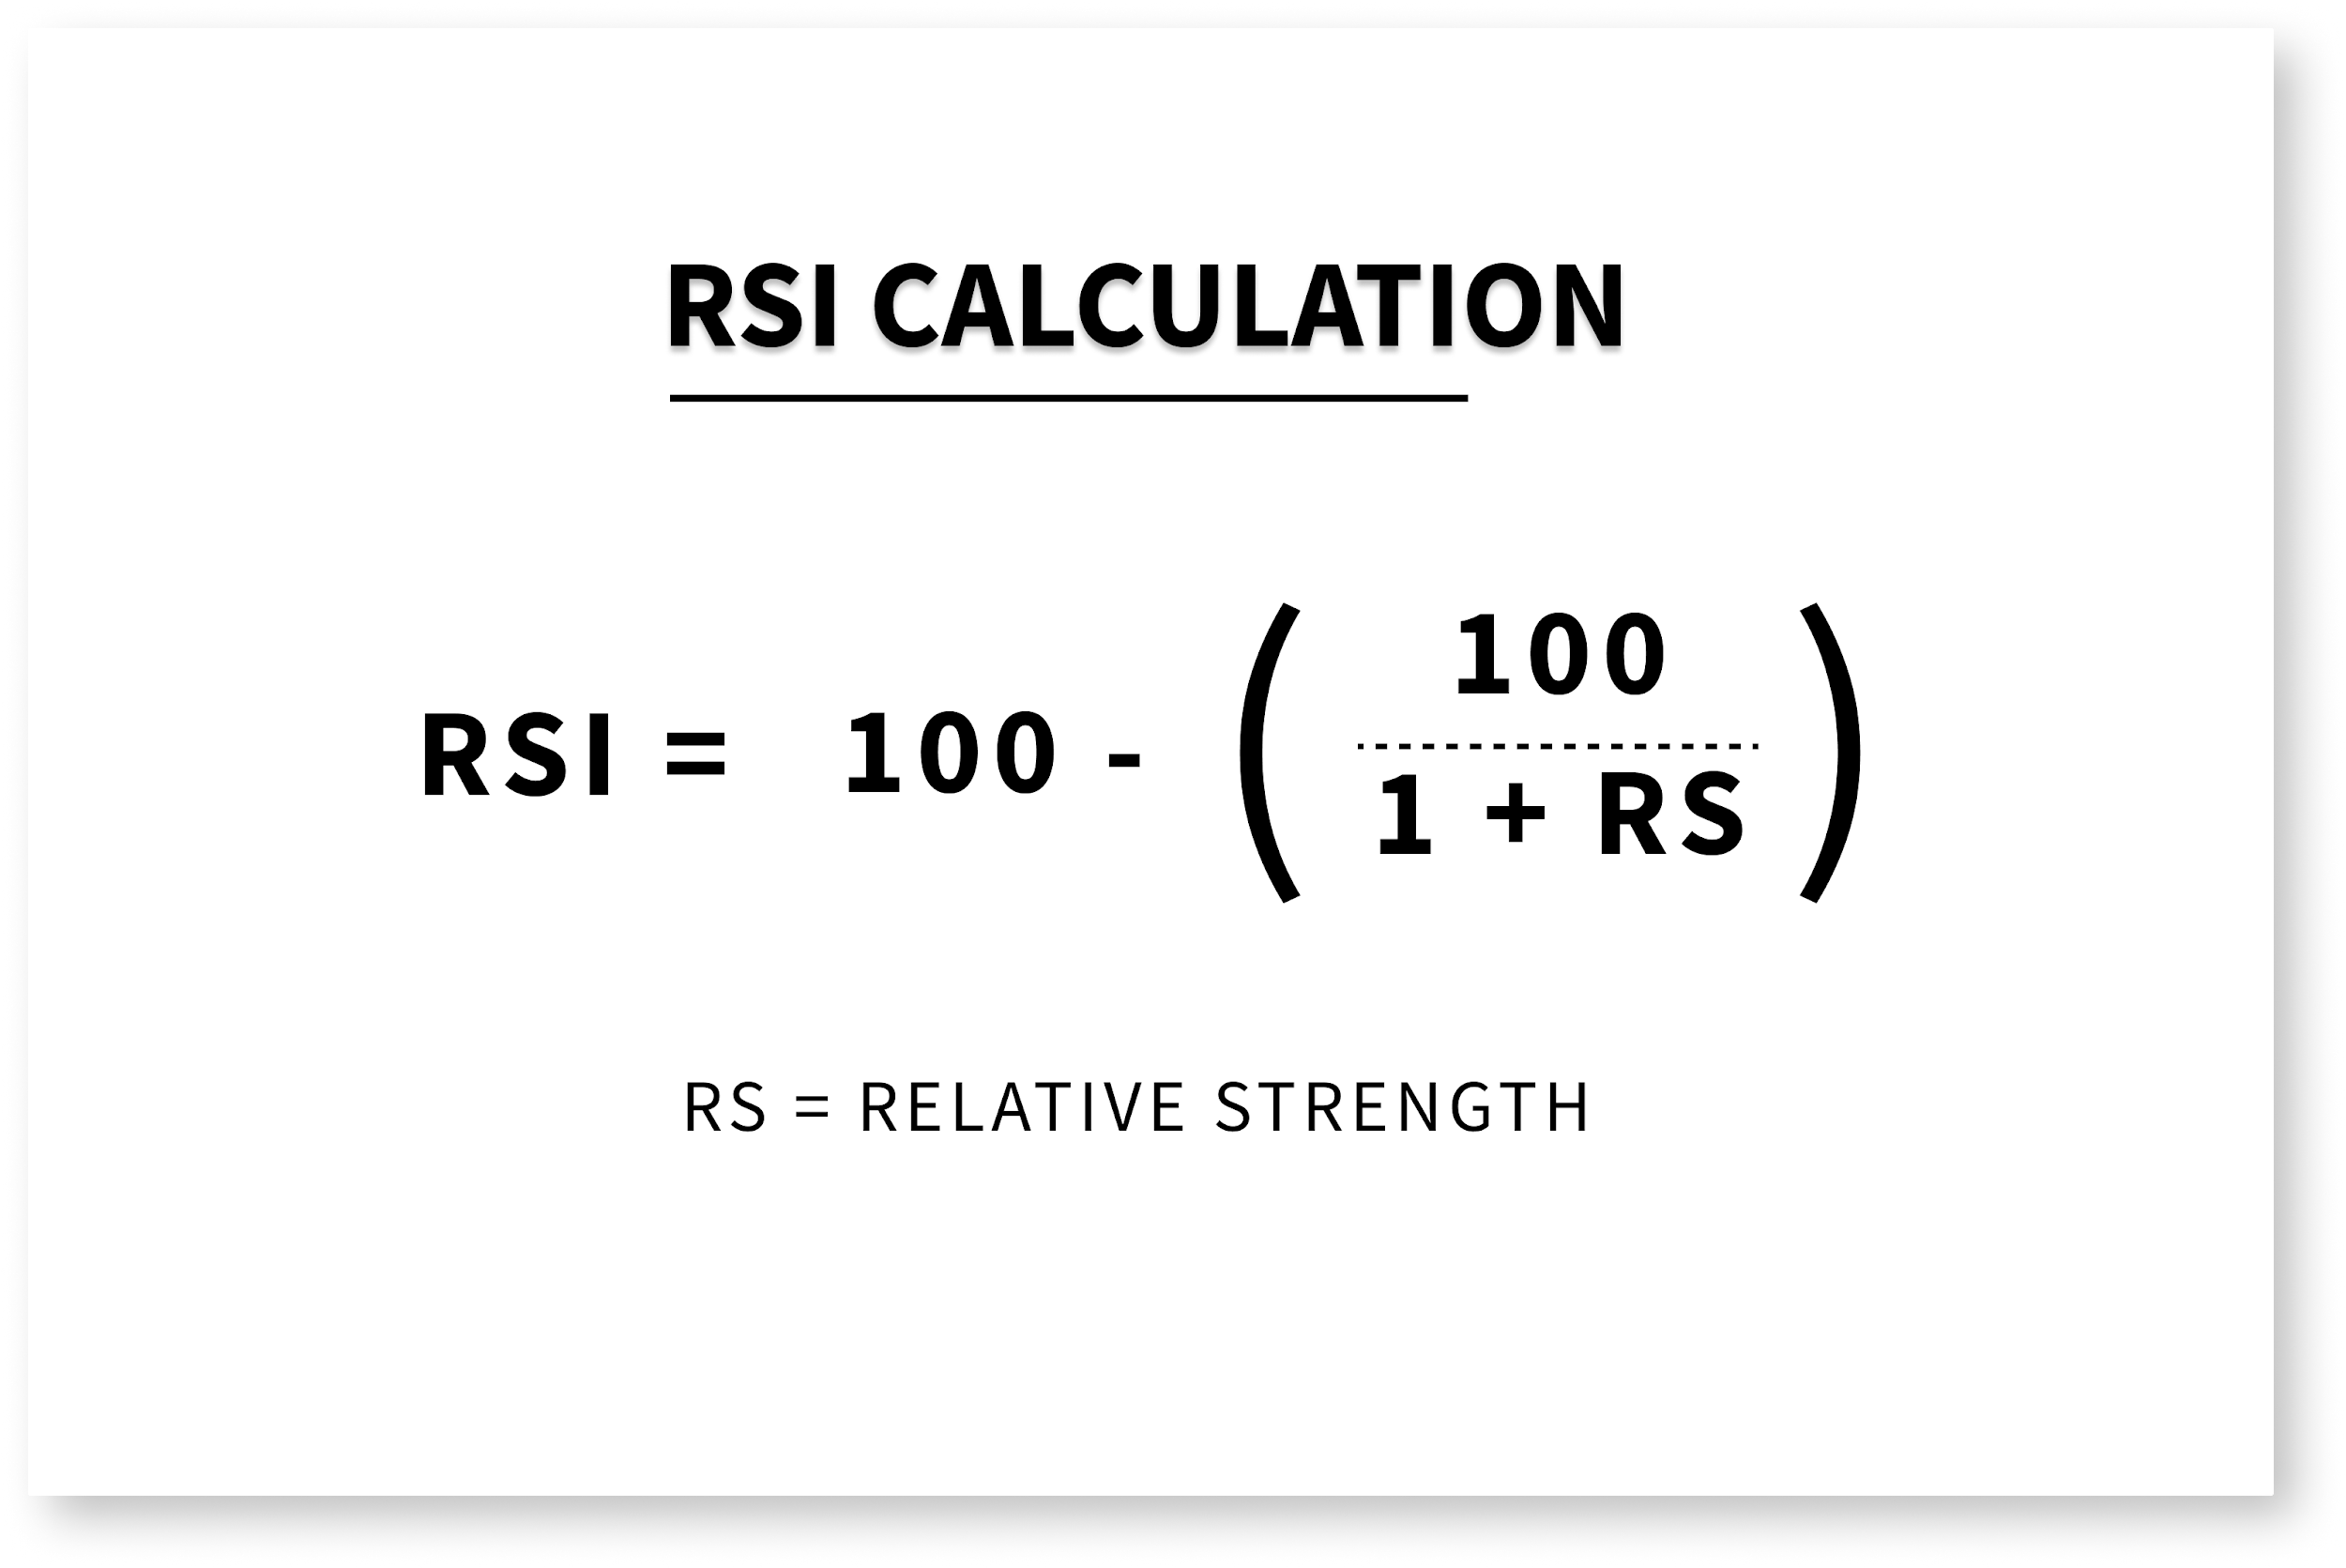
Easy formula, right? But how we calculate RS (Relative Strength) value? This is how you calculate RS.
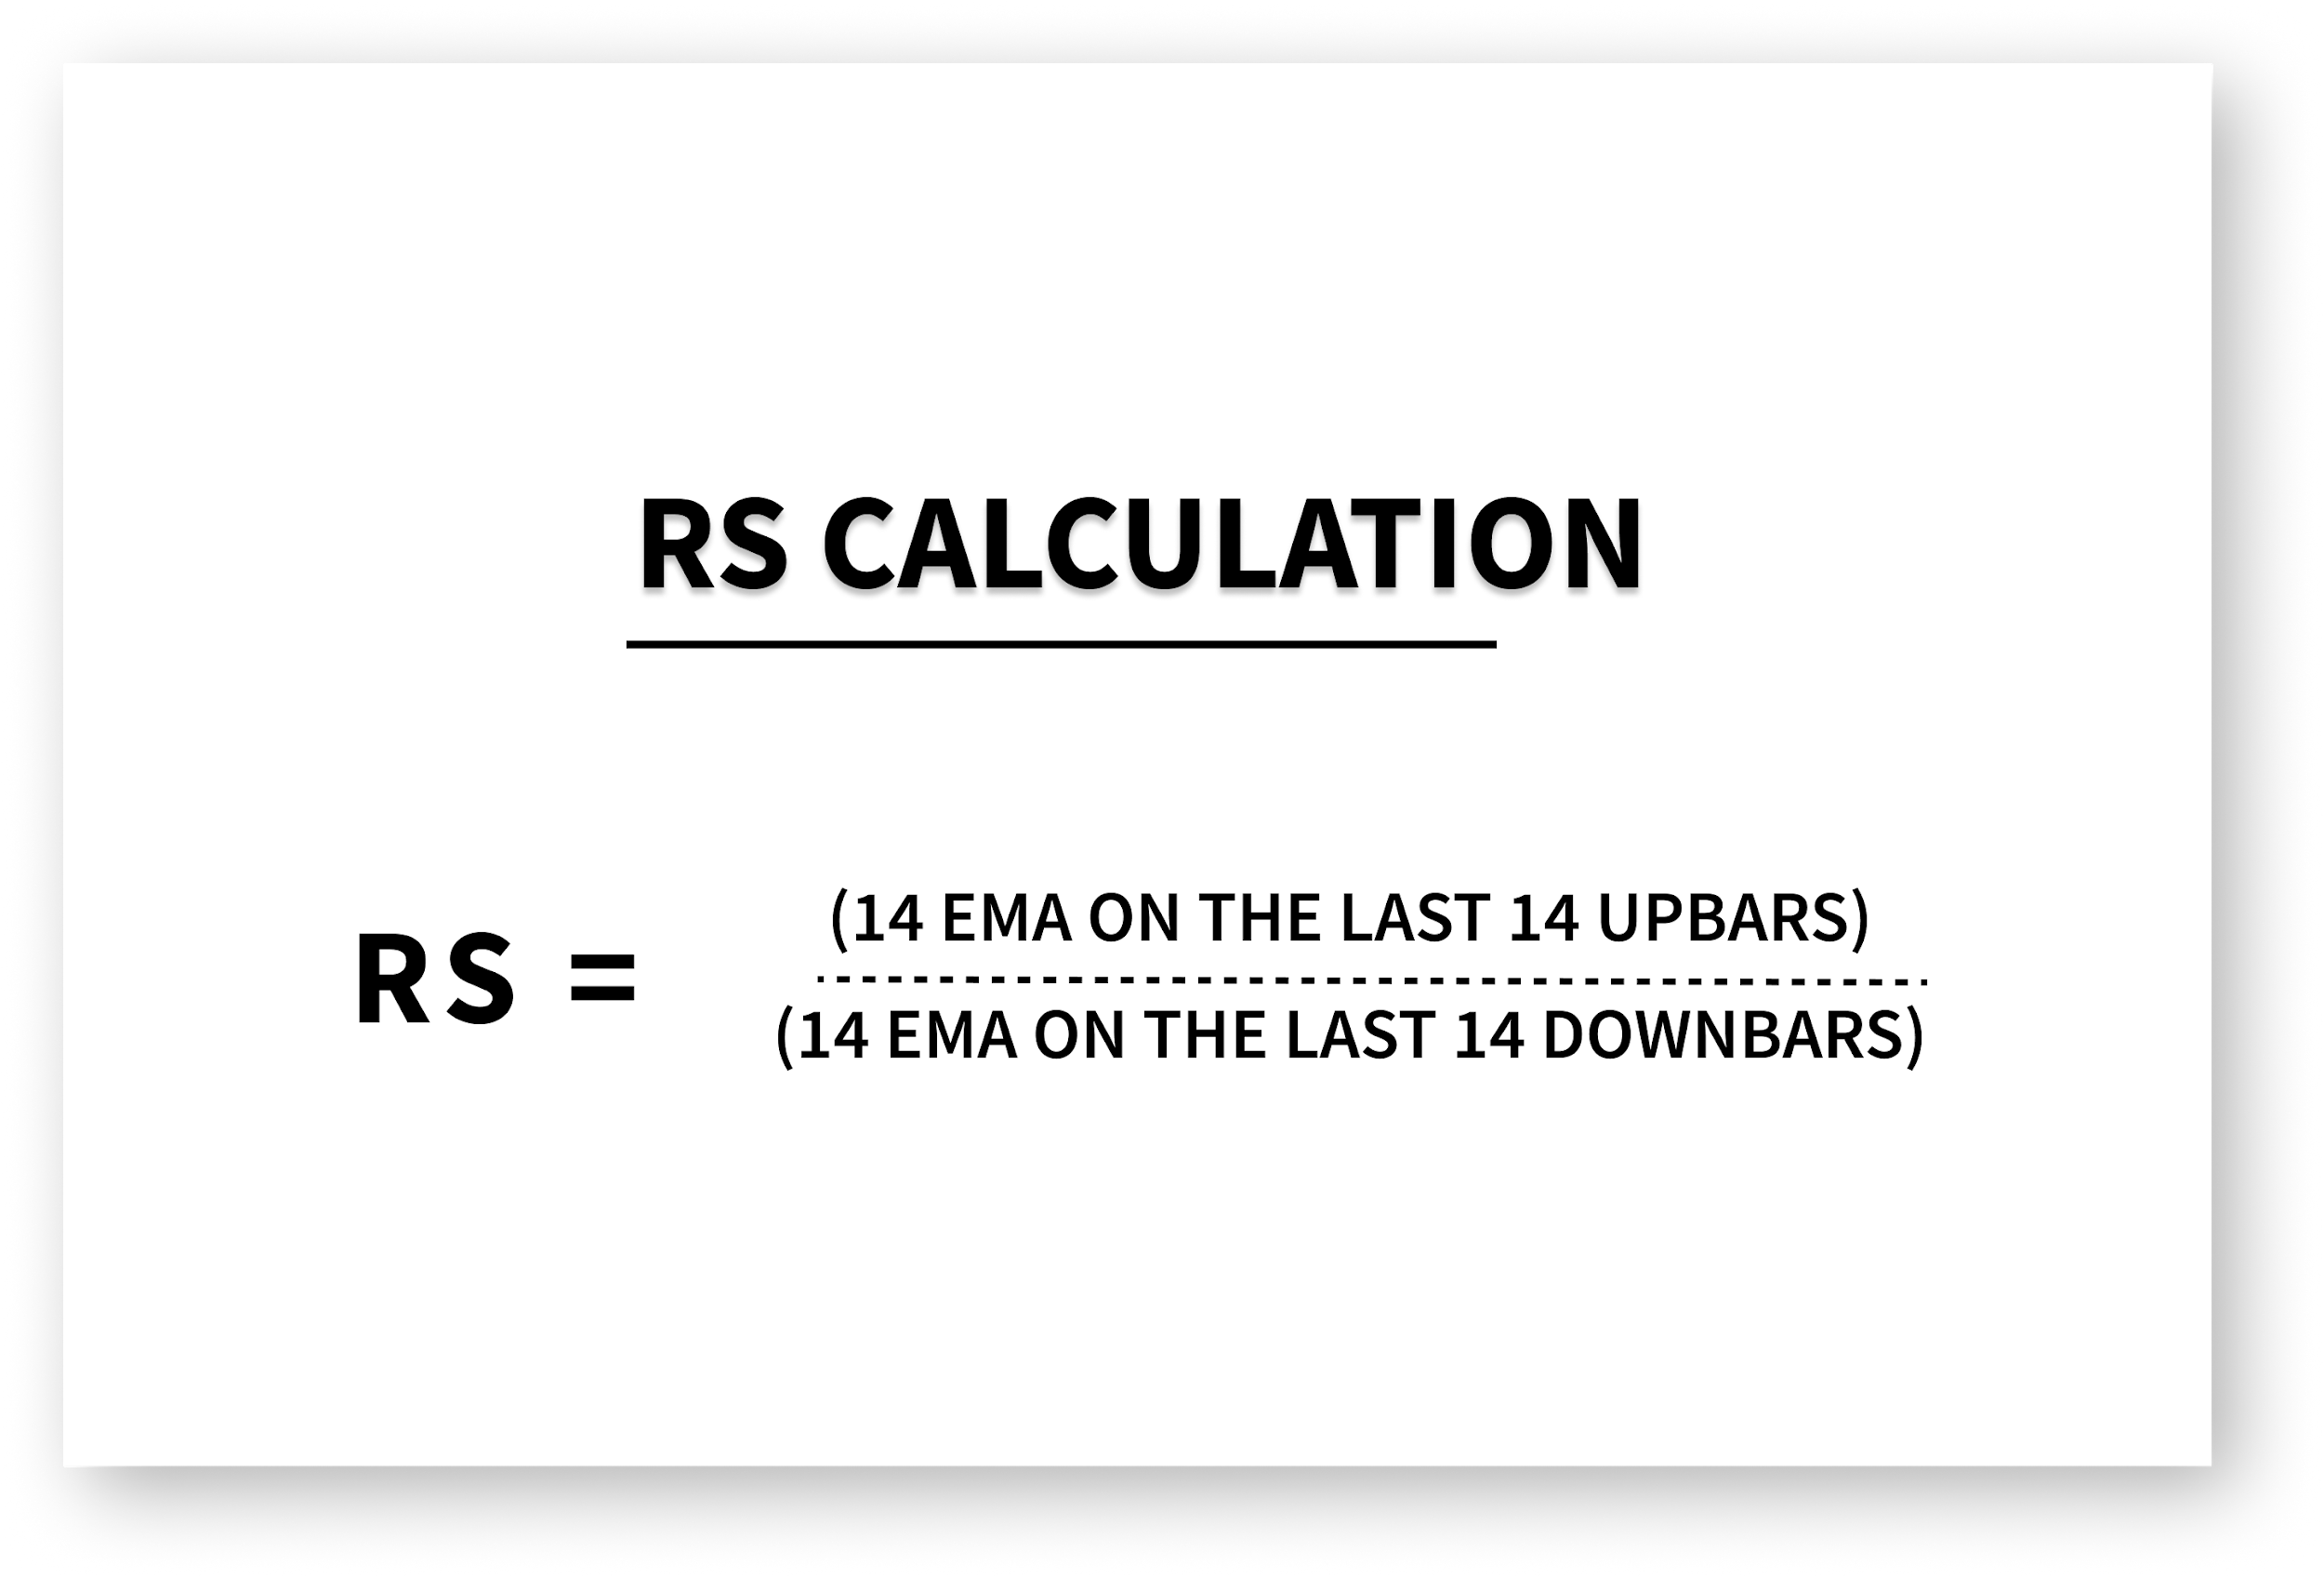
After that, it is pretty straightforward. All you have to do is apply the RS value to the first formula. This will give the current RSI value.
This works the same for other RSI periods as well.
If you don’t get this or you hate maths, don’t get upset because no matter you got this or not RSI indicator will present all the trading signals for you. All you have to do is use them correctly.
Now let’s shift from this boring topic to an exciting one.
You already know the basic of oversold and overbought signals, right? Let’s dig into the advance stuff and see how to effectively use RSI overbought and oversold in forex trading.
How to Use RSI Overbought and Oversold – Correct Way
You already know about RSI overbought and Oversold, right?
When the RSI is above 70 it is considered as overbought and the traders can look for sell opportunities.
And, When the RSI is below 30 it is considered as oversold and the traders can look for buy trade opportunities.
Wow, It is easy, right? But there is a big question.
DOES THIS WORK ALL THE TIME?
The answer is, If you use RSI overbought and oversold signals alone you will surely end up blowing your trading account.
Let me prove that for you.
Have a look at the chart below.
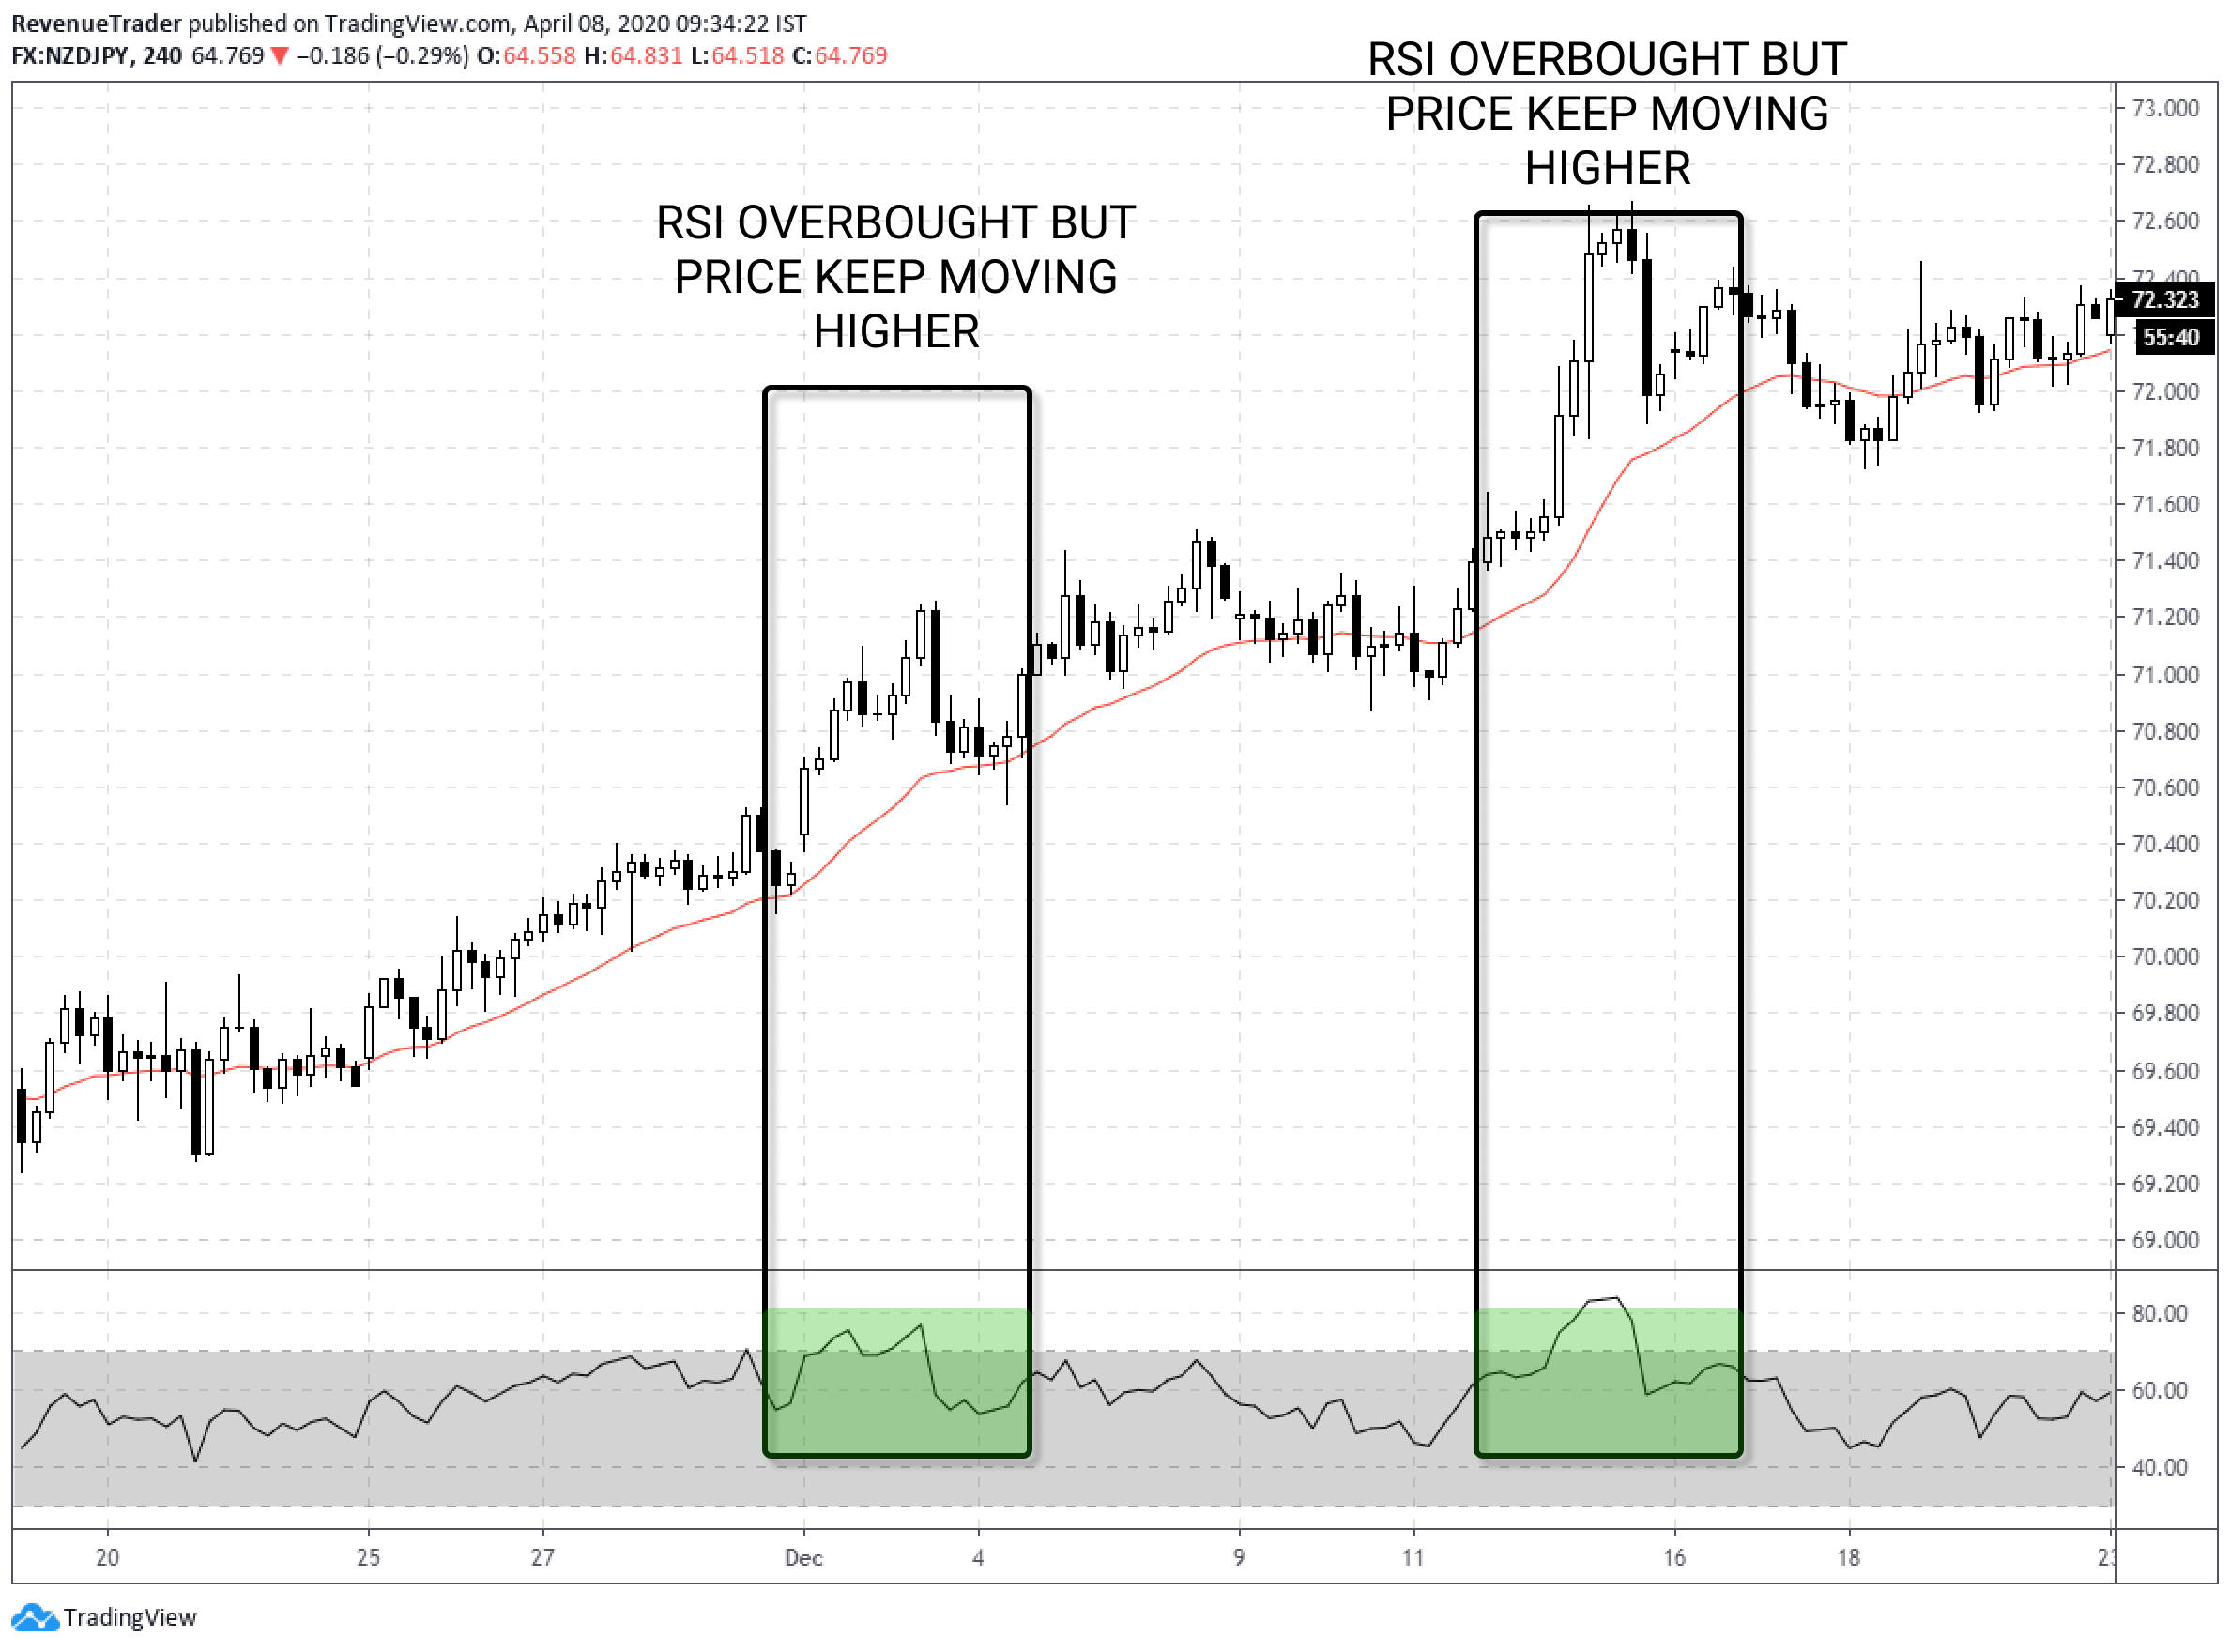
What happened here? Although RSI indicator shows Overbought conditions twice Price ignore it and moved in the direction of the trend.
If you place sell trades in this scenario, you would probably end up losing two trades in a row.
The point here is when the market is in a trend most of the oversold and overbought signals are fakes.
Let’s take a downtrend to see if this is true.
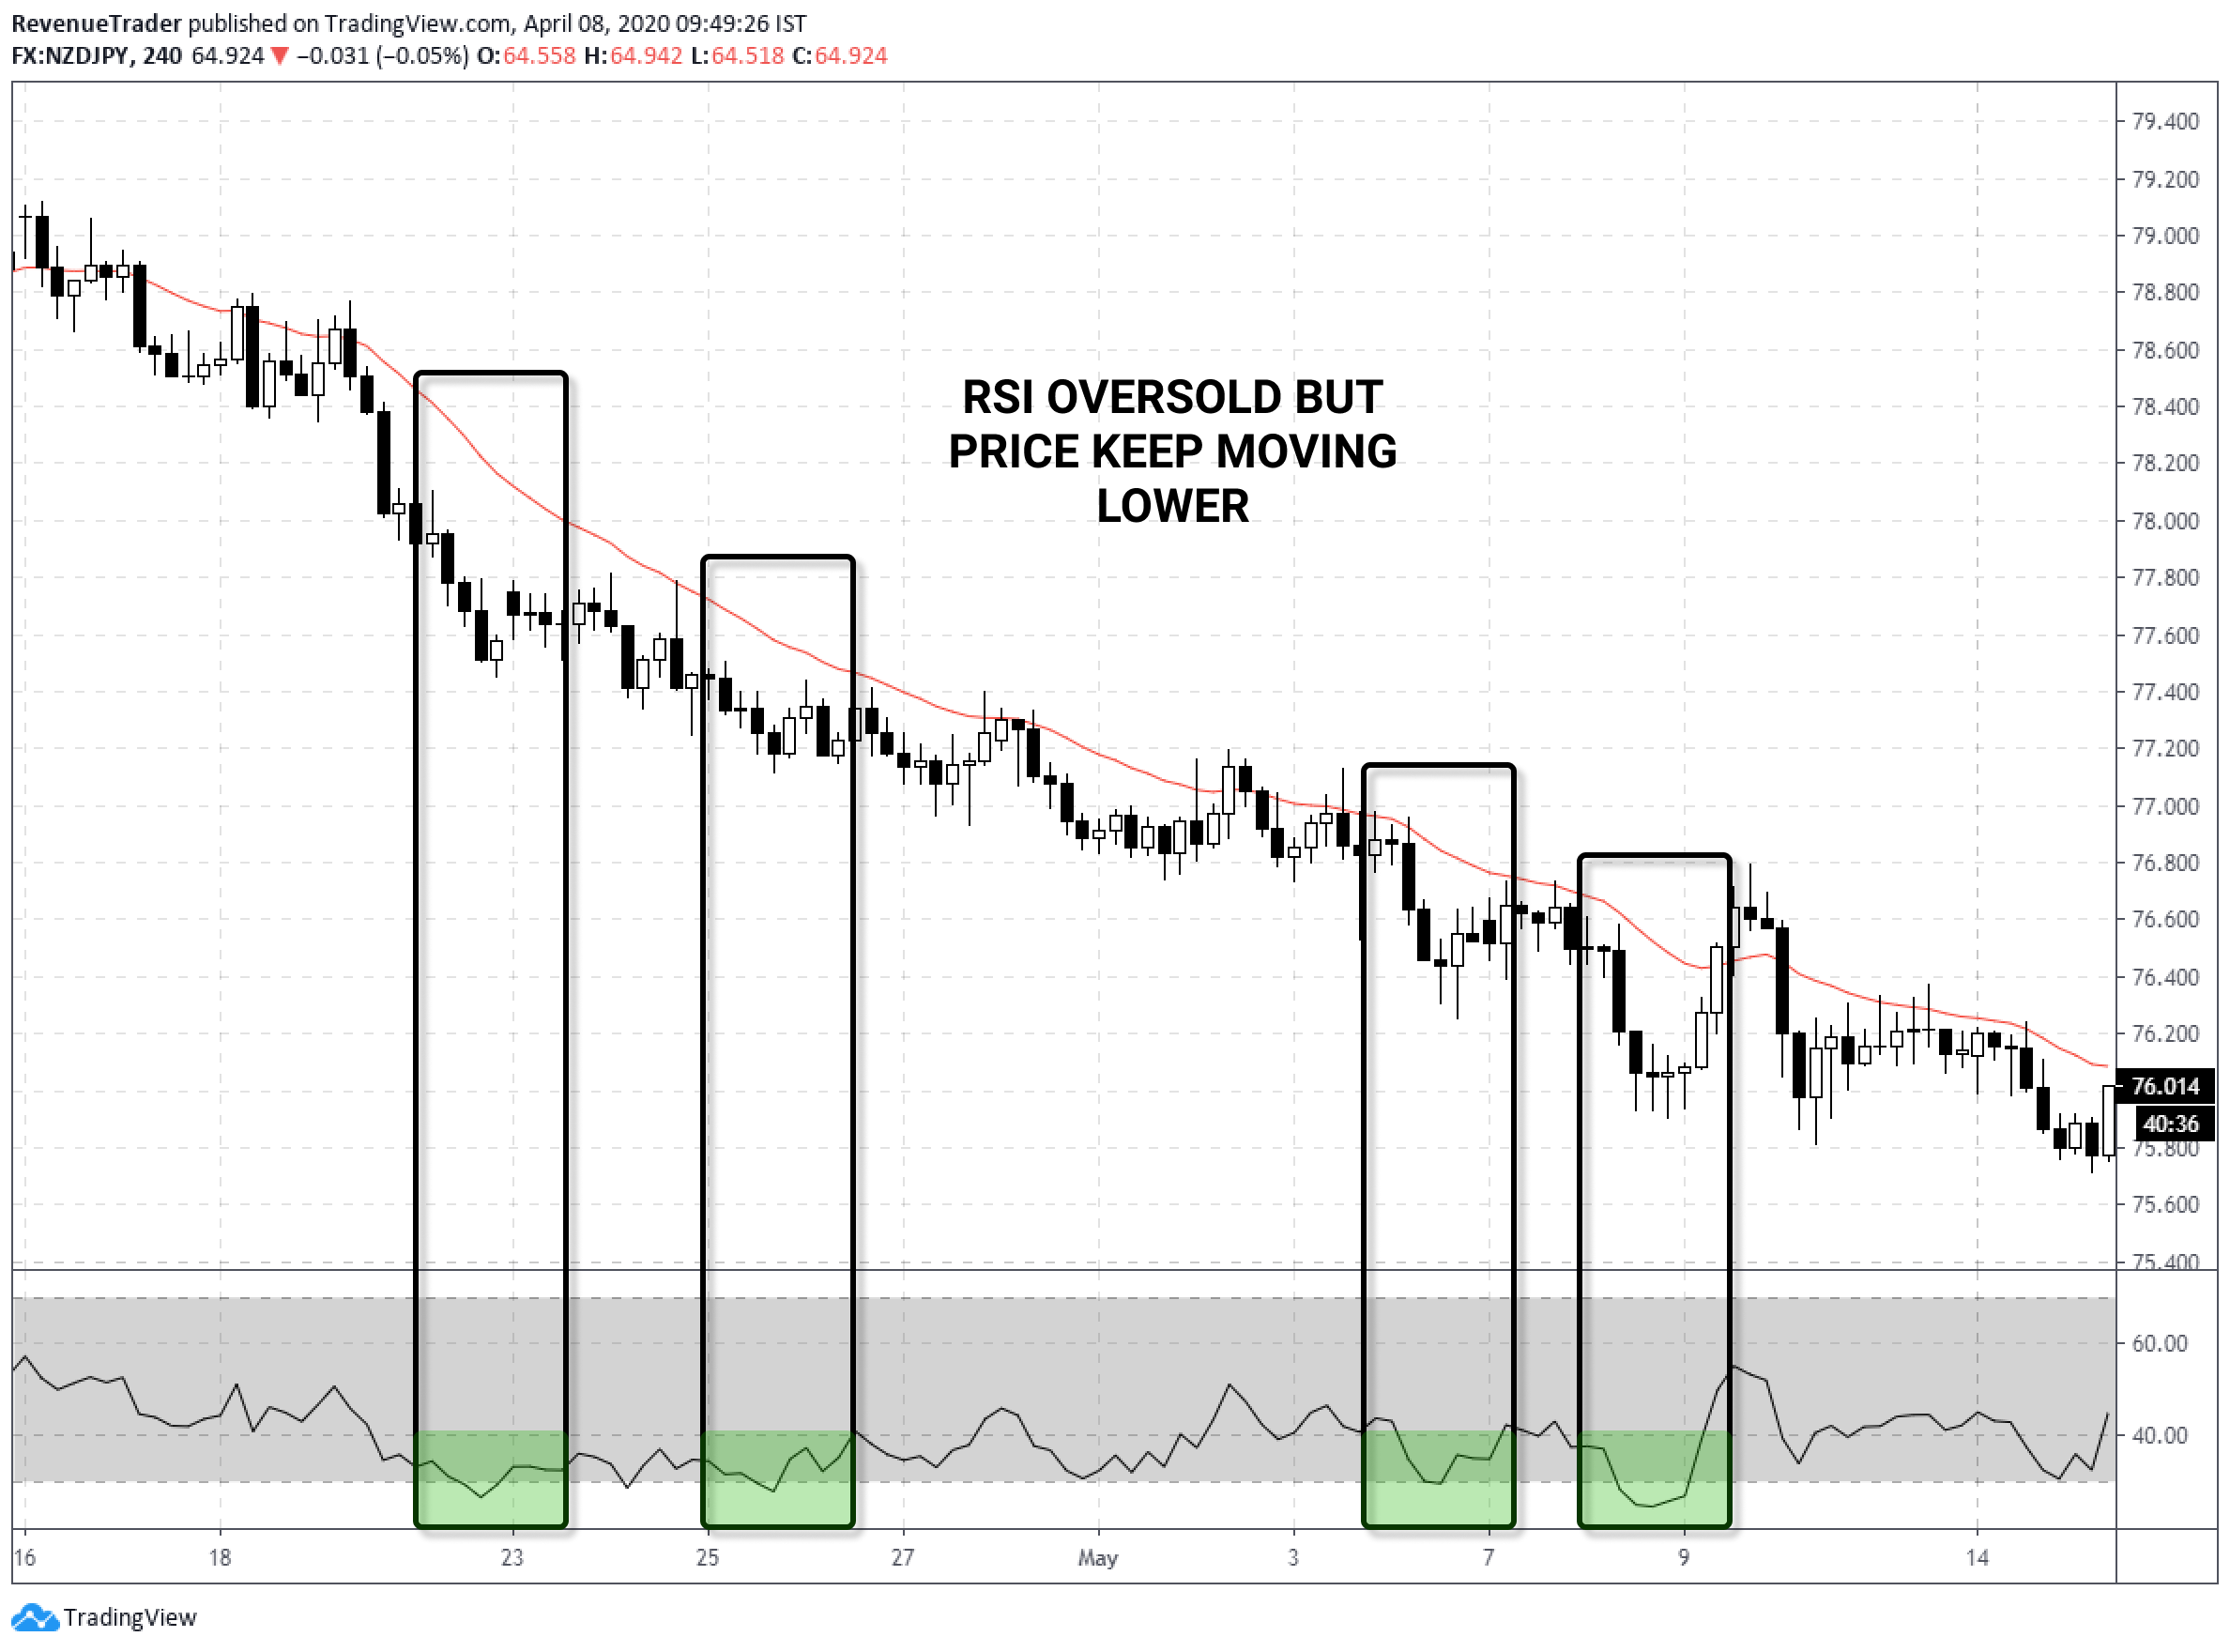
Same thing again, right? RSI Generates four fake oversold signals in a downtrend.
So be very careful when you use RSI indicator in trending market.
If overbought and oversold signals are not worth, then why we even use RSI indicator in forex trading?
The problem is not with the trading indicator. The problem is with the trader that used the indicator. It all comes down to the way that trader use the indicator.
Like we talked earlier, If trader trade RSI overbought and oversold in a trending market, he or she can’t get the full potential of the RSI indicator, right?
Then How to Use RSI Indicator? especially, RSI overbought and oversold signals?
Combine RSI Overbought and Oversold with Other Market Confluences
The RSI is a leading indicator which means that RSI signals typically come before a price on the chart. So we are able to attain early trade signals for our trades but the downside is most these signals alone has no value.
Therefore, RSI overbought and oversold signals should always be used in combination with other forex trading confluences or with other trading techniques for confirmations.
Basically, use the RSI indicator to confirm your trade idea. Don’t rely on RSI indicator to make trading decisions.
Let’s take an example to see how this work.
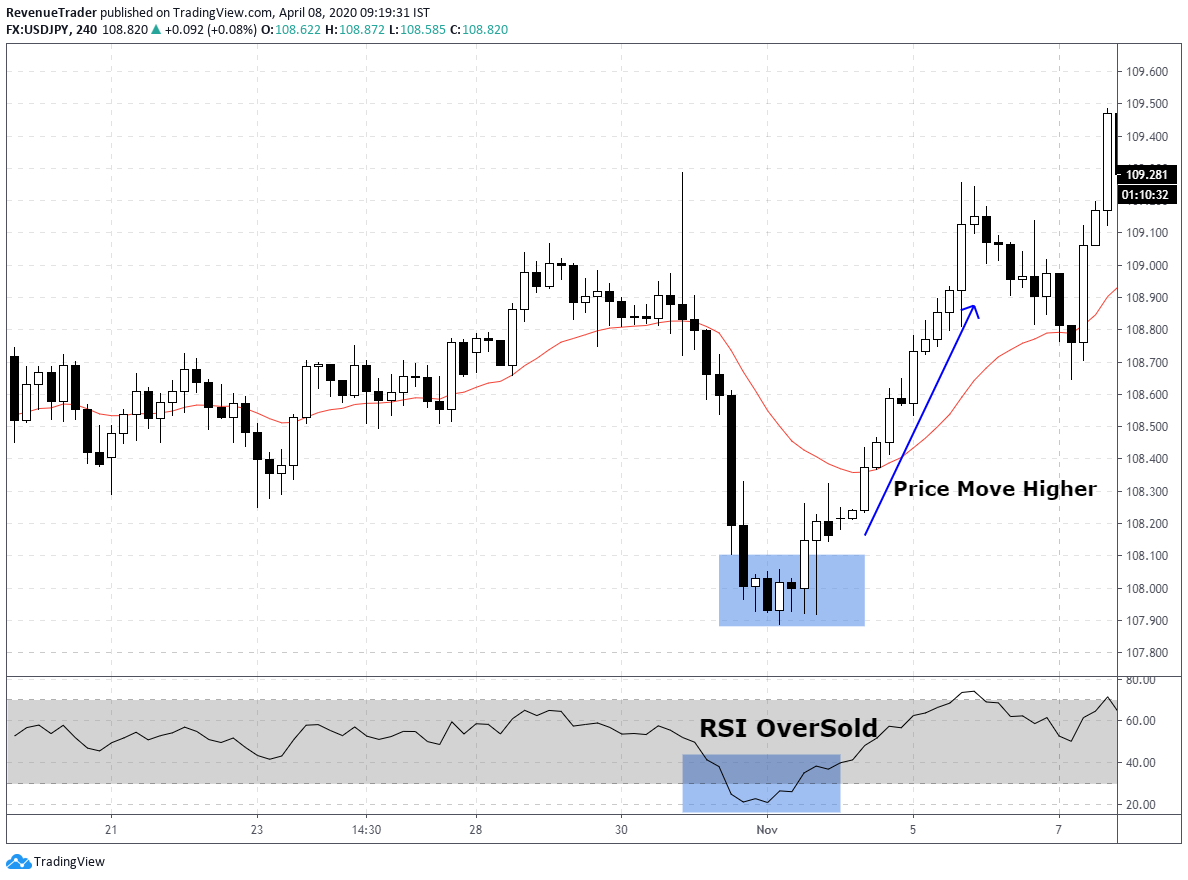
Example one – Combine RSI Indicator with Price Action
Have a look at the forex chart below,
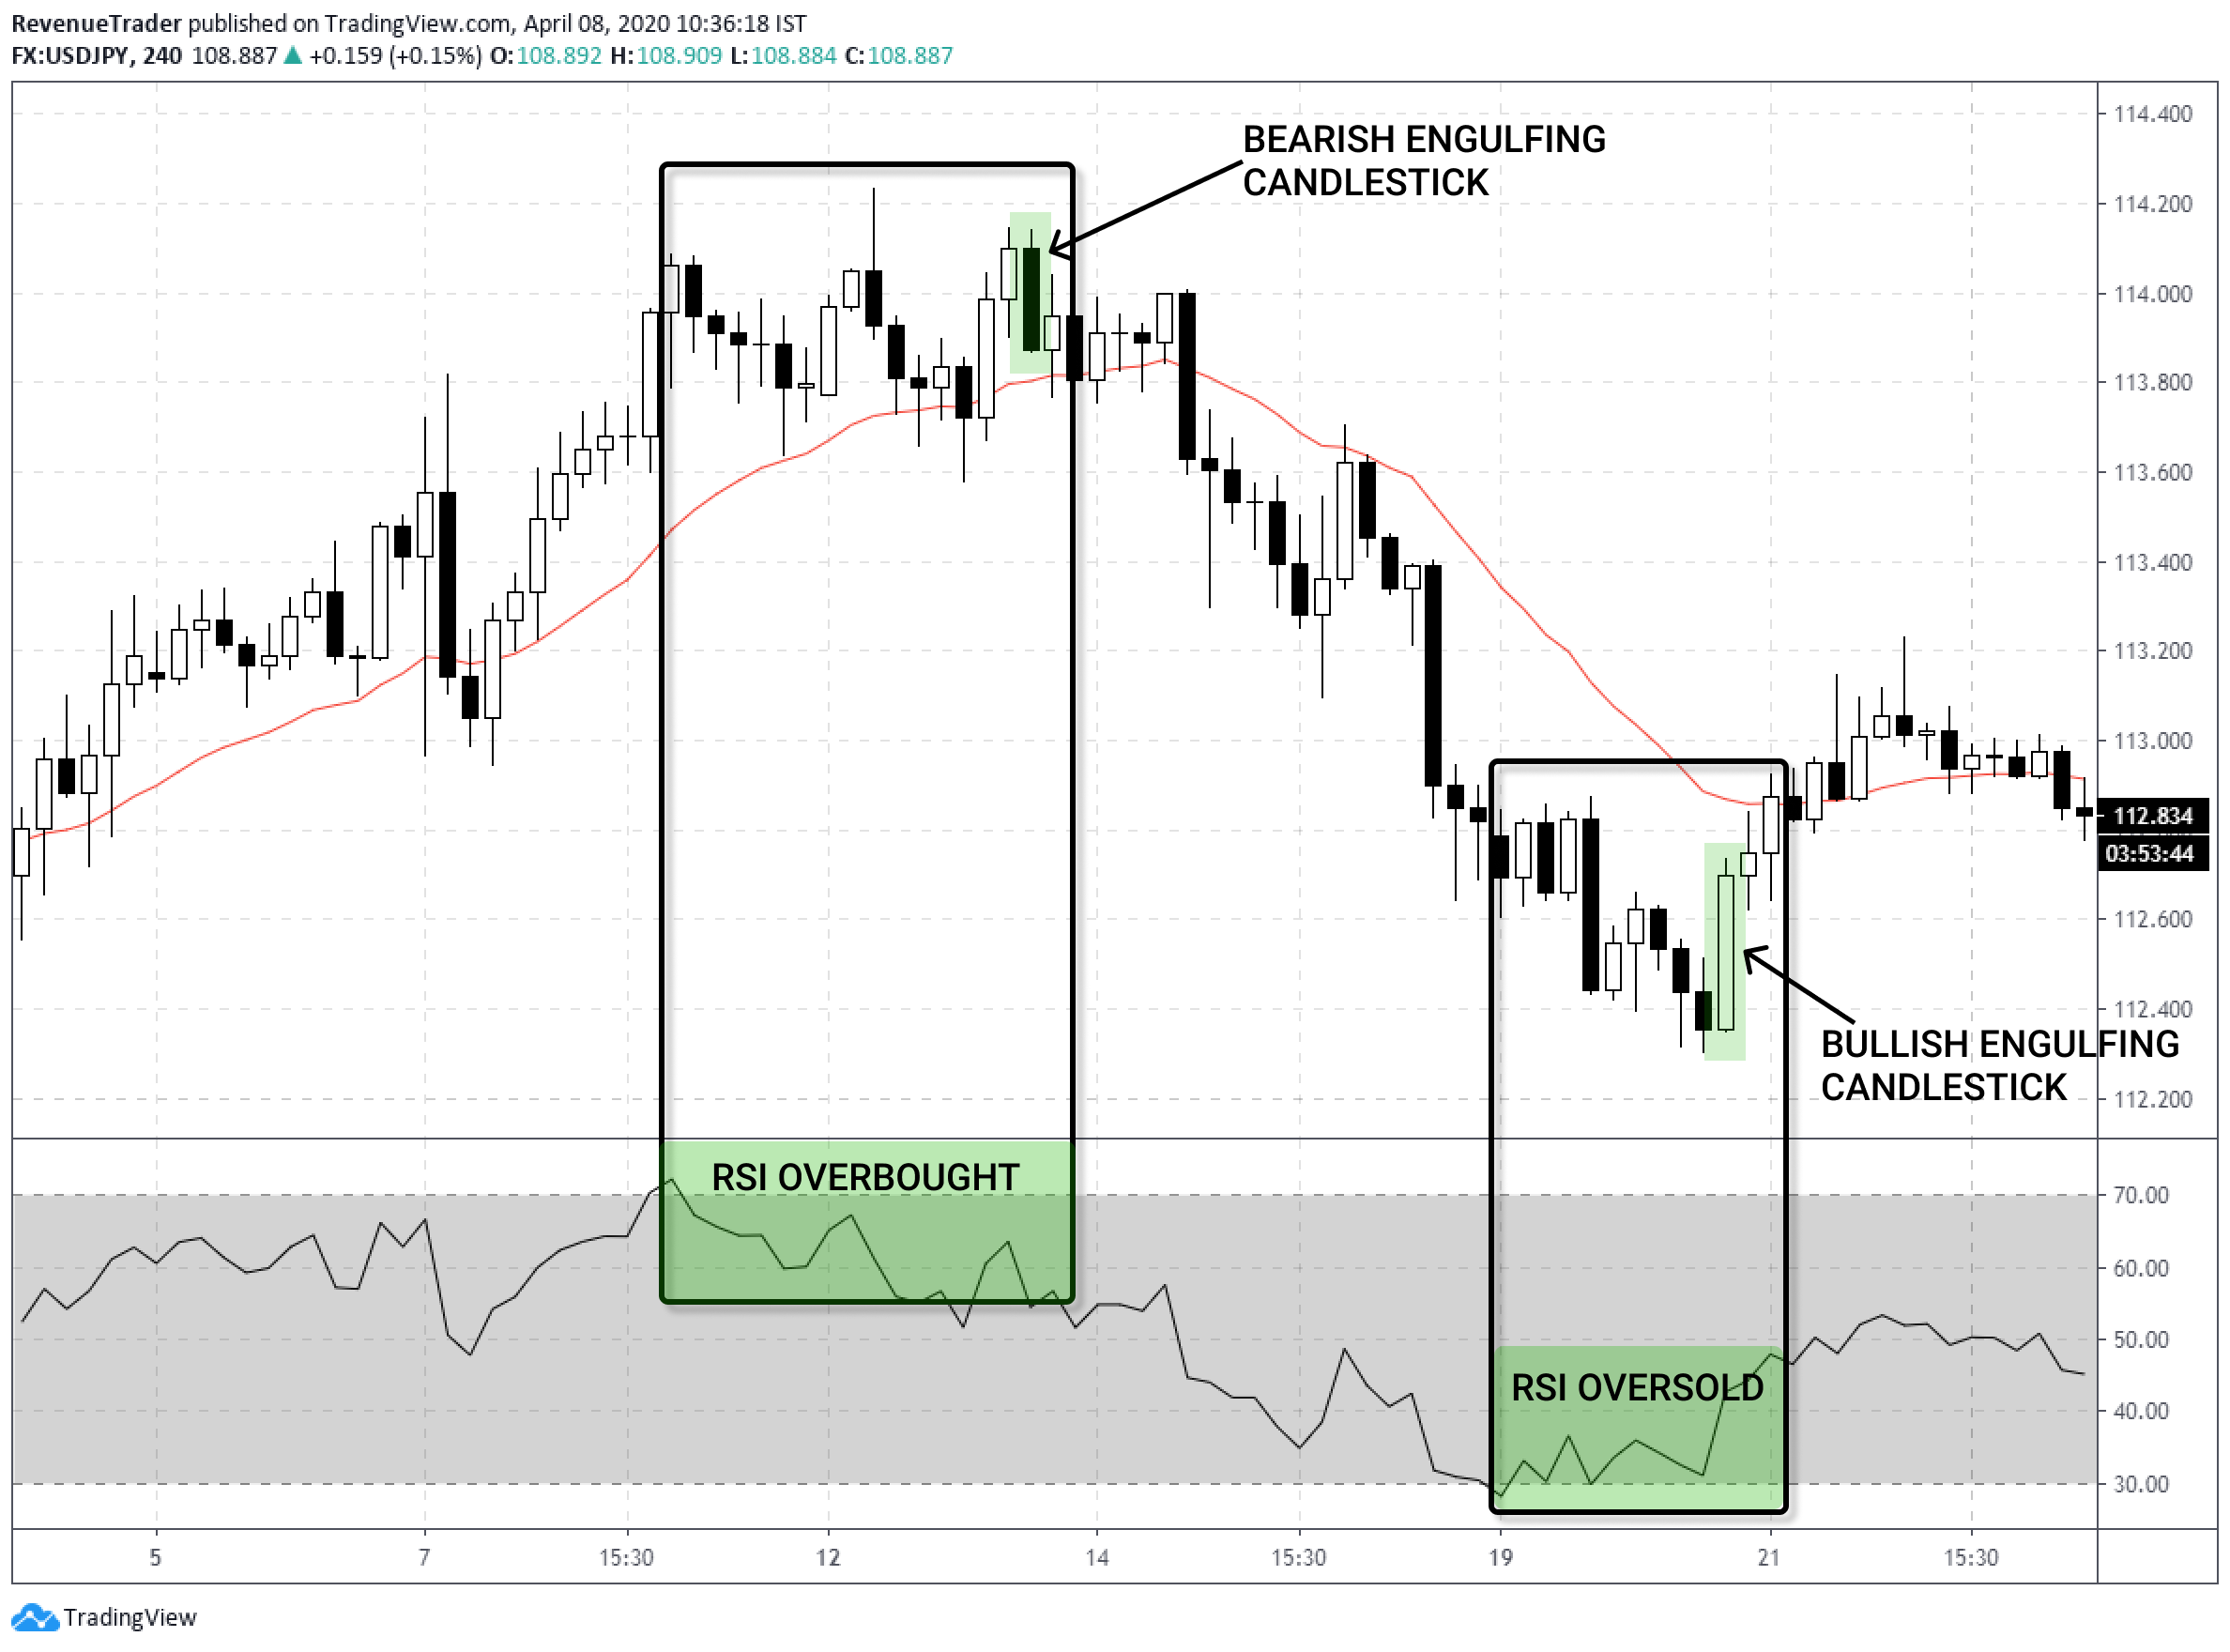
This time instead of selling every Overbought and oversold, we wait for price action confirmation.
Have look at the first trade, We confirm RSI overbought with the Bearish Engulfing candlestick pattern.
In the second trade, the same thing happened but in oppositely. In here we combined RSI oversold with Bullish engulfing candlestick pattern.
Now, Go through some forex chart and see for yourself if this work or not. Keep in mind that, Nothing gonna stick in your head until you take action.
See by combining RSI signals with price actions we can get profitable trade ideas. It far better to waits for confirmation rather than trade every RSI signals that increase the amount of losing trades.
Example Two – Combine RSI Indicator with Chart Patterns
Now let’s see how we can benefit from combining chart patterns with RSI oversold and Overbought signals.
In forex trading, we have lots of chart patterns like the double tops and bottoms, head and shoulders pattern and harmonic patterns and the list go on forever.
These chart patterns indicate the probability of something happening over another. As an example, the double top pattern indicates the probability of the bearish momentum over the bullish momentum.
So think about the result we can get from the RSI indicator if we combined it with the chart patterns.
Okay, Let’s take an example to see how this work.
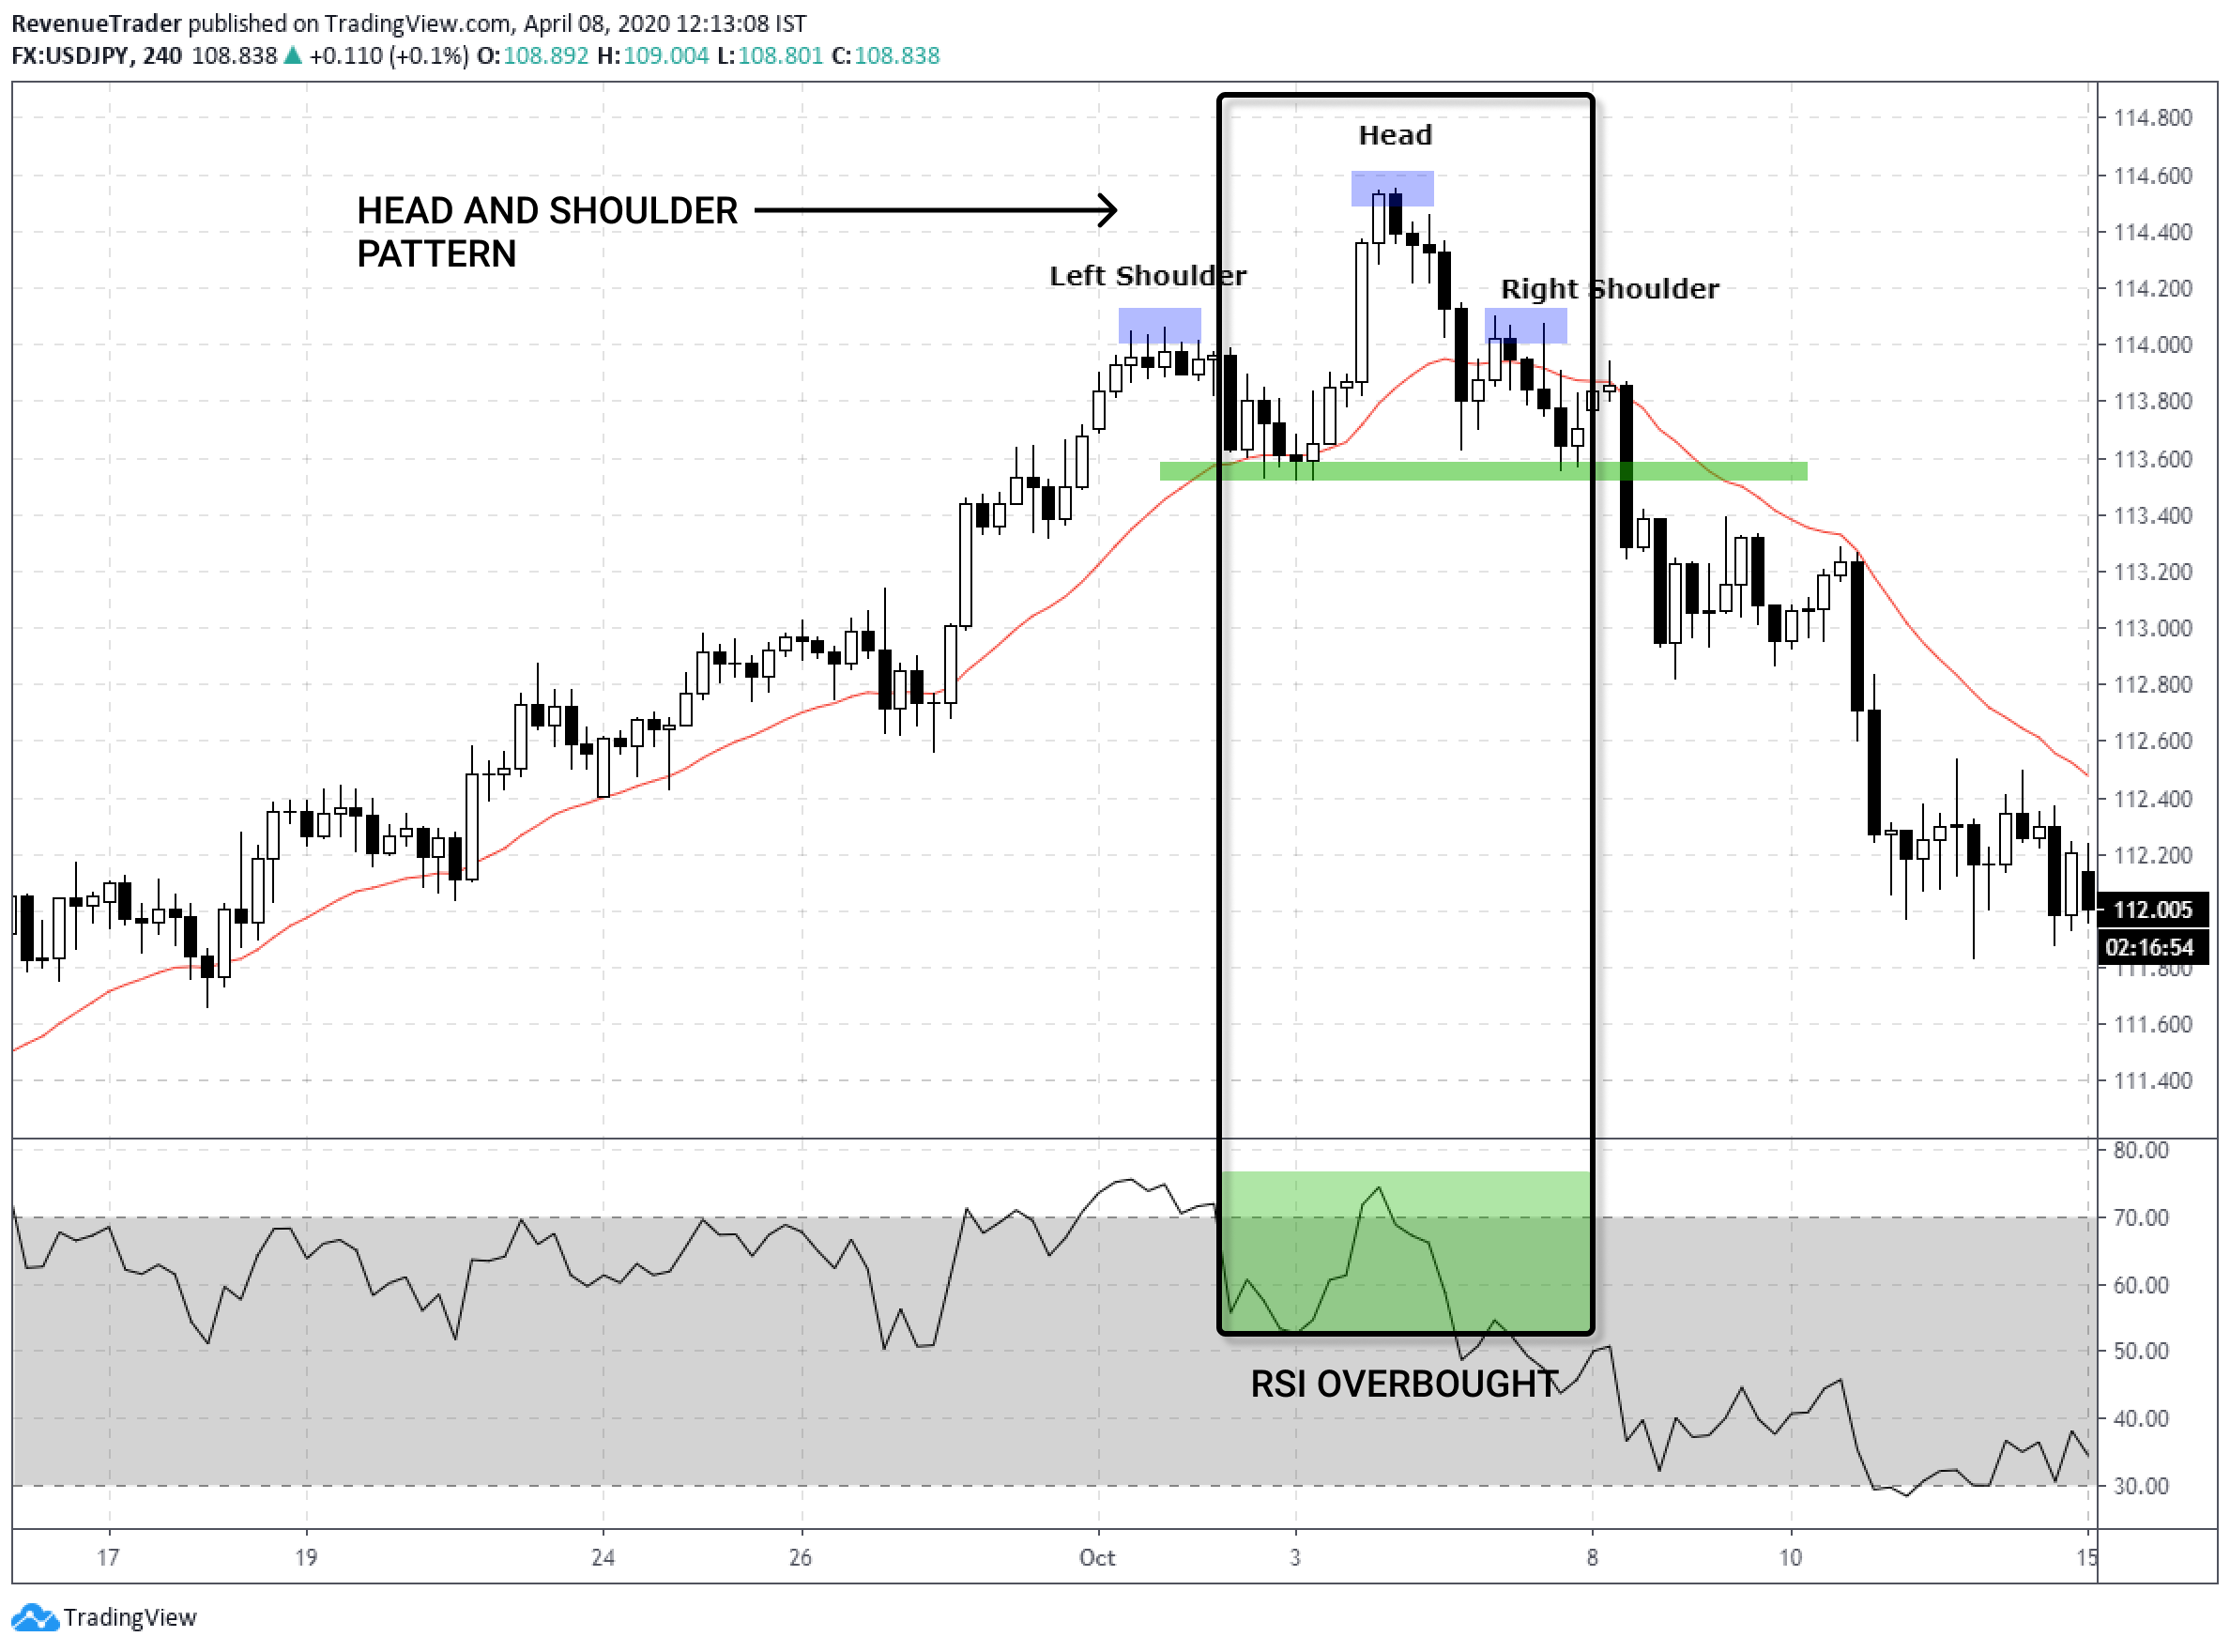
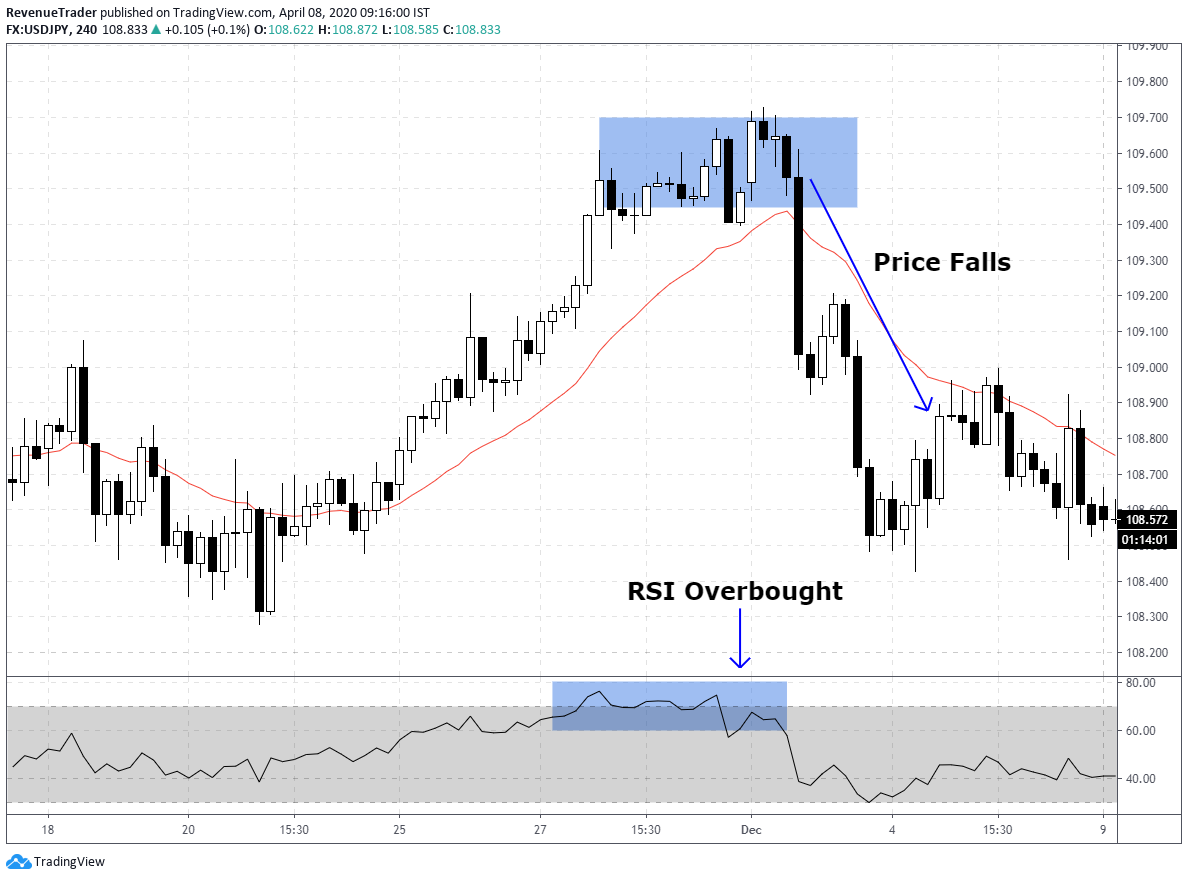
Look at the marked area in the USDJPY 4-hour above. What do you notice?
Head and shoulder pattern nicely aligned with RSI overbought, right? So as forex traders, This is what we have to maintain in order to extract consistence profit from the forex market – combined trading confluences to support your trade idea.
So, what happened after that, the price fell like a waterfall. If you were short there, think about the quick profit you have made. This is the power behind the RSI indicator.
If it uses correctly you can extract consistence profit and if used wrong, It can blow your trading account as well.
Let’s see another way of using the RSI indicator in forex trading before we move into the next exciting topic of RSI Divergence.
You already know that RSI indicator tends to generate lots of fake oversold and overbought signals during trending markets.
However, in Range-bound market the RSI tend to generate lots of good signals.
Let’s see how to use RSI indicator in a Range-Bound market.
Example Three – Use RSI in Range-Bound Market
Now, what is Range-bound market? In forex trading, it also called consolidation market as well.
Consolidation or Range-Bound Market occur due to the lack of trend. Mostly, the Range-Bound market formed after a downtrend or uptrend. Traditionally we can use Range-top to sell and Range-bottom to buy.
If we combined the range-bound market with the RSI indicator we can often get nice profitable trade signals. Have a look at the chart below,
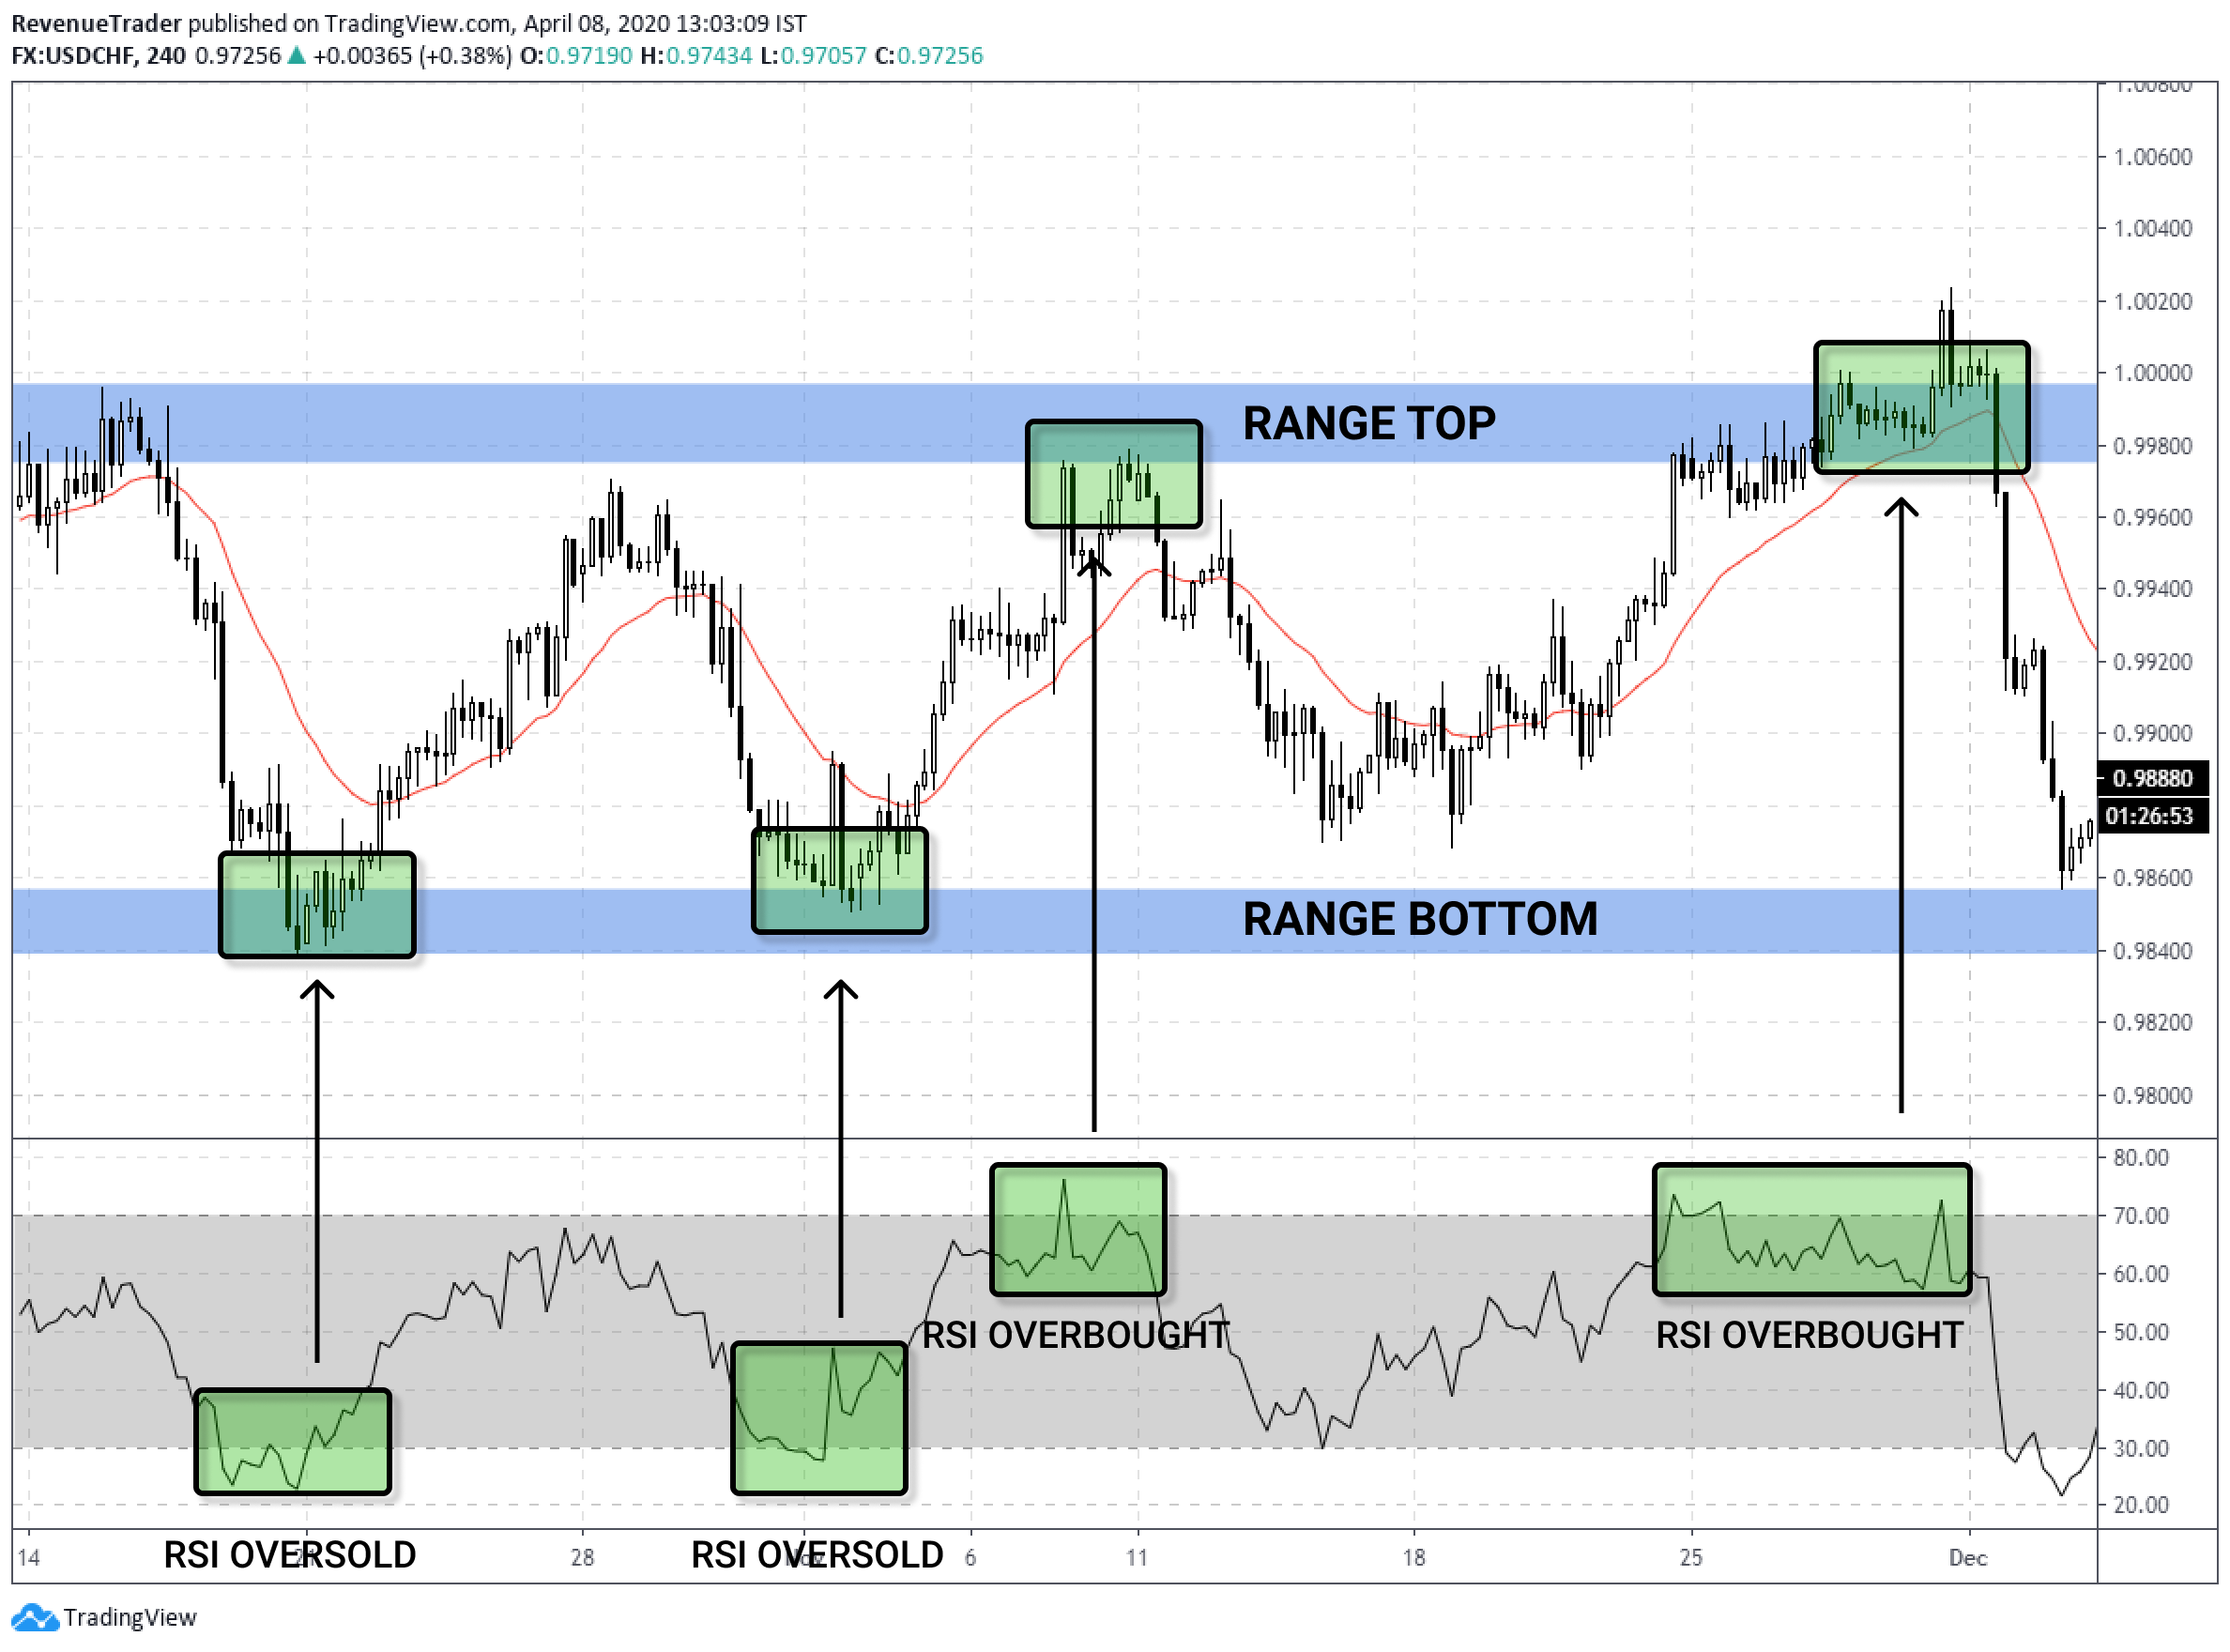
The chart is a little overwhelming, right? But stay with me I will try my best to explain the chart.
First, you can see that the Market is bouncing in between resistance and support.
Can you identify the relationship between the range-bound market and the RSI indicator? If yes, Great!
Every time market pushed down to the range bottom, RSI also in oversold condition and every time market pushed up to range top, RSI also in signals overbought.
Like this, Range-bound market and the RSI indicator can provide great trading opportunities for you.
But also keep in mind that, You cannot sell or buy when the market hit range bottom or top, even when RSI shows overbought or oversold. You have to confirm your trade idea using price action or any other trading technique.
So far we talked about RSI overbought and oversold. Now let’s shift the gears and move into next exciting topic the RSI Divergence.
What is RSI Divergence?
We already talked about the basics of RSI divergence. Now let’s dig into the advanced stuff.
As you know, As RSI divergence is when the price makes higher highs in an uptrend and the RSI indicator makes lower highs, Or in a downtrend, when the price makes lower lows in a downtrend and the RSI indicator makes higher lows.
Have a look at the real forex chart below,
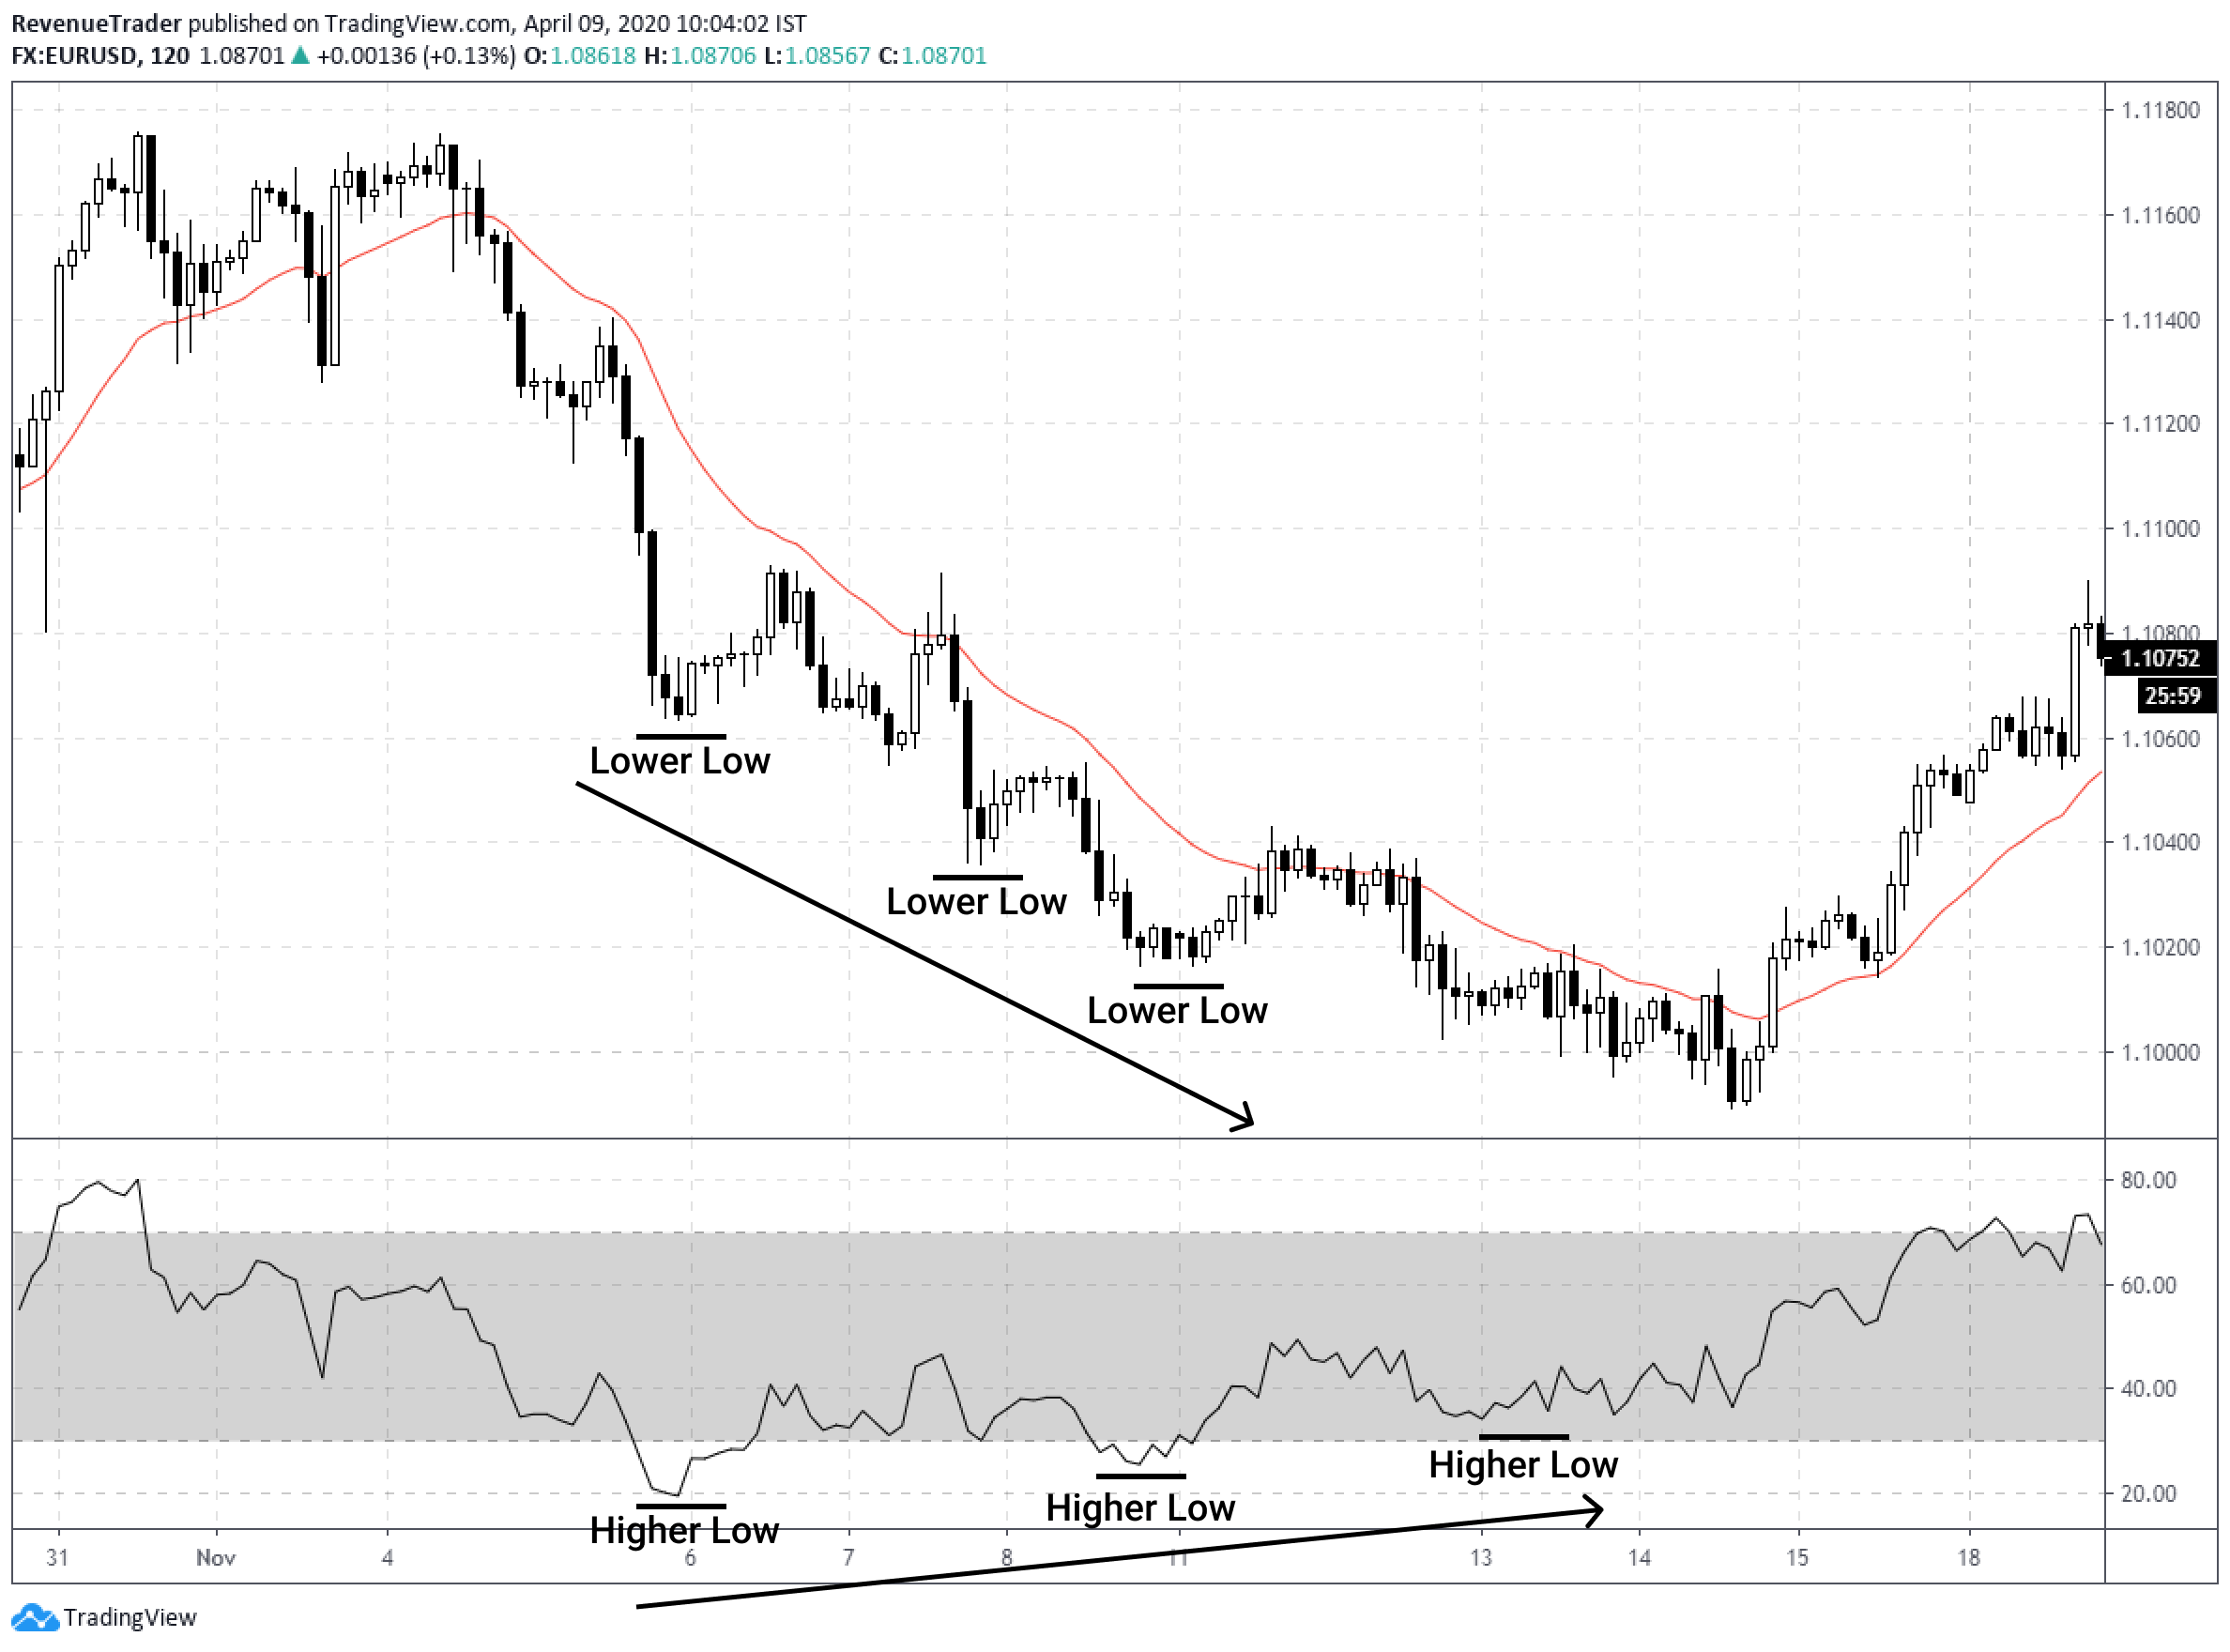
According to the chart above, The price is making lower lows but all of a sudden, the RSI indicator makes Higher Lows. That is the RSI Divergence.
Now let’s see how RSI divergence looks in an uptrend. Have a look at the chart below,
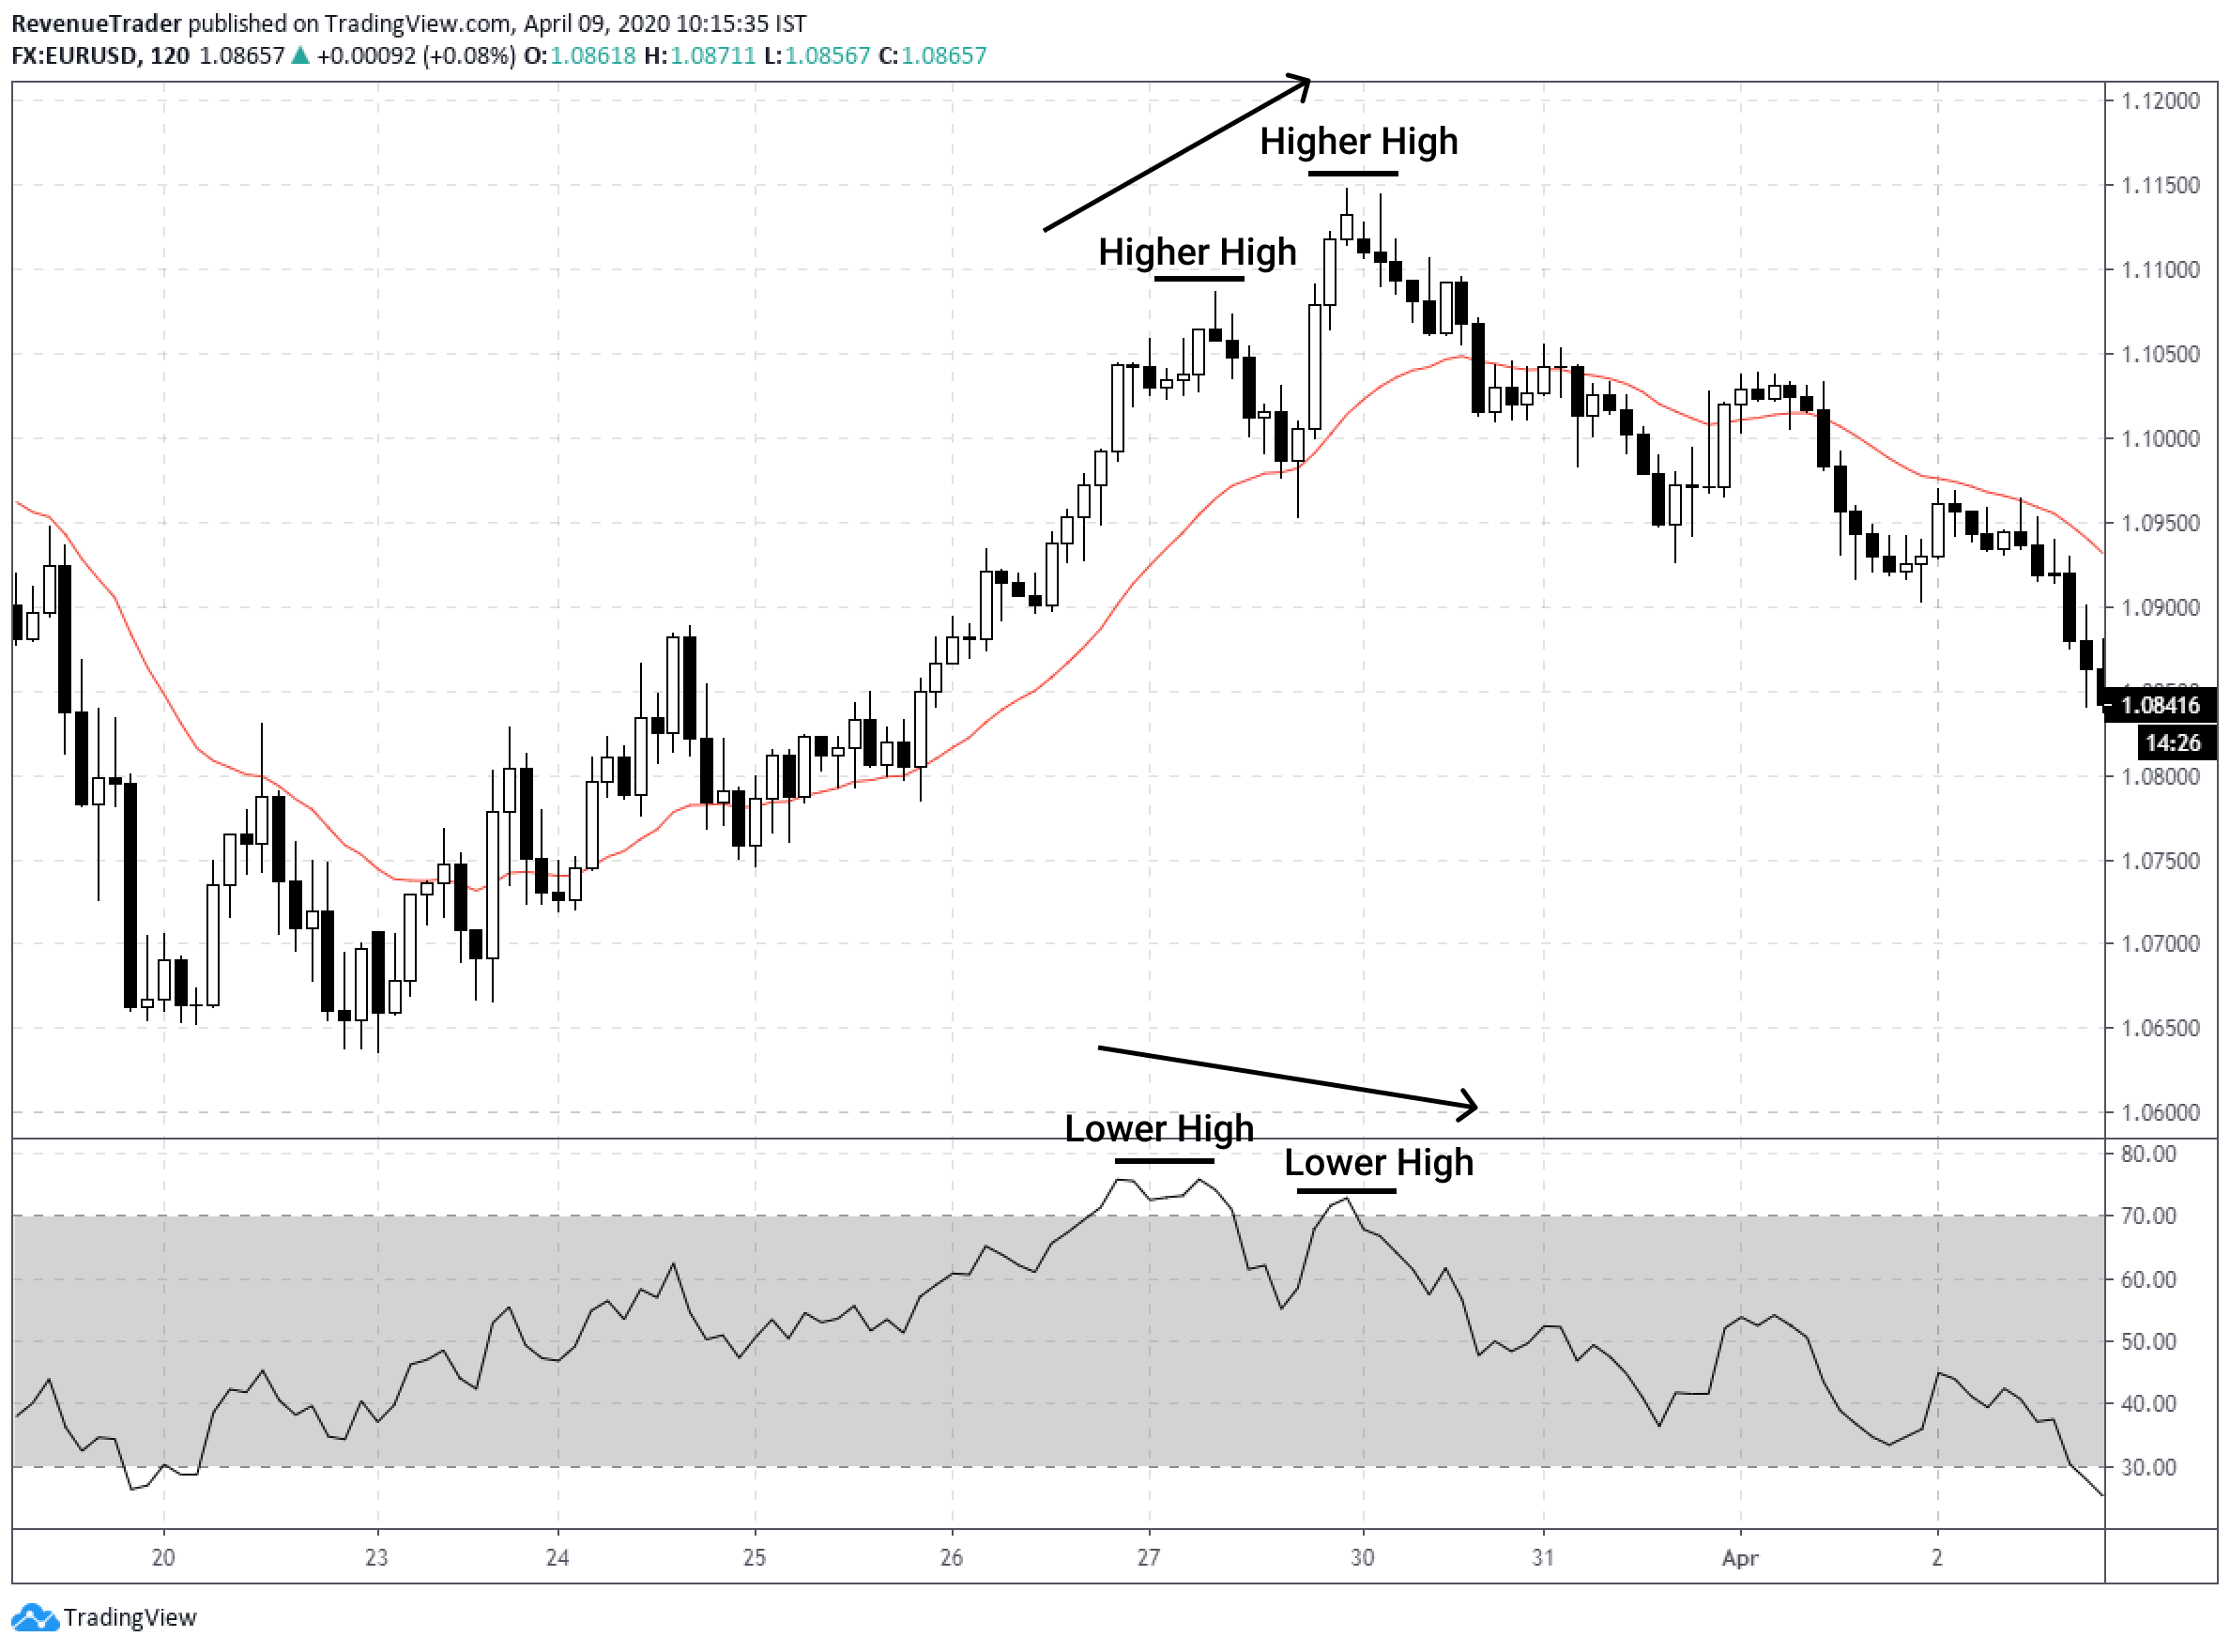
In this example, we can see that the price in an uptrend and it creates a series of higher highs, However, the RSI is starting going down and it creating lower highs. That is the RSI divergence we are looking for, right?
Now, you might think, Why this is useful? Or, How to use Divergence in forex trading? Let me explain.
As you already know the RSI indicator is a momentum indicator.
Which mean as long as the price actions and the RSI indicator line up the same way, we can assume that the ongoing trend or the price move is indicating momentum in a particular direction.
However, Once we recognise the price actions and the RSI indicator is doing the opposite things, we can anticipate the lack of momentum in a move Or in trending scenario we can expect a trend reversal.
So the point here is, You can Use RSI Divergence to Spot Trend Reversal Early.
Next, let’s How to use RSI divergence to trade the forex market.
How To Use RSI Divergences
RSI divergence gives early clue about trend reversals and it is a good way to see if the trend you are in is losing the momentum or not.
For me, I use RSI divergence as an early indication of a trend reversal. RSI divergence on its own is not a good trading signal to trade on.
Personally, I trade trend reversals. So RSI divergence helps me to find weaknesses of ongoing trends. Then I combine this with other market confluences.
Let’s see some of the ways to use RSI divergence in forex trading.
Trade Example – Use RSI Divergence With Head and Shoulders Pattern
Both head and shoulders pattern and RSI divergence indicates trend reversals, right? Whether it is uptrend or downtrend.
So, think about a trade setup that has both the head and shoulders pattern and RSI divergence aligned at the same time.
That is what exactly we are going look. Have look at the trade below we posted on our Facebook page.
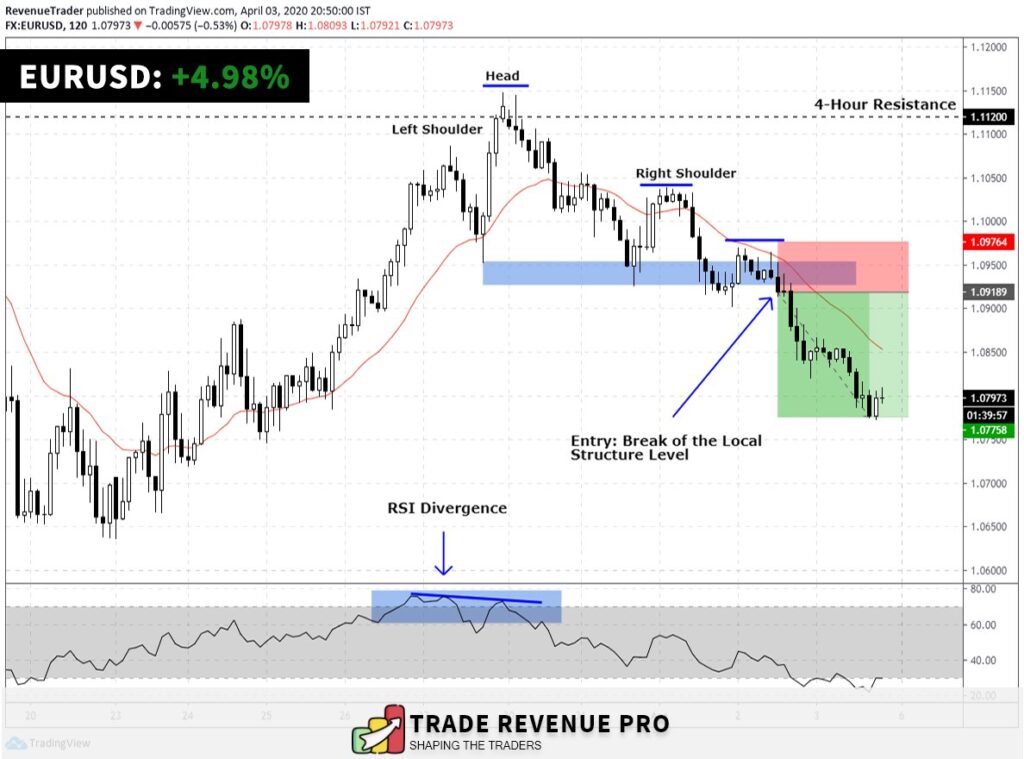
Have a look at the chart above, first, you can see that the RSI show divergence when price making higher highs. Then occur of the head and shoulders pattern confirm the RSI divergence.
So what happened after that, The whole fundamental has changed and uptrend reverses into a whole new downtrend.
Okay, let’s take another example to clear the things out. Have a look at the EURJPY 2-Hour trade that I’m currently in.
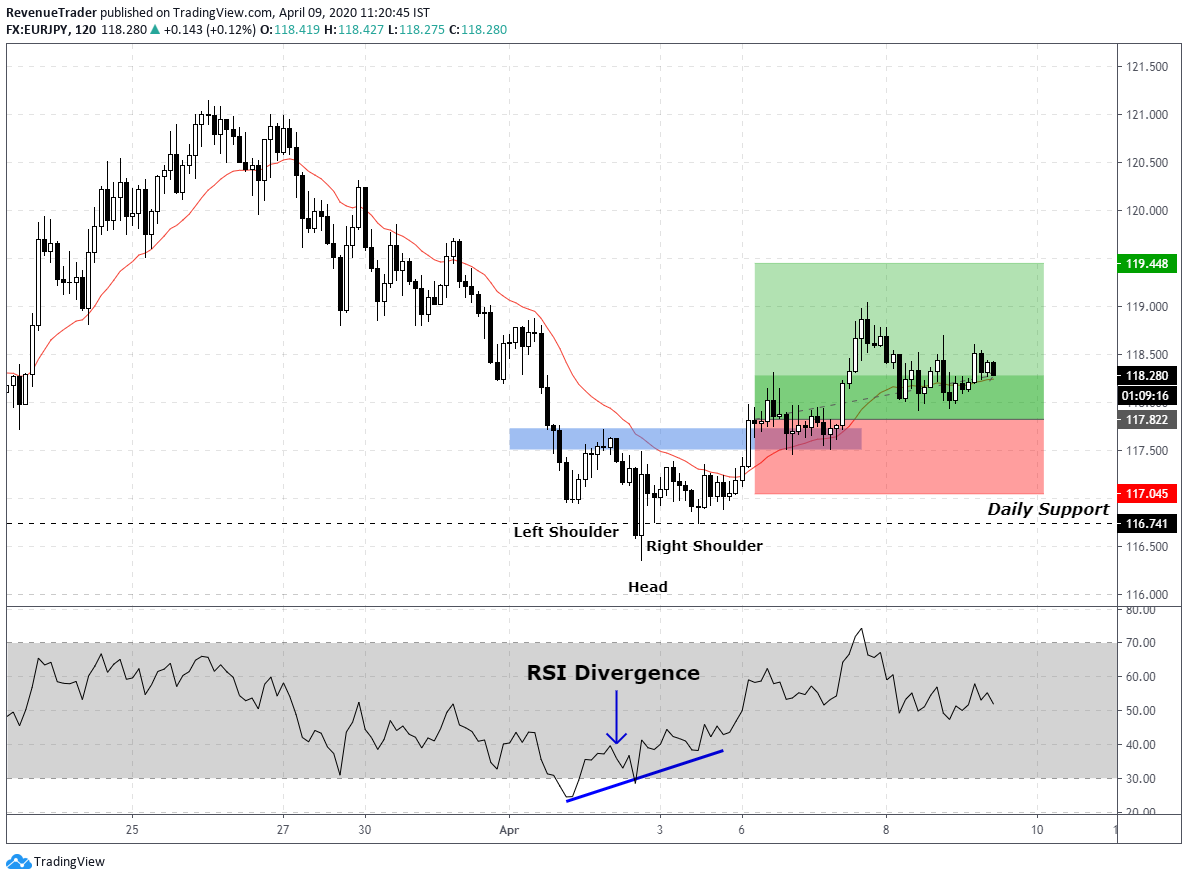
If you look left you can see that the price is in a strong downtrend and at some point, The RSI shows divergence. This is the first clue that indicates the weaknesses of this downtrend.
Then the head and shoulders pattern appears, This confirms the RSI divergence and not only that, all of these trading confluences aligned at a daily support level as well.
So, where is the market right now? It’s going up, right?
See as I said before, The real power behind the RSI divergence can be exposed by combining it with other market confluences.
Okay, so far we talked about – What is RSI indicator, How to use RSI indicator in forex trading, How to use overbought and oversold signals and finally we talked about RSI divergences.
Now It is time to talk about the BONUS trading strategy that we promised you earlier. Okay, let’s dive in.
Forex Trading Strategy – How to Use RSI Divergence to Catch Trend Reversals
The purpose of this trading strategy is to identify and catch trend reversal as early as possible. So that we can have favourable Risk to Reward ratio for our trades.
First of all, we need a favourable market condition, In this case, trending market condition is what we need since we are looking to trade trend reversals. This is the first condition in this trading strategy.
And the next condition is RSI divergence and this indicates the weakness of the ongoing trend.
Okay, after these two conditions are met we can move on to the next step.
So what is it? We have to wait for a momentum shift. A Momentum shift? what is it again?
Assume that we have a strong downtrend, The price keeps on going down strongly but at some point, the price actions start to show sign of weaknesses to go down. This is what Momentum Shift means.
Basically, when downtrend starts to show bullish signs, It indicates bearish to bullish Momentum shift and when uptrend start to show bearish signs, It indicates bullish to bearish Momentum Shift.
But how to confirm the Momentum Shift. This is where reversal chart pattern like Head and Shoulders, Double tops and bottoms and descending and Ascending triangle patterns come into play.
Have a look at the NZDCAD daily forex chart below,
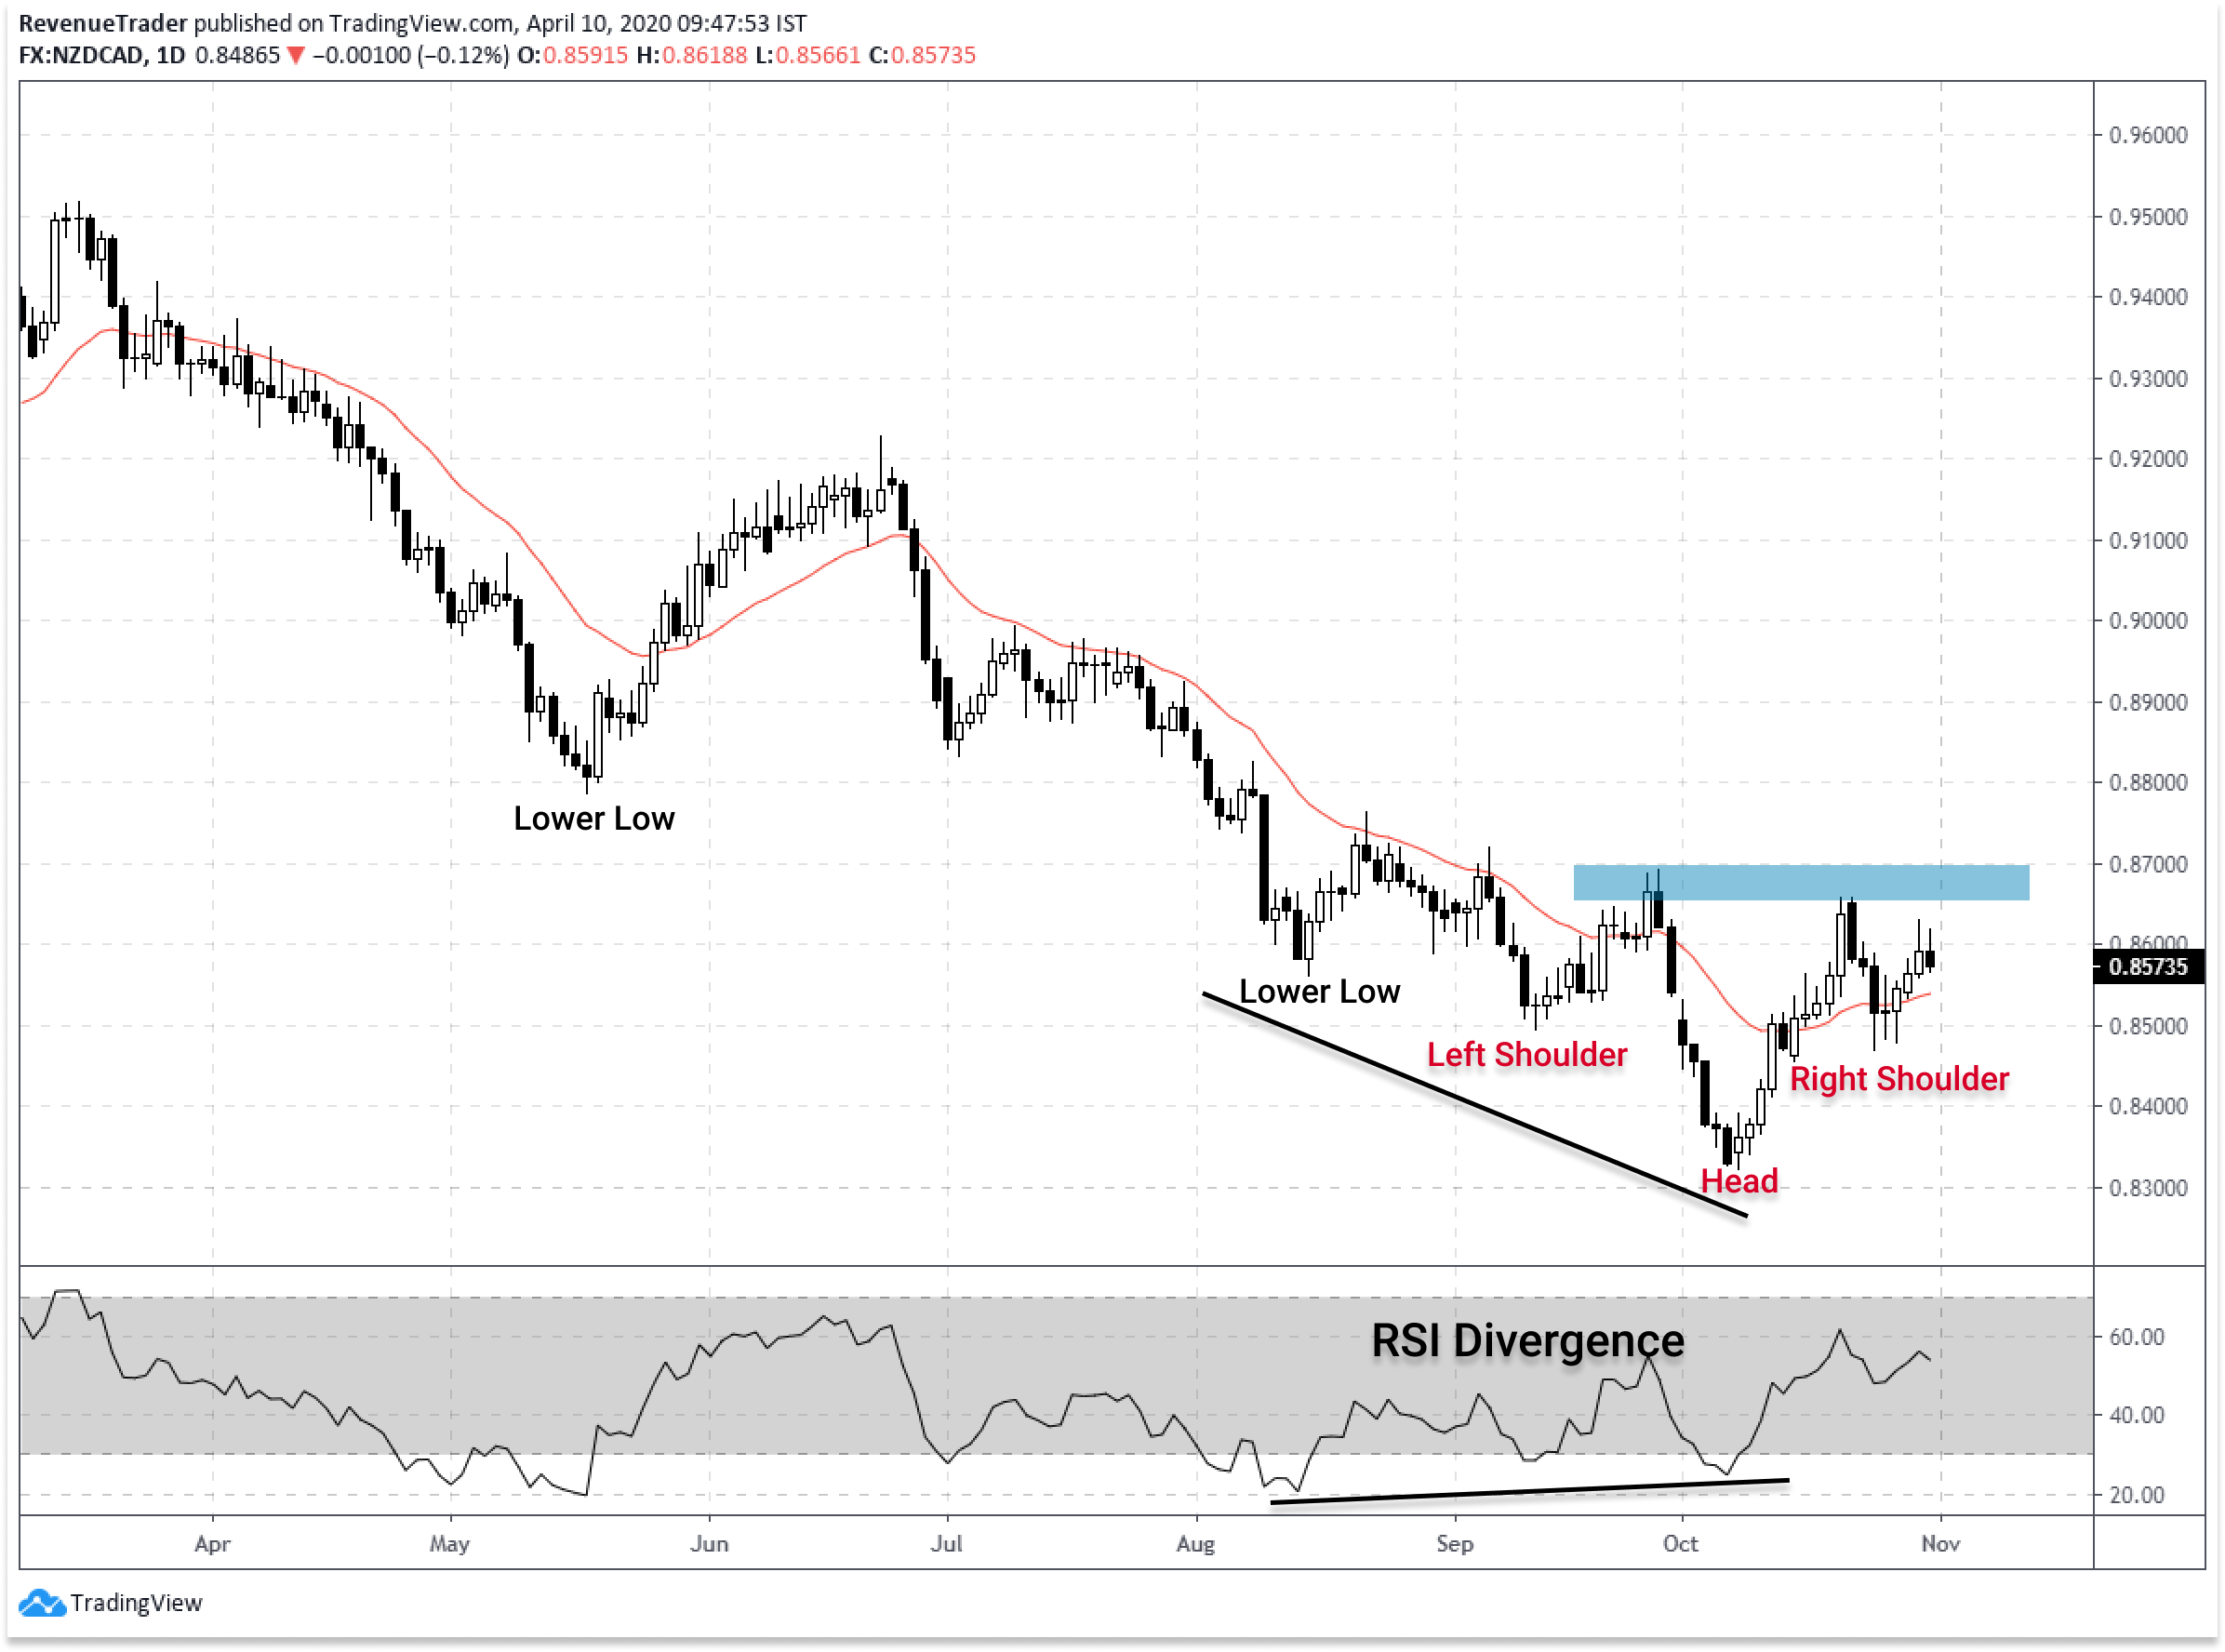
If you look left in the forex chart above, you can see that the market is in a strong downtrend with a series of lower lows and then Suddenly RSI shows a Divergence which indicates lack of bearish momentum.
Right now both the conditions are met – we have downtrend and RSI show divergence.
Next, have a look at the inverse head and shoulders pattern, what that indicates, In this case, it indicates the bullish momentum during the downtrend. This confirms the Momentum Shift.
Now we have all the criteria we need, But how do we pull the trigger? Let’s see.
Have a look at the Blue zone marked in the chart. That is called the neckline. Price break above the neckline is what confirm head and shoulders pattern. So we can simply place a buy order if price broke above neckline. Have a look a the forex chart below,
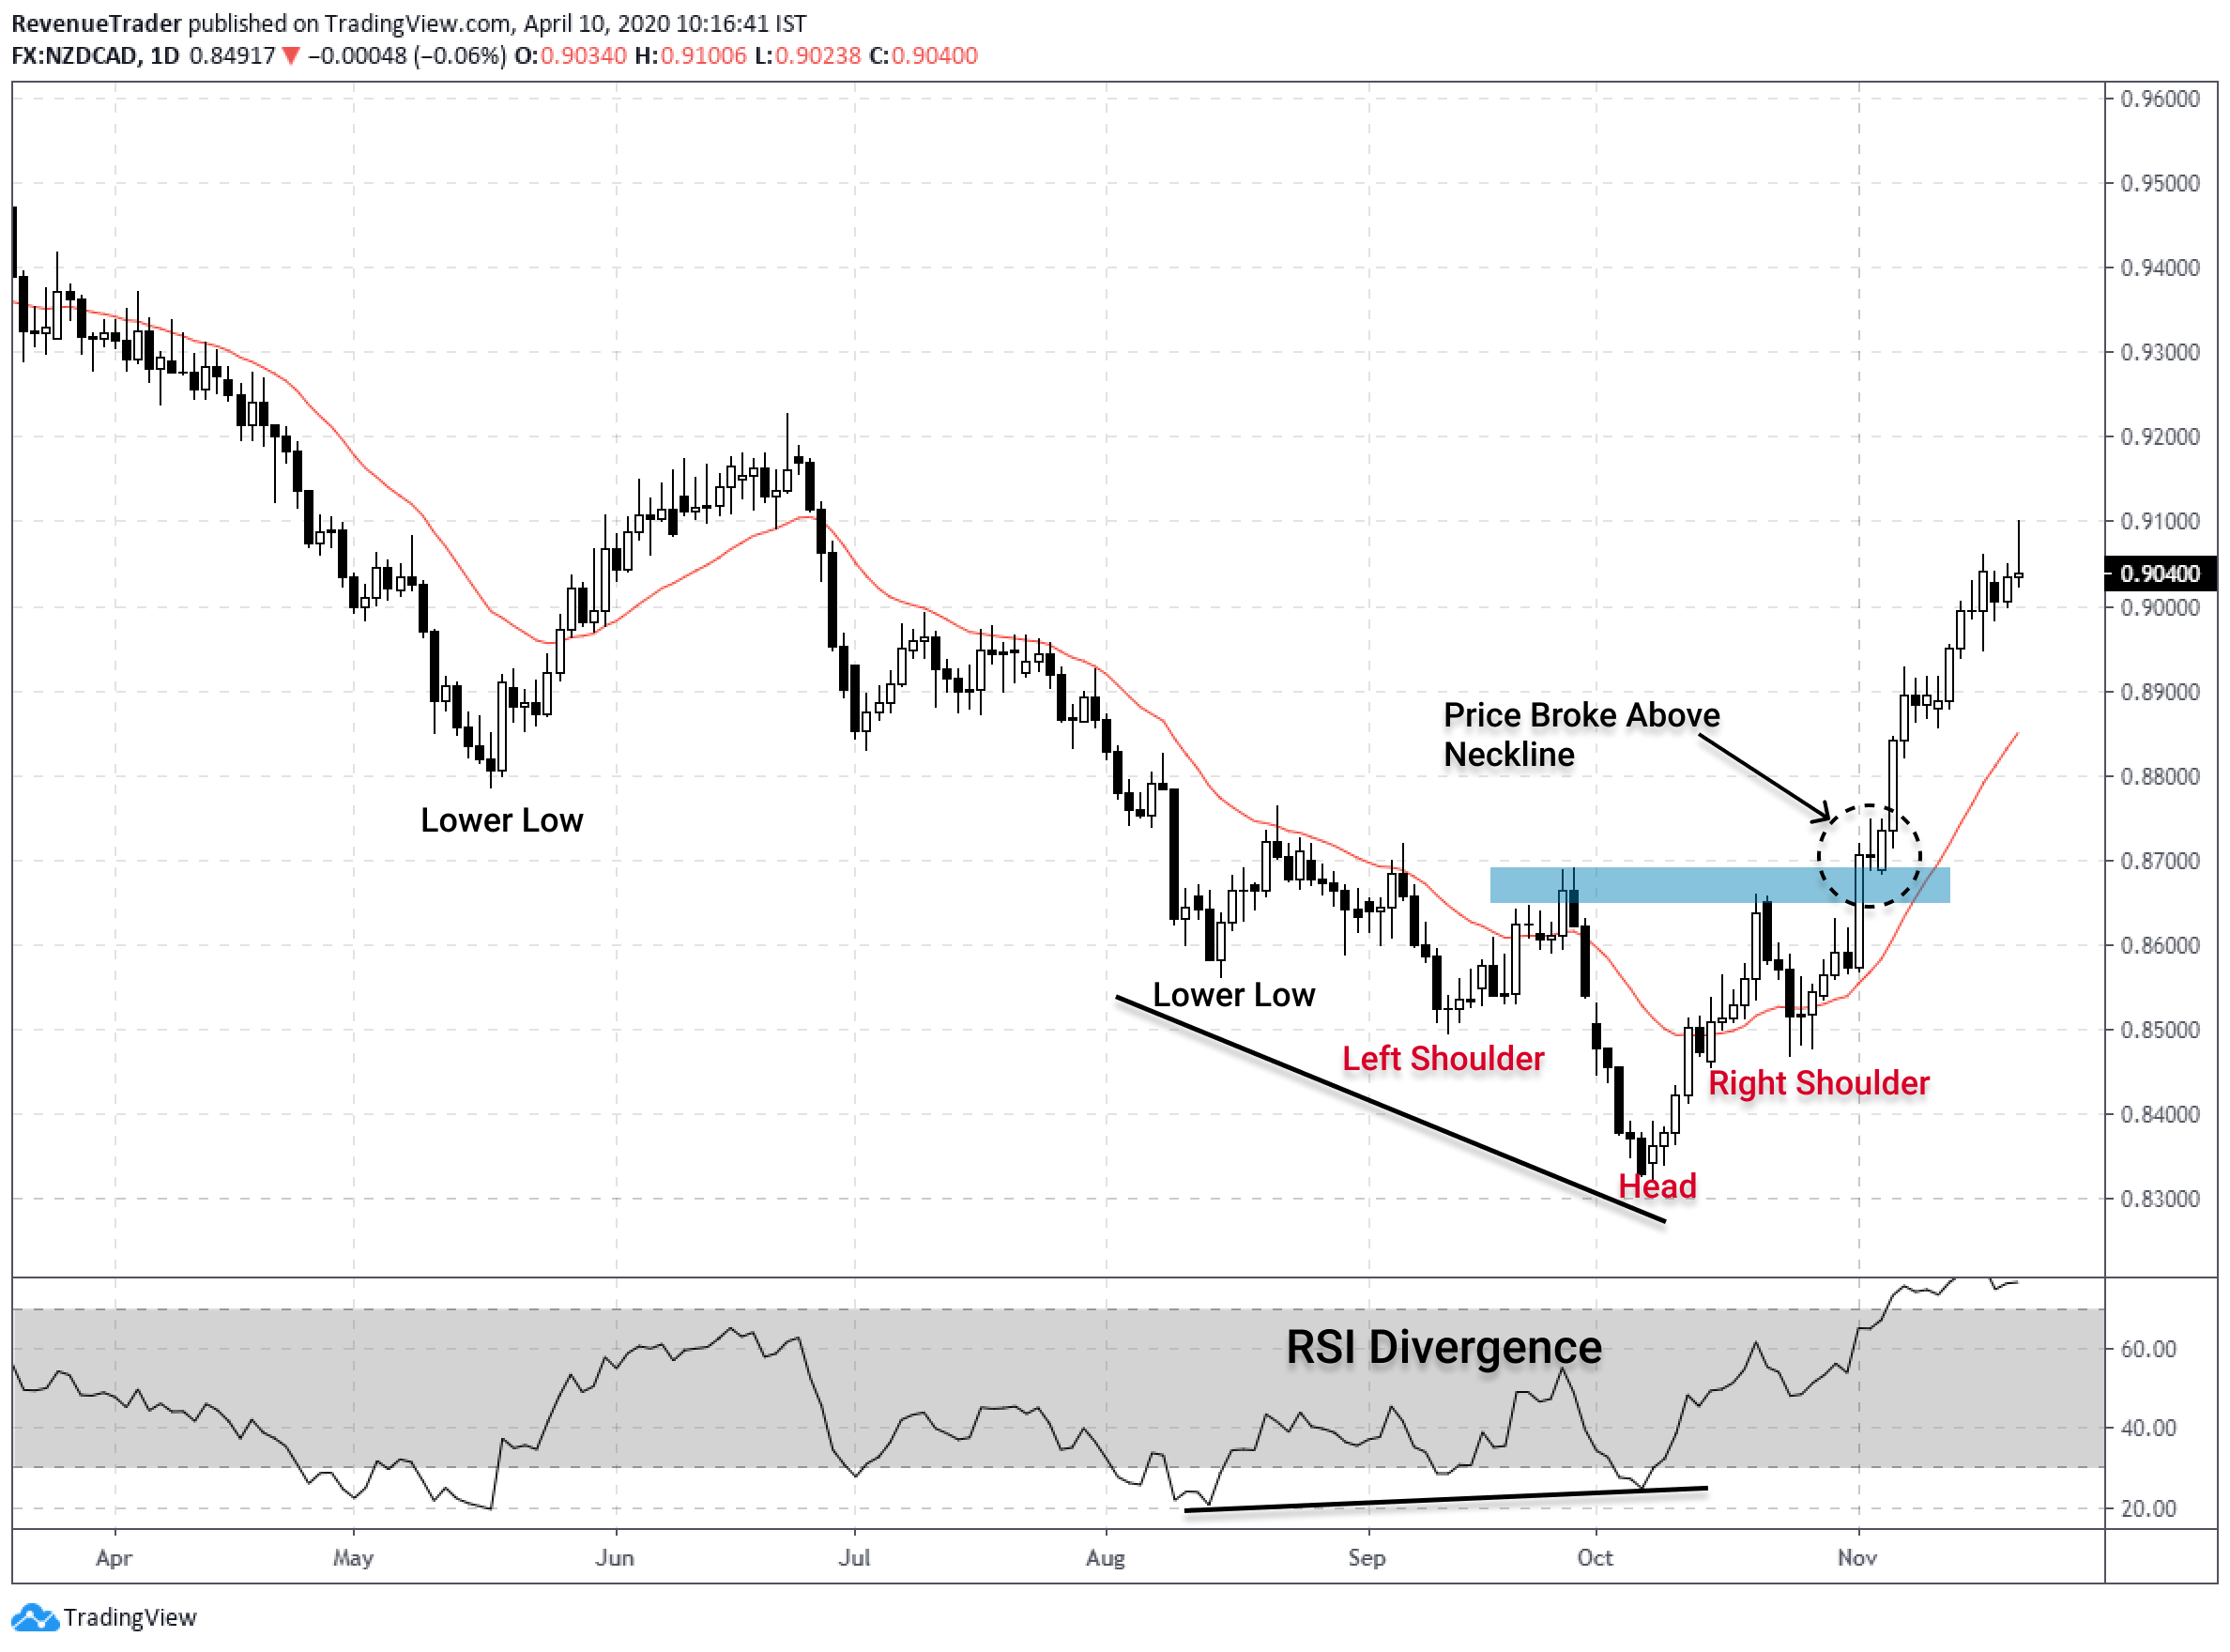
See what happened after the breakout, previous downtrend reverse into a whole new uptrend.
Next, Let’s take another example to clear the things out. Have a look at the forex chart below,
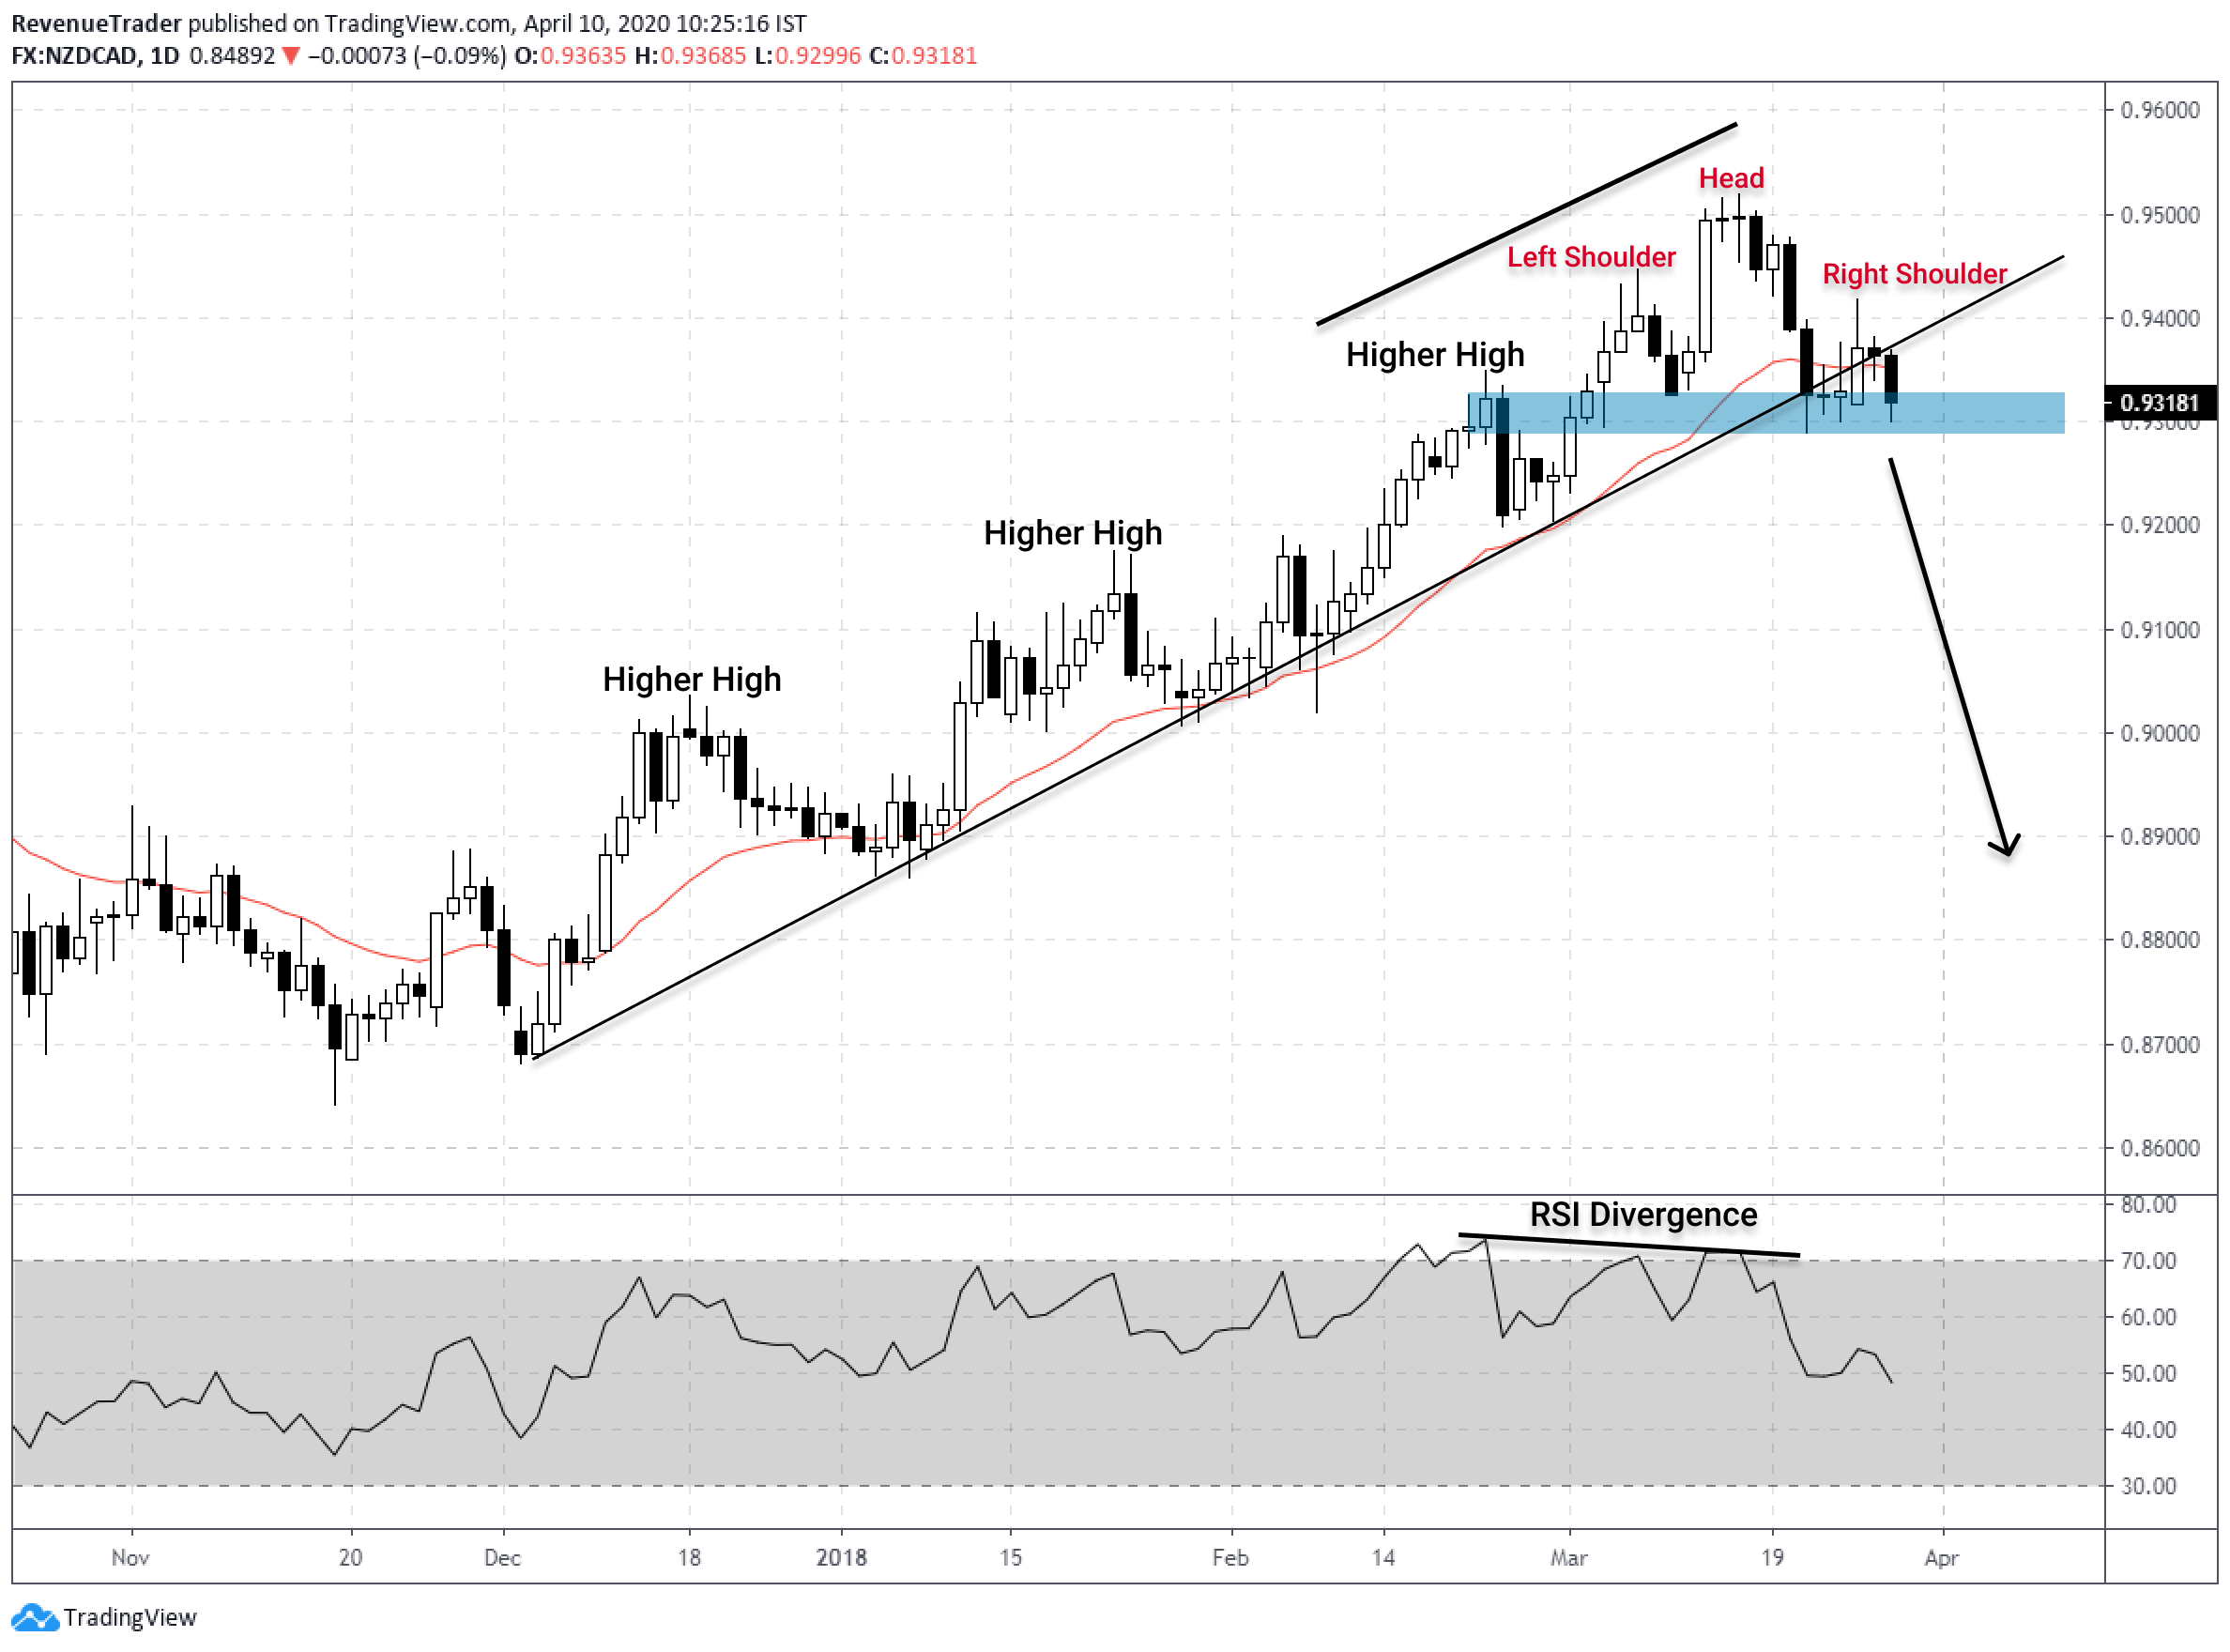
Just like the previous example the same concept apply here but in the opposite direction.
In this case, we have strong uptrend followed by a series of higher highs not only that the price is also respecting uptrend line as well.
But, when the RSI indicator shows divergence, the Uptrend starts to show signs of weaknesses. First, the occurrence of head and shoulders pattern indicate the bearish pressure that builds on this pair and second the break below trend line indicates the same as well.
Now all the conditions and trading confluences are aligned nicely. Now it is a matter of placing the trade.
Just like the previous trade example, we can look for a breakout to time our trade. Have a look at the chart below.
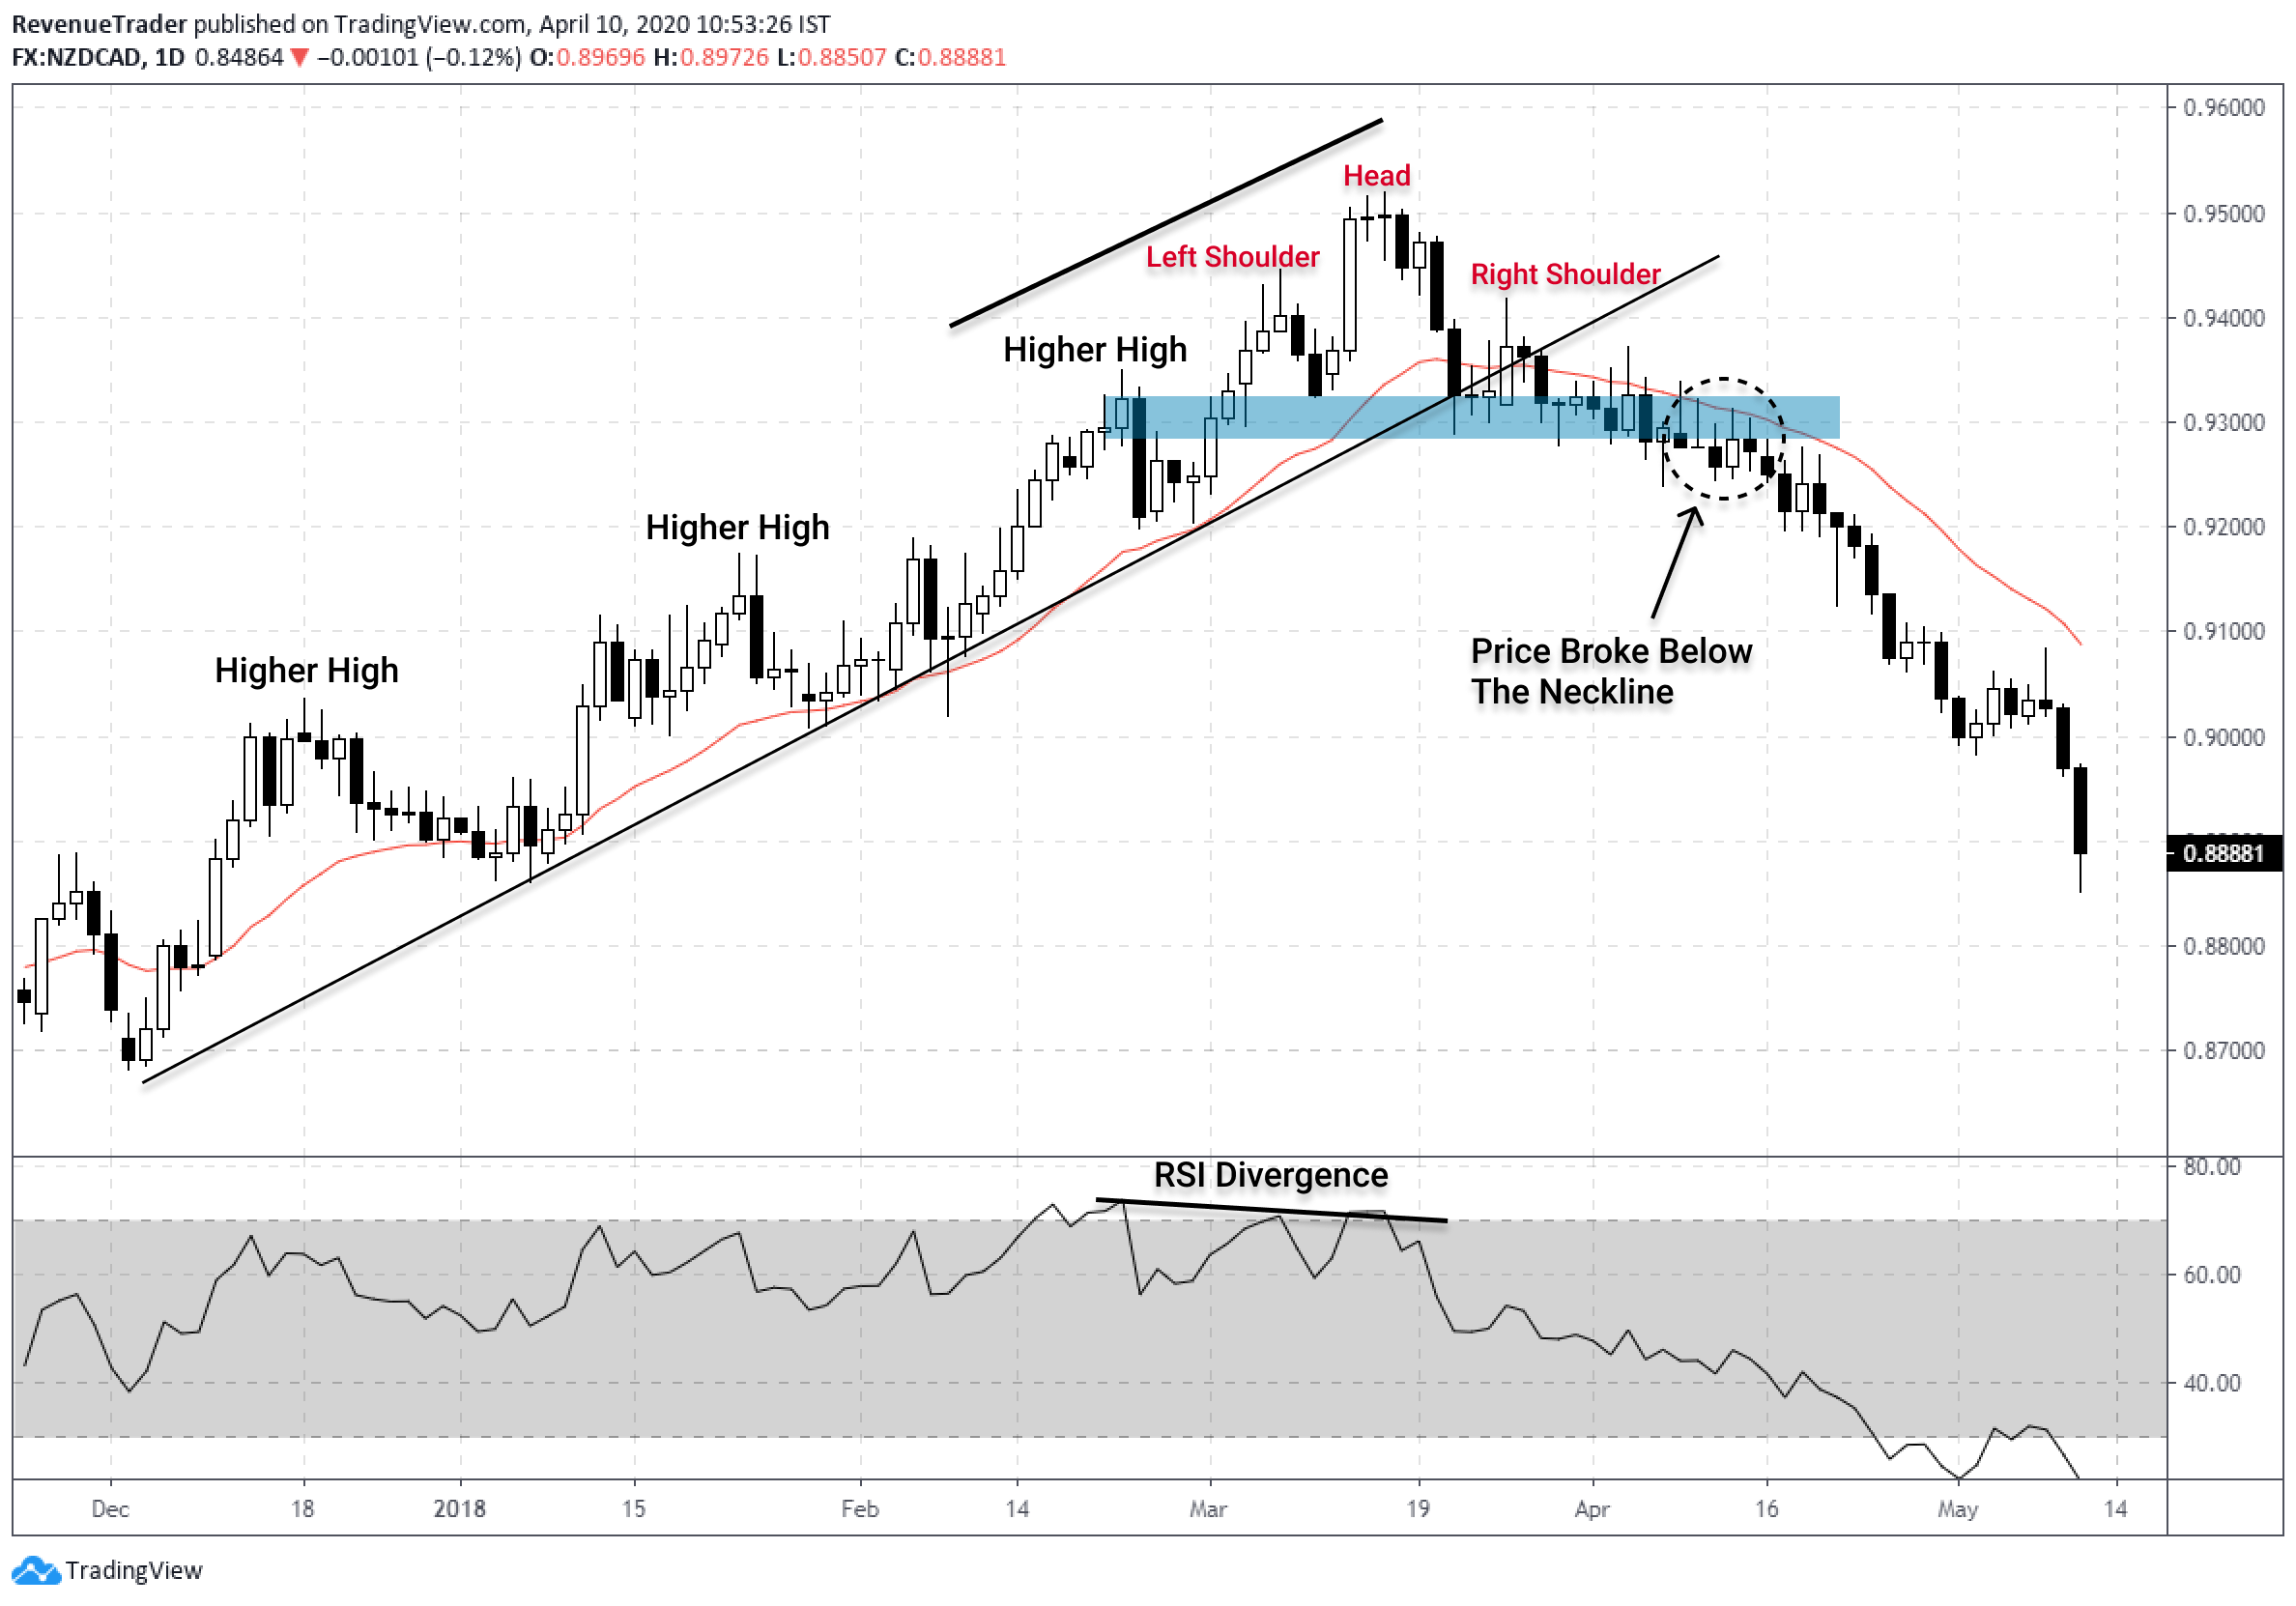
See, what happened after the breakout? The market reverse into a whole new and strong downtrend, right?
Now It is your turn, Open your trading platform and go over a few forex charts and check the stuff we are learned here.
Keep in mind that every trading strategy suffers from losses and trading losses are part of this business. Even this trading strategy also suffer from trading losses and It is up to how you handle them.
So, How to handle trading losses?
As forex traders we don’t have control over the market, right? But there still parts that we can control in trading like Risk Management, How to enter a trade, how to manage trade and how to control your emotional ups and downs.
The point here is, Don’t worry about the things that you don’t have control.
Finally, What you think about the RSI indicator, Do you already using it Or Do planning to add RSI to your trading toolbox?
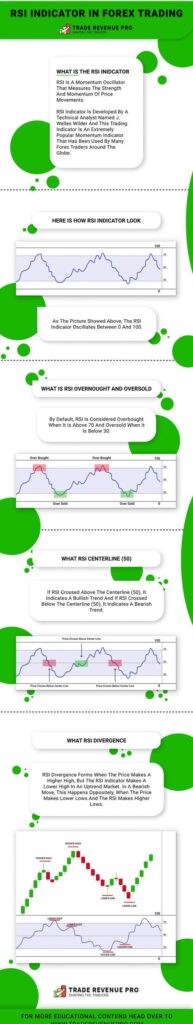
Next Here the Infographic version of this article. Use it as a cheat sheet and make sure to share this awesome infographic with the world.
So finally here is another great video from Rayner Teo explaining the RSI indicator and how to use it.
If you like the trading tip and the trading strategy that we talked in this article, make sure to share it social media and with your friend. That helps us a lot.


3 Responses
Thank you for keeping these articles here to read for free,, God,, bless you,,
Glad you found it helpful, Dodd.
Absolutely helpfull article God bless