It’s Christmas week, finally. I assume there are plenty going on with you and your family in this week. So what are your Christmas plans? Let me know in the comment section.
At the moment, The Market is not equipped with the normal price action movement that we normally get. In fact, we’ve only had one trade in the last week that’s still running.
That’s how the market works, there are a few lucrative weeks or streaks of profitable weeks followed by a few weeks with a low number of trades, and there are some weeks you have to sit in drawdowns for a few weeks. That’s natural in trading as long as you have the skills to complete the trading year in a profitable way.
When times like these occur, the way you manage your trading activities, the way you handle your emotional ups and downs is what determines success as a trader.
With these things in mind, let’s review the CADJPY trade which executed in the last week.
CADJPY Short Trade

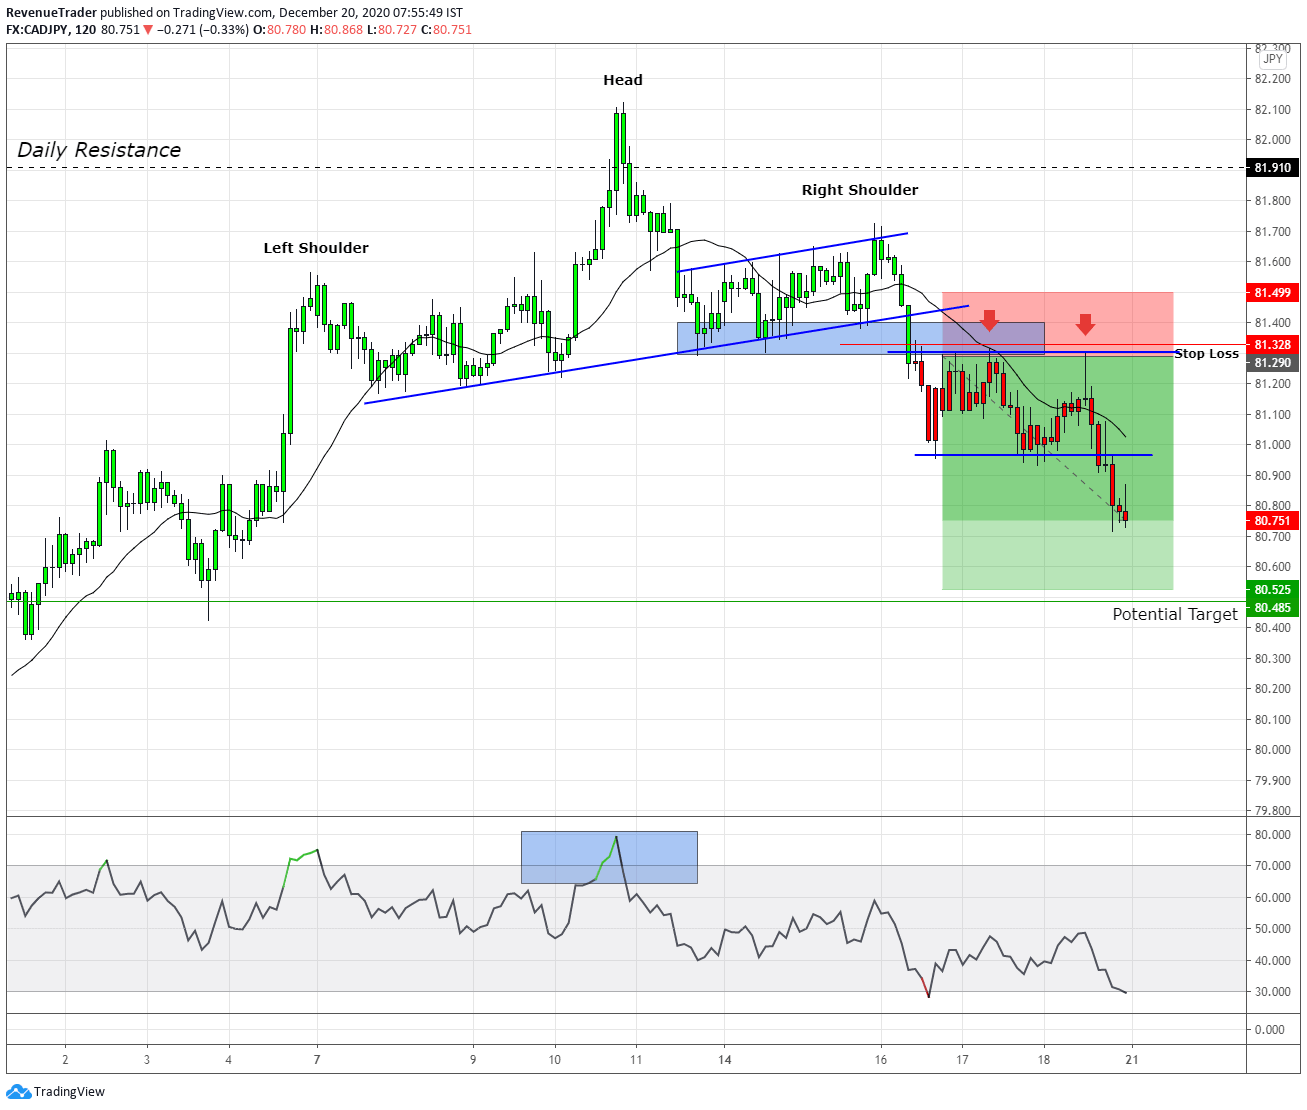
First of all, if you look left, you can see that CADJPY was in a clear uptrend with prices making serious higher highs followed by higher lows. When we consider the trend waves, they are getting bigger and bigger, suggesting a strong bullish momentum. But after the price action has met with daily resistance, the retracement wave is getting stronger, indicating selling pressure.
The next buyers attempted to bounce back, but they ended up failing. The outcome of this behaviour is the head and shoulders pattern which showing the selling pressure. Now at that time, we had enough trading confluence to go short. As the above chart show, we go short as price broke below the local structure level targeting the previous swing low as the take profit.
But as soon as the trade executed, the price action began to move sideways, indicating a lack of selling pressure. If situations like this arise, we have to cut losses, that’s how we protect our trading capital. Now observe the chart above. We moved the stop loss few pips above the range top to cut the loses.
Next look at the second red arrow, where the price action almost hit our stop loss, but because we put the stop loss in a safe position (above the range top) we are still in this trade and the good thing is that this trade has a huge risk-to-reward ratio (3.66R). (3.66R). If this trade hits our profit target, we’ll able to gain 7.31%.
Next, let’s take a look at the trade ideas for the week ahead.
Disclaimer: Trade Revenue Pro’s view on the Forex Charts is not advice or a recommendation to trade or invest, it is only for educational purposes. Don’t Blindly Buy or Sell any Asset, Do your own analysis and be Aware of the Risk.
Keep in mind, These are Just Market Predictions and not a Trade Signal or Trade Ideas, At Trade Revenue Pro We are Using Daily Time Frame to Identify Major Price Movements and Push Down 4-Hour Time Frame to Get Favourable Risk to Reward For Our Trades, Furthermore, We are Using Tight Risk Management Method to Preserve Our Trading capital.
USDCAD – Double Bottom Pattern with Descending Channel

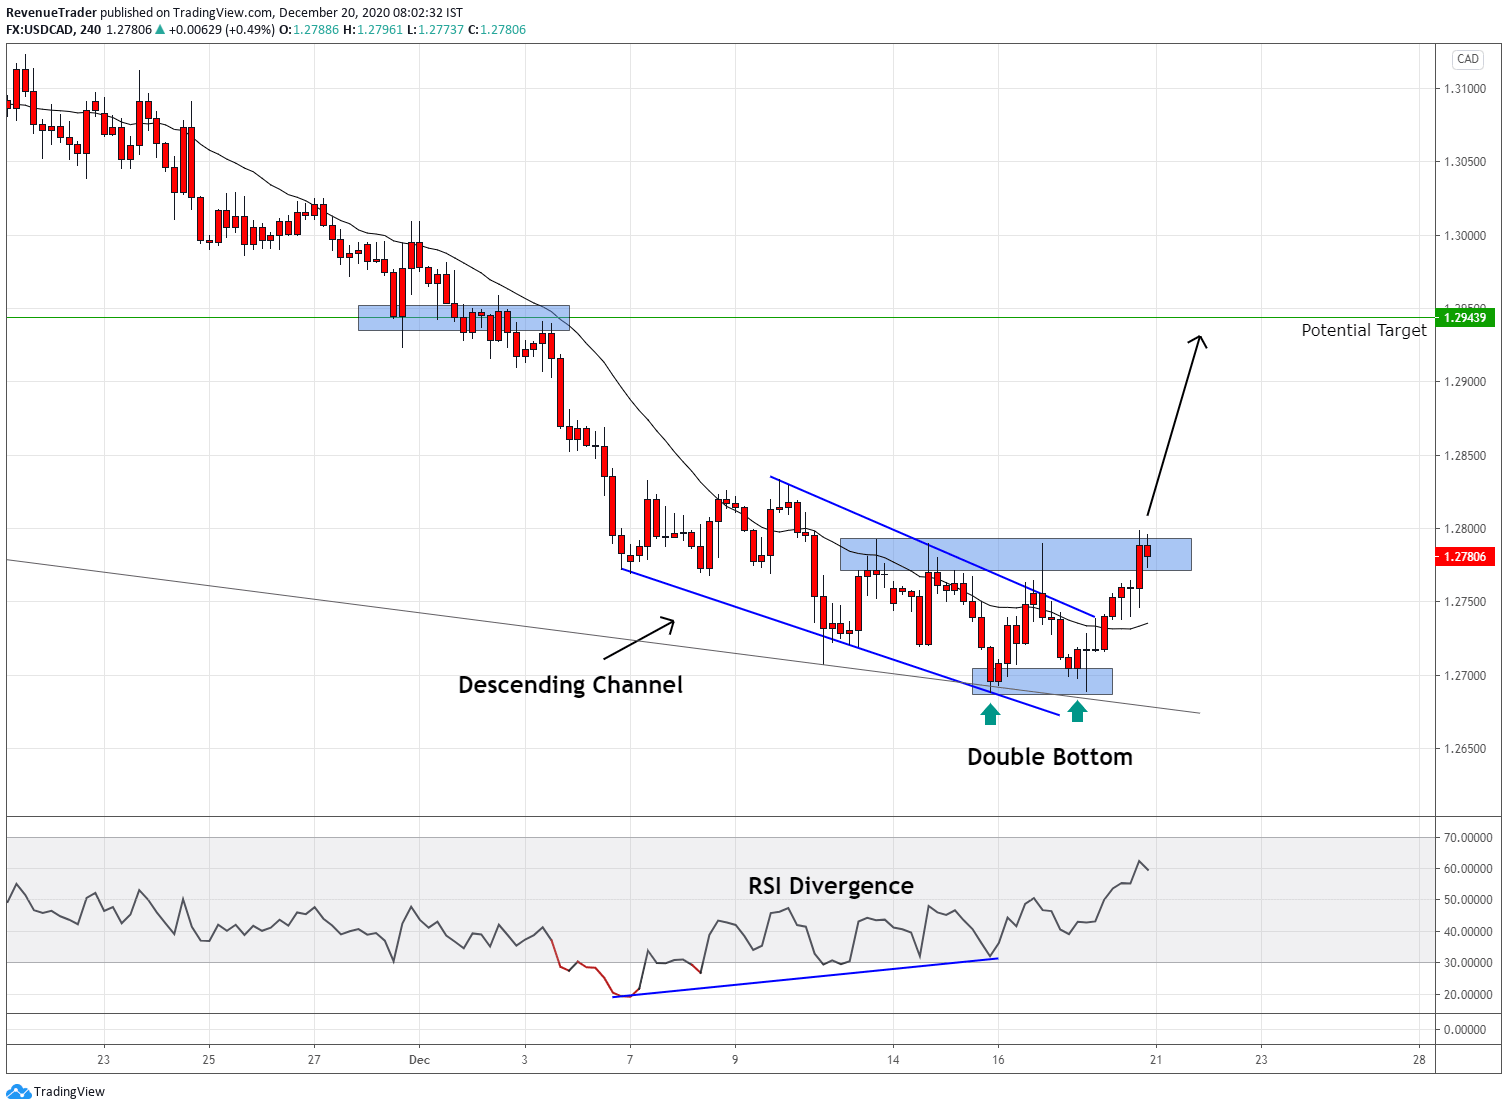
Key Level – At the moment USDCAD is trading at the bottom of the descending triangle pattern come from the daily chart (grey trend line). Note that this level is tested three-time and rejected. This is a good sign.
Descending Channel – Generally, the descending triangle pattern indicates the lack of momentum and also knows for a reversal pattern. The occurrence of this pattern at the end of the trend and bottom descending channel comes from the daily chart indicate the lack of selling pressure.
Double Bottom Pattern – Along withe descending channel, the double bottom also confirm the idea of a trend reversal.
RSI Divergence – RSI usually measure the momentum. At the moment price action and the RSI indicator are out of the sync resulting in RSI divergence which indicates the lack of bearish momentum.
Market Forecast – Although price broke and close above the descending channel, the price action is still trading below the local structure level. Which mean, from a technical perspective, this downtrend is still valid. Only a break above the local structure level is what confirms the trend reversal.
Trade Idea – We will consider going long if price break and closed above the local structure level by targeting 1.29439 which is previous structure level.
AUDNZD – Ascending Channel at the Daily Resistance Level

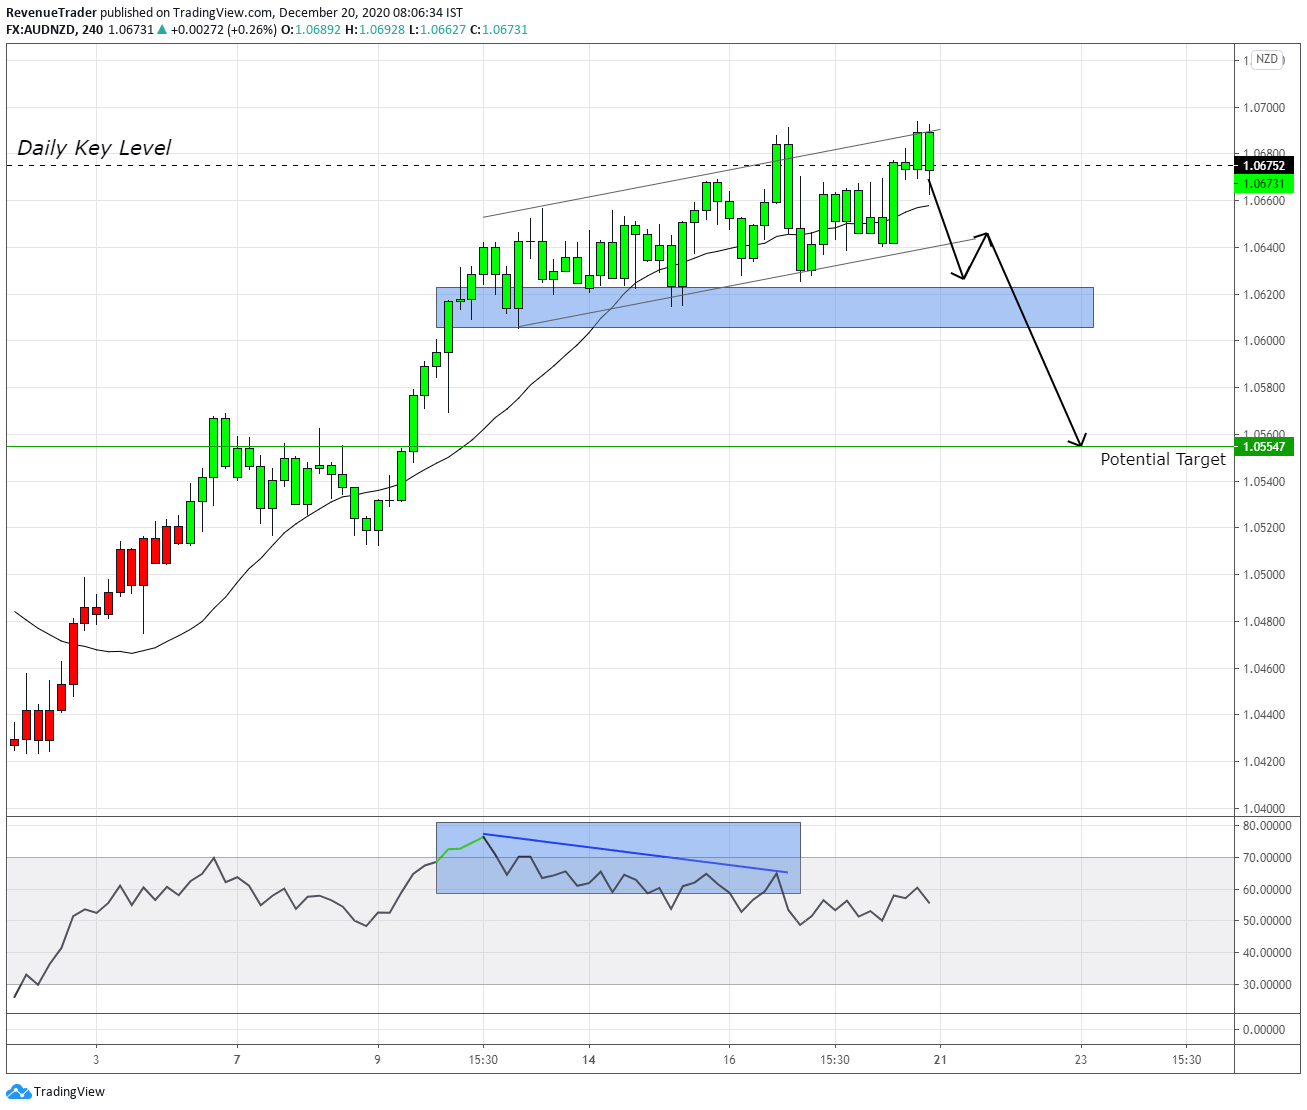
Key Level – A strong bullish trend is losing its momentum as price action met with the daily resistance level at 1.06752 which comes from the daily chart.
Ascending Channel – This pattern is known as a reversal chart pattern. Hence the occurrence of this pattern at the top of the trend and daily resistance level is significant here.
RSI Divergence – The divergence in the RSI indicator also confirms the lack of bullish momentum.
Market Forecast – All of the trading confluences above indicate the signs of reversals. But the technically this trend still has some bullish potential. Only a break below the local structure level is what confirms the trend reversal here.
Trade Idea – We will consider going short if price breaks below the local structure level to the downside. If that happens we will consider going short by targeting 1.05547 structure level.
Finally, Besides these trade ideas, Do you have any trade on your radar? Let us know in the comment section.
Head over to Trade Revenue Pro Trading Blog to learn more about how to trade forex with Proven Trading Techniques and Strategies.
Want more Trade Ideas – Head over to Trade Idea Page.
That is all for this week and If you want constant trade updates – consider following Trade Revenue Por on Tradingview.
Also, consider following us on social media and Pinterest, Instagram and Facebook.


