
Introduction
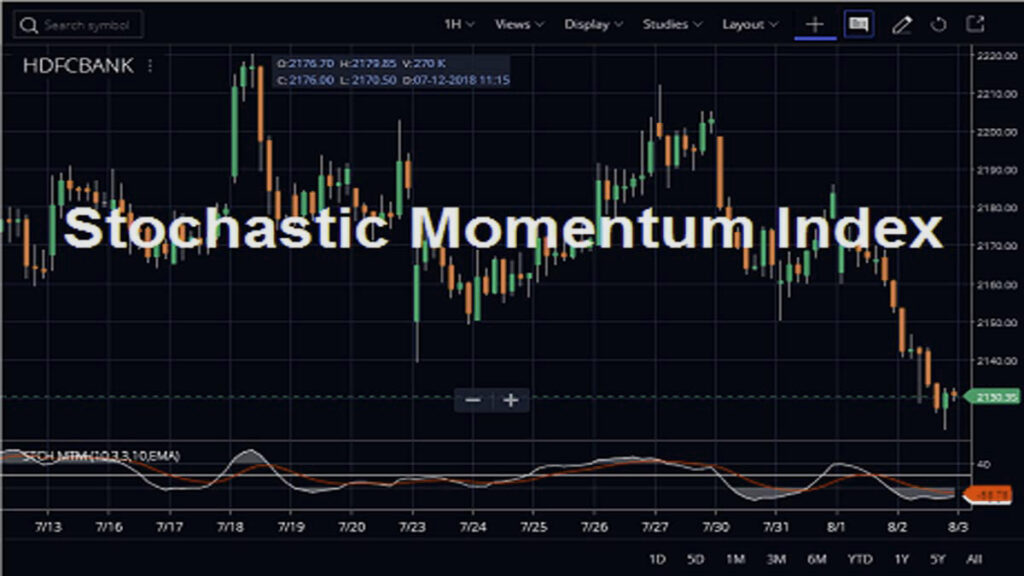
The Stochastic Momentum Index (SMI) is a tool used in technical analysis. Its job? Measuring a security’s price momentum compared to its middle price range over a set time. William Blau created the SMI in 1993. It’s a better version of the usual stochastic oscillator. Its design aims to deliver more dependable and less false signals. The SMI is a valuable tool for traders and investors who want to identify potential reversals in a security’s price trend.
Understanding Stochastic Momentum Index
Stochastic Oscillator vs. Stochastic Momentum Index
The SMI differs from the standard stochastic oscillator in two key aspects:
• Median Price Range: The SMI uses the median instead of the low price as the reference point for the price range calculation. This makes the SMI less sensitive to extreme price swings and more focused on the overall trend.
• Smoothing: The SMI incorporates a smoothing mechanism to reduce noise and false signals. This is achieved by applying a moving average to the SMI values.
Historical Background and Development
The SMI was introduced by William Blau in his 1993 article “The Stochastic Momentum Index” published in the Technical Analysis of Stocks & Commodities magazine. Blau recognized the limitations of the standard stochastic oscillator and sought to develop a more refined indicator that could provide more reliable signals.
Stochastic Momentum Index Calculation
Formula and Mathematical Components
The Stochastic Momentum Index is calculated using the following formula: SMI(K, N) = 100 * ((C – MDN) / (MH – ML)) Where:
• K: Smoothing factor, typically 3
• N: Number of periods, typically 14
• C: Current closing price
• MDN: Median price of the previous N periods
• MH: Maximum price of the previous N periods
• ML: Minimum price of the previous N periods
Interpreting the SMI Values
The Stochastic Momentum Index values oscillate between -100 and +100. An SMI value above 80 indicates that the price is relatively high within the recent trading range, suggesting overbought conditions. Conversely, an SMI value below 20 indicates that the price is relatively low within the recent trading range, suggesting oversold conditions.
Setting Up SMI for Optimal Performance Best Settings for Stochastic Momentum Index
The most commonly used settings for the SMI are: • K: 3 • N: 14 These settings provide a balance between responsiveness and stability, making them suitable for most trading applications.
Customizing SMI Parameters for Intraday Trading
For intraday trading, traders may want to use a shorter period (e.g., N = 5) to capture more frequent price changes. However, this may also increase the sensitivity to false signals.
How to Read Stochastic Momentum Index
Interpretation of Overbought and Oversold Levels
Stochastic Momentum Index values above 80 suggest that the security is overbought, indicating that a price correction may be imminent. Conversely, SMI values below 20 suggest that the security is oversold, indicating that a price rebound may be likely.
Analyzing Trend Reversals and Momentum Shifts
Divergences between the Stochastic Momentum Index and the security’s price action can signal potential trend reversals. For instance, if the security’s price makes a new high but the SMI fails to make a corresponding new high, it suggests that the upward momentum may be weakening and a trend reversal may be possible.
Practical Applications of Stochastic Momentum Index
Using SMI as a Trading Signal
Traders can use Stochastic Momentum Index signals to enter or exit positions. For example, a trader may buy a security when the SMI crosses above 20 (oversold signal) and sell a security when the SMI crosses below 80 (overbought signal).
Combining SMI with Other Technical Indicators
Stochastic Momentum Index can be used in conjunction with other technical indicators to enhance trading strategies. For instance, traders can combine SMI with moving averages or price patterns to identify more precise entry and exit points.
Fine-Tuning Your SMI Strategy
Experimenting with Different Settings
Traders should experiment with different SMI settings to find what works best for their trading style and the specific security they are trading.
Incorporating Risk Management
Traders should always use risk management techniques when implementing any trading strategy, including those based on SMI signals. This may include using stop-loss orders, position sizing, and diversification.
The Mathematics Behind SMI
In-Depth Look at the SMI Formula
In the realm of financial analysis, there exists a powerful tool known as the Stochastic Momentum Index (SMI). Its calculation follows a precise and methodical formula, SMI (K, N) = 100 * ((C – MDN) / (MH – ML)) Where:
• K: Smoothing factor, typically 3
• N: Number of periods, typically 14
• C: Current closing price
• MDN: Median price of the previous N periods
• MH: Maximum price of the previous N periods • ML: Minimum price of the previous N periods
Breakdown of the Formula:
Median Price Range (MDN): The median price is calculated by arranging the closing prices of the previous N periods in ascending order and selecting the middle value. This eliminates the influence of extreme price swings and provides a more stable reference point for the SMI calculation. Price Range (MH – ML): The price range is calculated by subtracting the minimum closing price from the maximum closing price of the previous N periods.
This represents the overall range of price movement during the specified period. Relative Distance (C – MDN): The relative distance is calculated by subtracting the median price (MDN) from the current closing price (C). This represents the position of the current closing price within the recent trading range. Normalization (100 *): The result of the relative distance is multiplied by 100 to normalize the SMI values between 0 and 100. This makes the SMI easier to interpret and compare across different securities.
Calculating SMI in Microsoft Excel
To calculate the SMI in Microsoft Excel, you can follow these steps:
• Enter the closing prices of the security for the previous N periods into a spreadsheet.
• Calculate the median price (MDN) of the previous N periods using the MEDIAN function.
• Calculate the maximum price (MH) and minimum price (ML) of the previous N periods using the MAX and MIN functions, respectively.
• Figure out the relative distance (C – MDN). You do this by taking the current closing price (C) and subtracting the median price (MDN).
• Find the price range (MH – ML). This is done by taking the maximum price (MH) and subtracting the minimum price (ML).
• Work out the standardized SMI value (SMI) with this calculation: SMI = 100 * ((C – MDN) / (MH – ML)) Enter this formula into the spreadsheet cell where you want the SMI value to appear. By following these steps, you can manually calculate the SMI for any security using Microsoft Excel. However, most charting platforms and technical analysis software provide built-in SMI indicators that automatically calculate and display the SMI values for you.
SMI Indicator Variations
Stochastic Momentum Index Indicator Explained
Let’s talk about the Stochastic Momentum Index, or SMI! This technical tool helps track the speed of a security’s price compared to its middle price range over a certain time. Think of it like a better version of the normal stochastic oscillator, giving more trust-worthy results and less false alerts. SMI values flip between -100 and +100. Now, if the SMI goes over 80, it means the price is pretty high compared to recent trades, hinting at overbought conditions. On the flip side, if it’s under 20, the price is lower than normal. This might suggest oversold situations.
SMI Indicator for MetaTrader 4 (MT4)
MetaTrader 4 (MT4) is liked by many for trading. It lets traders use lots of technical indicators, one being the SMI. Adding the SMI indicator to MT4 charts is simple; just drag and drop from the “Indicators” window to your chosen chart. You can personalize the SMI by right-clicking on it and picking “Properties”.
Trading Platforms and SMI
Utilizing SMI on MetaTrader 4 (MT4)
MetaTrader 4 (MT4) is a popular trading platform that allows traders to use a wide range of technical indicators, including the SMI. You can simply include the SMI indicator on MT4 charts. How? Just click and drag it from the “Indicators” window to your chosen chart. Then hover your mouse over the SMI indicator, right-click, and pick “Properties”. This lets you adjust the SMI to your preferences.
SMI Settings for Thinkorswim
Thinkorswim is another popular trading platform that allows traders to use the SMI indicator. You can include the Stochastic Momentum Index marker in your Thinkorswim charts. Simply choose “Studies” from the top menu bar and look for “SMI.” Next, you can modify the SMI settings to fit your needs. This is done by clicking the “Edit” button next to the indicator.
SMI Indicator on TradingView
TradingView is a web-based charting platform that allows traders to use a wide range of technical indicators, including the SMI. The SMI indicator can be added to TradingView charts by searching for “SMI” in the indicator library. Traders can then customize the SMI settings by clicking on the “Settings” button next to the indicator.
Using SMI with NinjaTrader
NinjaTrader is a futures trading platform that allows traders to use a wide range of technical indicators, including the Stochastic Momentum Index. The SMI indicator can be added to NinjaTrader charts by dragging and dropping it from the “Indicators” library to the desired chart. Traders can then customize the SMI settings by right-clicking on the indicator and selecting “Properties”.
Building a Profitable SMI Strategy H3 Developing a Stochastic Momentum Index Strategy
Developing a profitable SMI strategy involves identifying specific market conditions or patterns that tend to produce favorable outcomes when using SMI signals. This may require backtesting different SMI strategies on historical data to determine their effectiveness.
Real-World Examples of SMI Trading Strategies
One common SMI trading strategy is to buy a security when the SMI crosses above 20 (oversold signal) and sell a security when the SMI crosses below 80 (overbought signal). Another strategy is to look for divergences between the SMI and the security’s price action to signal potential trend reversals.
Exploring SMI Resources
SMI Wiki and Online Documentation
Many web tools exist to learn about the SMI, such as wiki articles, blogs, and guides. These tools give a full grasp of the indicator’s computation, explanation, and uses.
Books and Publications on Stochastic Momentum Index
Several books and publications dedicated to technical analysis discuss the SMI in detail. These resources can provide in-depth insights into the indicator’s development, theoretical underpinnings, and practical trading applications.
Frequently Asked Questions (FAQs)
What is the Stochastic Momentum Index used for?
The Stochastic Momentum Index (SMI) gauges a stock’s speed compared to its average price range for a set timeframe. This handy tool in technical analysis helps investors to spot potential shifts in trends, excessively high or low prices, and differences between price and momentum.
Can SMI be applied to different trading styles?
Yes, the SMI can be applied to different trading styles, including day trading, swing trading, and position trading. The specific settings and interpretation of SMI signals may vary depending on the trading style and the trader’s risk tolerance.
How often should SMI settings be adjusted?
The optimal SMI settings may vary depending on the market conditions and the security being traded. Traders should periodically review their SMI settings and adjust them as needed to maintain their effectiveness.
What is the significance of divergences in SMI?
Divergences between the SMI and the security’s price action can signal potential trend reverse.


