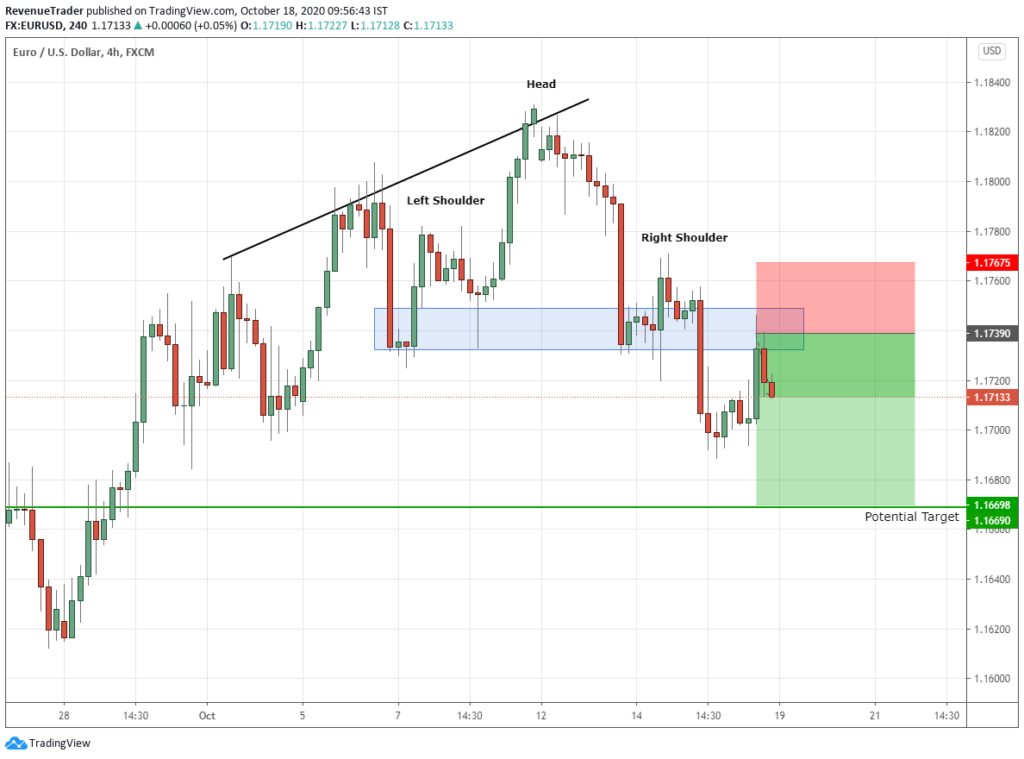
Key Levels – 1.71400 is good level look for break and retest pattern. As already showed in the above chart price tested 1.71400 zone just with a wick.
Head and Shoulder Pattern – The Head and Shoulder pattern indicate the lack of buying pressure in the above short-term uptrend.
RSI Indicator – RSI indicator showed over-bought signal where the head of the head and shoulder’s formed.
Market Forecast – It is clear that all the market confluences indicate the lack of buying pressure when considering the above trading factors and as buyers struggle to move the price higher sellers suddenly broke below the 1.71400 support zone which served as the head and shoulders pattern neckline. We may expect a bearish movement all the way down to the marked target area, which is level 1.6690, if price re-tests the broken level successfully.


