With 6.2R profit in the last week, we complete the second profitable week in a row and It’s nice to see the market behave in our favour in December.
How’s your first week of December been so far? Let me know in the comment section.
We completed the first week of December with 6.2R profit with 4 closed trades and one active trade. If you’ve been following Trade Revenue Pro for a while then you’re probably curious about how we make money consistently on a monthly basis?
If so, this is the answer – We are not perfecting our trade ideas, we just react with a management plan in mind. This allows us to increase the trade frequency while protecting the trading capital.
Okay with this little piece of advice mind, let’s look at the trades that help us gain 6.2R in the last week.
EURJPY Short Trade
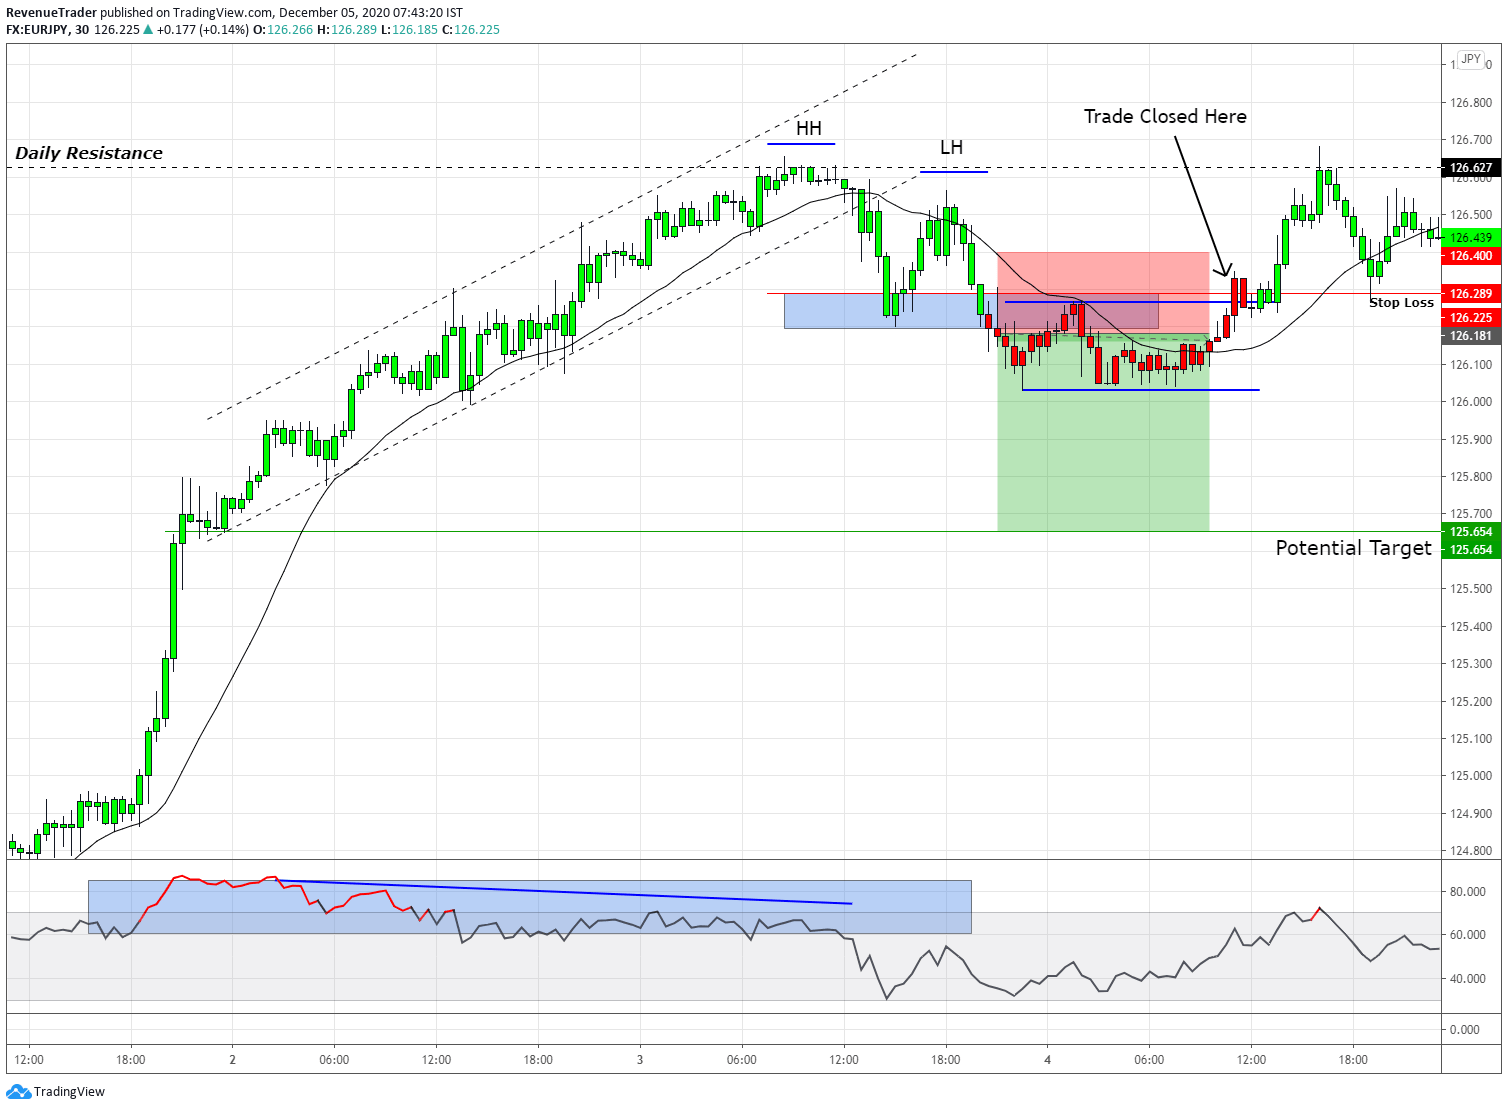
You can see at a glance, that this is a losing trade. But thankfully, we were able to cut the loss by half. Okay, let’s forget about the part that this is a losing trade and instead have a look at the trade setup.
First of all, look at the left side of the market, it was in a strong uptrend, but the price began to slow down as it started to form a bullish channel. This was our sign that telling buyers were losing control of the market.
Next, after the price approached the daily resistance, Price started to form Lower High, indicating the change in the trend structure and with that change in the price behaviour, EURJPY ended up closing below the local structure level, which is the trigger for our entry.
At the time of trade entry, Price began to consolidate, and this is where we moved our stop loss to -0.5R to protect our trading capital (see the chart above) and as predicted, instead of the price dropping, the price began to rise again and hit our stop loss for -0.5R loss.
This trade is an excellent demonstration of risk management and trade management.
AUDNZD Long Trade
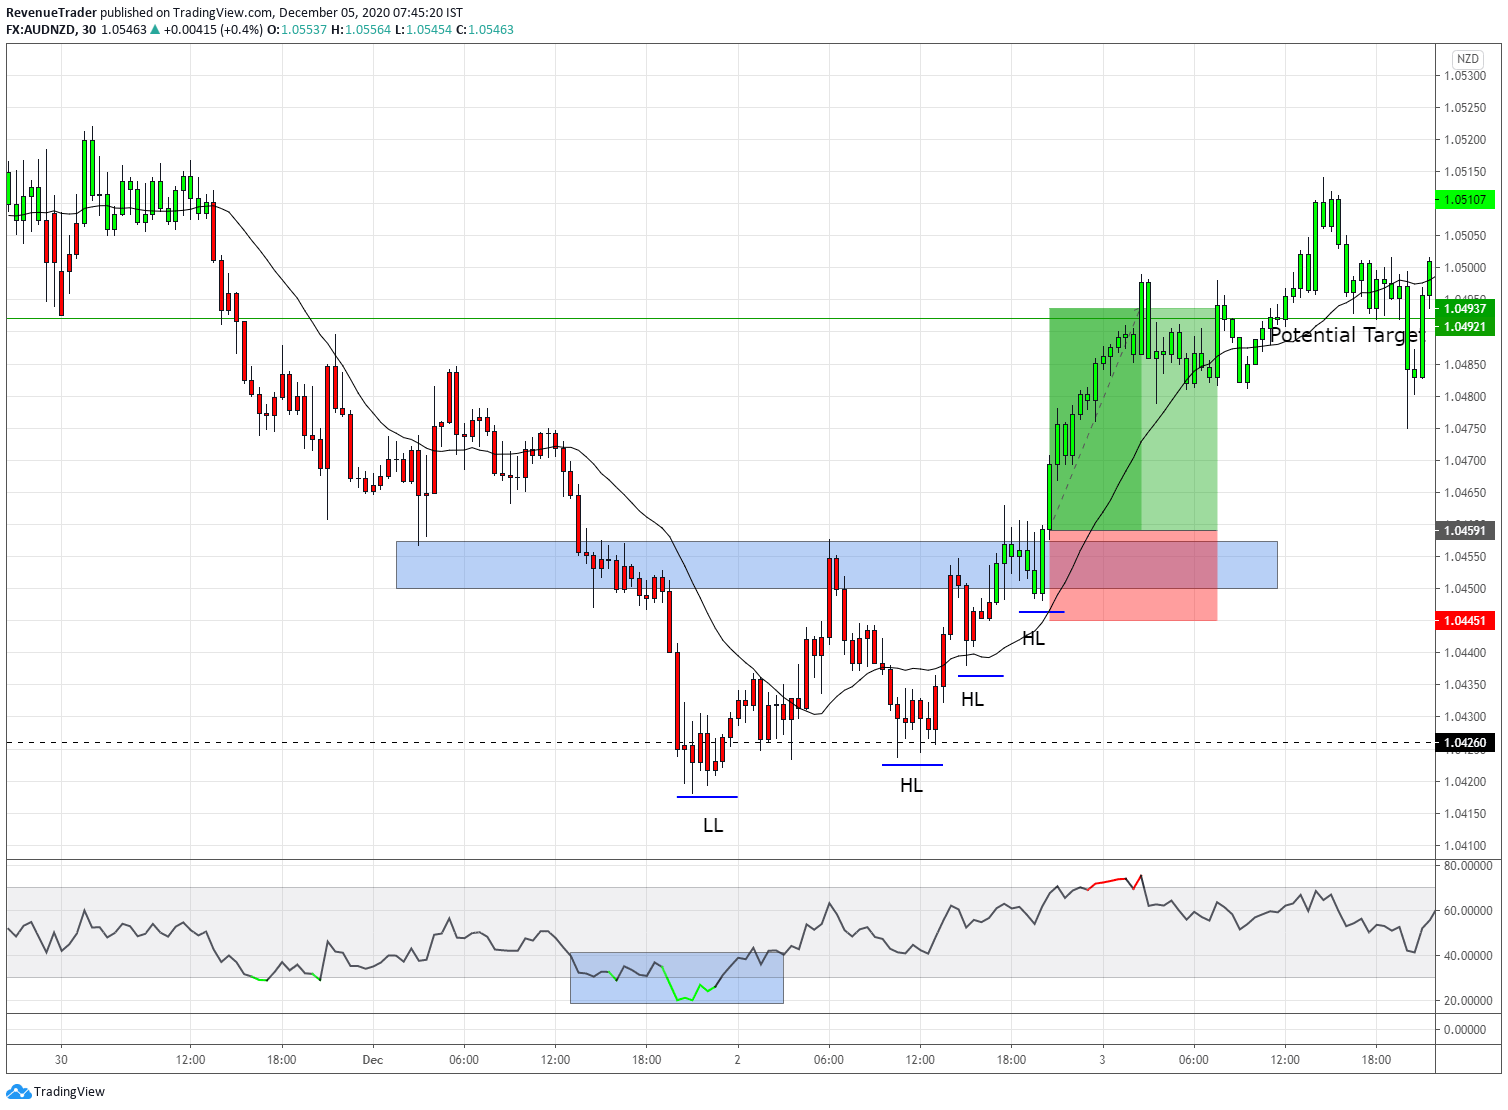
This is our first profitable trade of the week. Now, look at the left side of the market? It was in a deep downtrend, wasn’t it? Not for a long time, however. Sellers have begun to lose control as the price approach to the support level comes from the daily chart and have a look at the HL marked in the chart, indicating the buying pressure builds on this pair.
And as we predicted, the price ended up breaking above the local structure level, which leads us to open up a long position and as you guys can see, we’ve easily banked 2.7R profit on this trade.
EURNZD Long Trade
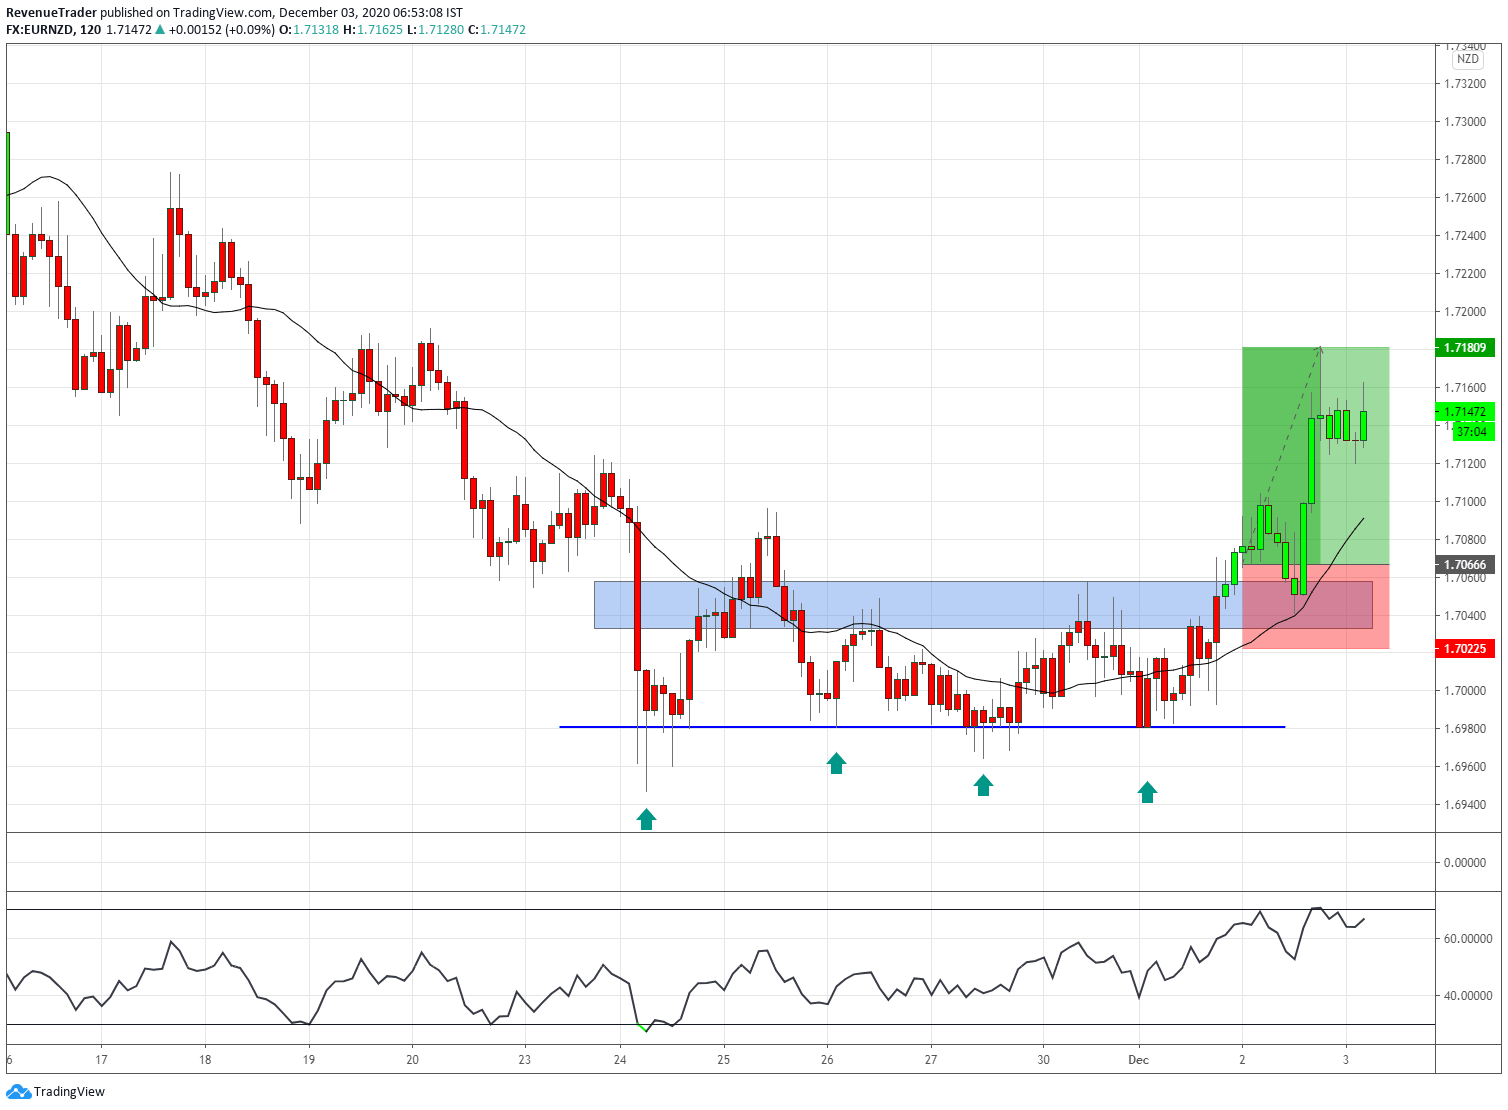
EURNZD was in a clear downtrend with a sequence of lower lows followed by lower highs. But look at the horizontal blue line in the chart. From that point onwards, the price struggled to establish another lower low, which led to a range-bound market condition. After consolidating for a while the price broke above the local structure level suggesting the buying pressure and we ended up placing buy trade here and as you guys can see, we were able to make another 2R profit from EURNZD.
Next…
USDJPY Short Trade
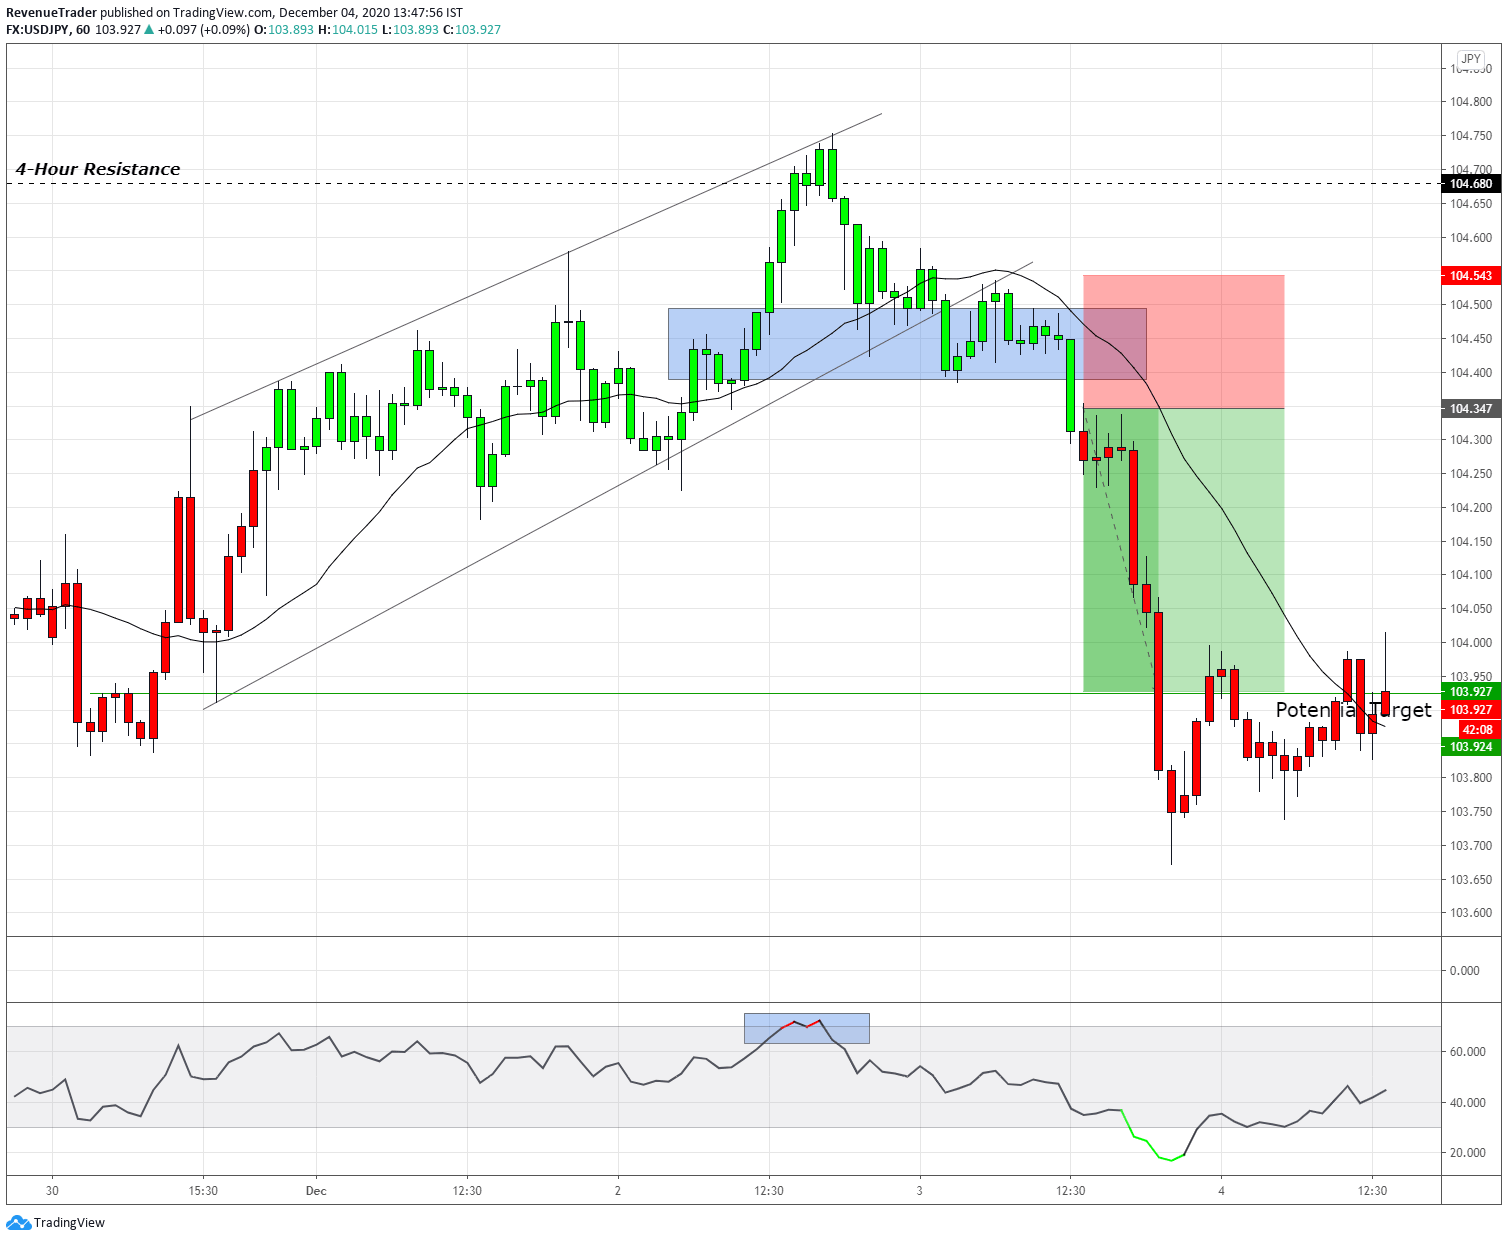
Unlike other trades, USDJPY was at a poor uptrend, the rising channel is the result of that and confirms the lack of bullish momentum that USDJPY had.
After the price reached the 104.680 resistance level from the 4-hour chart, the price fell sharply and broke below the rising channel. This is our first reversal confluence. Now at that time we knew that the sellers were gaining traction, and as a result of that price ended up breaking below the local structure level, which is our entry signal. We’ve placed a sell order a few pips below the local structure level and as you guys can see, we’ve ended up making a fast 2R profit on USDJPY.
With four trades closed, we were able to earn a total of 6.2R, which is equal to 12.4% in our trading account. (If risk per trade is 2%).
Next, let’s take a look at the trade ideas for the coming week.
Disclaimer: Trade Revenue Pro’s view on the Forex Charts is not advice or a recommendation to trade or invest, it is only for educational purposes. Don’t Blindly Buy or Sell any Asset, Do your own analysis and be Aware of the Risk.
Keep in mind, These are Just Market Predictions and not a Trade Signal or Trade Ideas, At Trade Revenue Pro We are Using Daily Time Frame to Identify Major Price Movements and Push Down 4-Hour Time Frame to Get Favourable Risk to Reward For Our Trades, Furthermore, We are Using Tight Risk Management Method to Preserve Our Trading capital.
EURJPY Double Top Pattern at the Daily Resistance Level
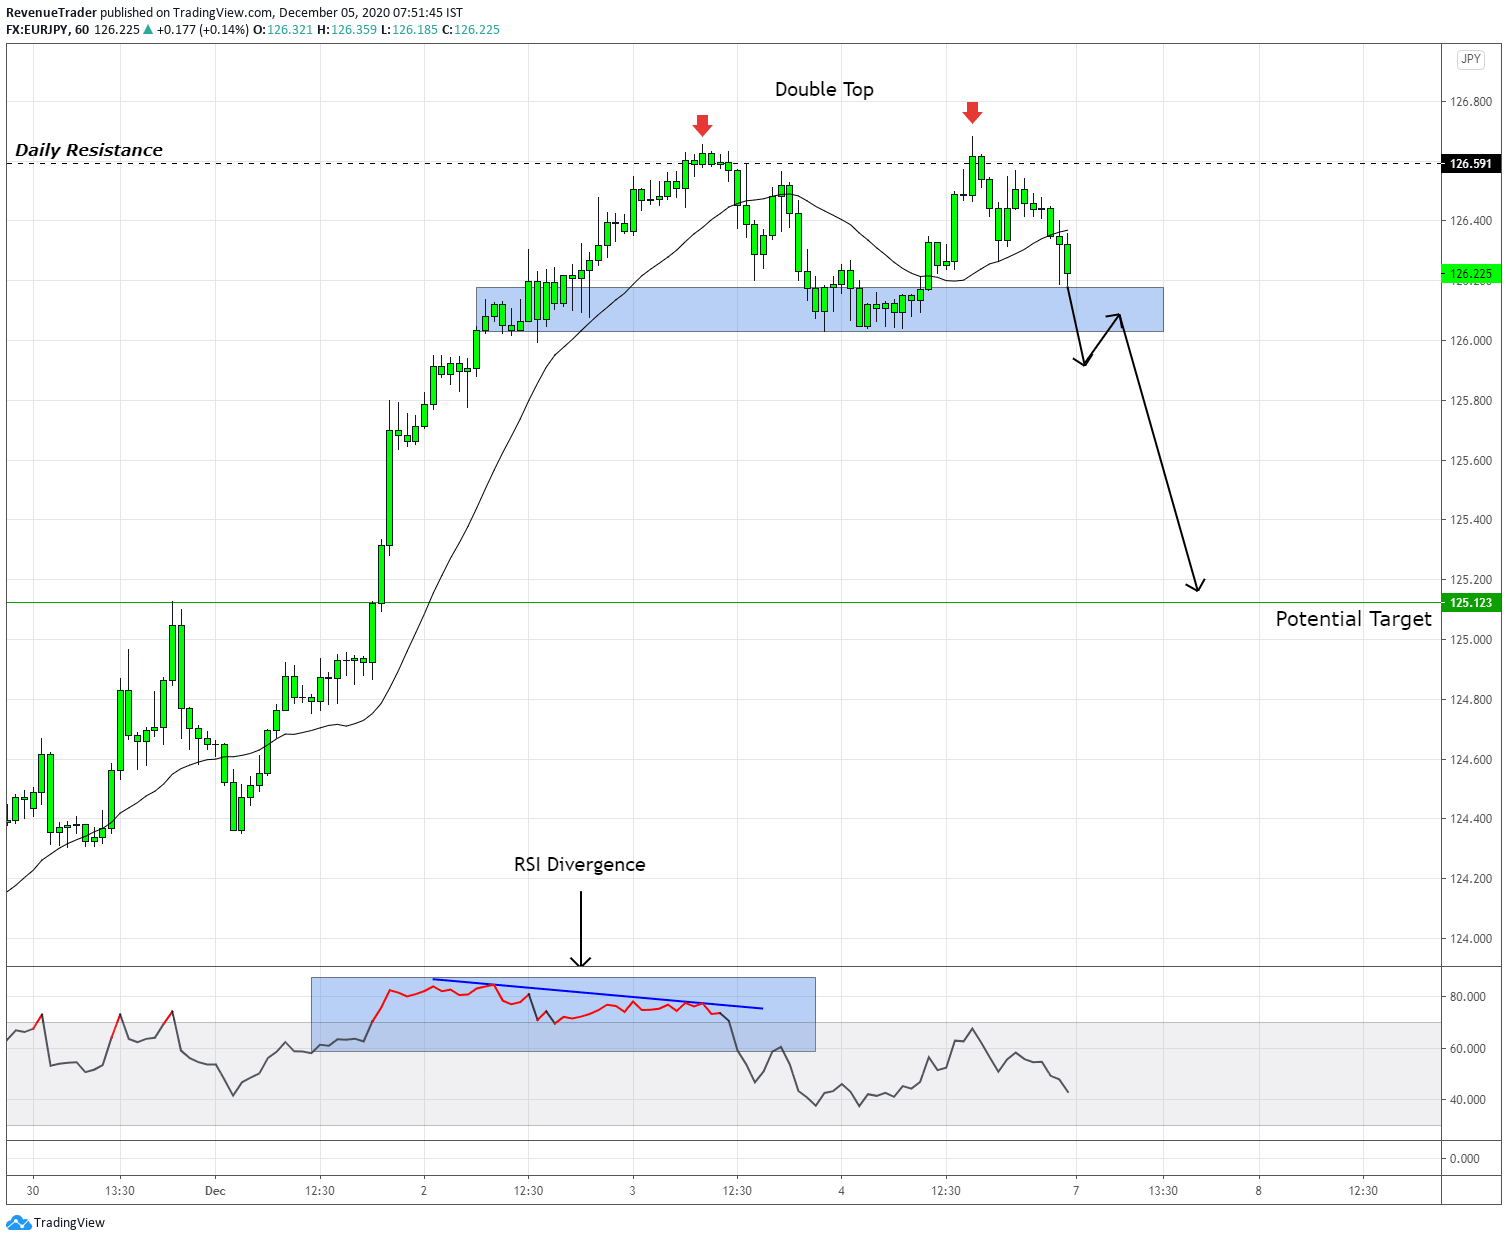
Key Level – As the above chart showed, EURJPY is now trading around 126.591 resistance level comes from the daily chart. As price approached this level in the last week, the price action immediately showed some selling activities at 126.591 daily level.
Double Top Pattern – Double Top pattern at the daily resistance level indicating that buyers are struggling to keep on driving the price higher. The double top pattern is not confirmed yet, to have a confirmed double top pattern price need to closed below local structure level which acts neckline as well.
RSI Divergence – The RSI divergence indicating the lack of buying pressure in an objective way. This is an additional confluence for our trade idea.
Market Forecast – As long as price trading above the local structure level, it is an uptrend and if price break and closed above the daily resistance level, the possibility of trend continuation is much higher. But if price break and close below marked local structure level, the whole trend will be changed hence we can expect and trend rotation all the way down to the marked target area.
Trade Idea – If we get that breakout to the downside, we will consider going short by targeting 125.123 marked target level.
NZDUSD Trend Reversal Signs on the Daily Resistance level
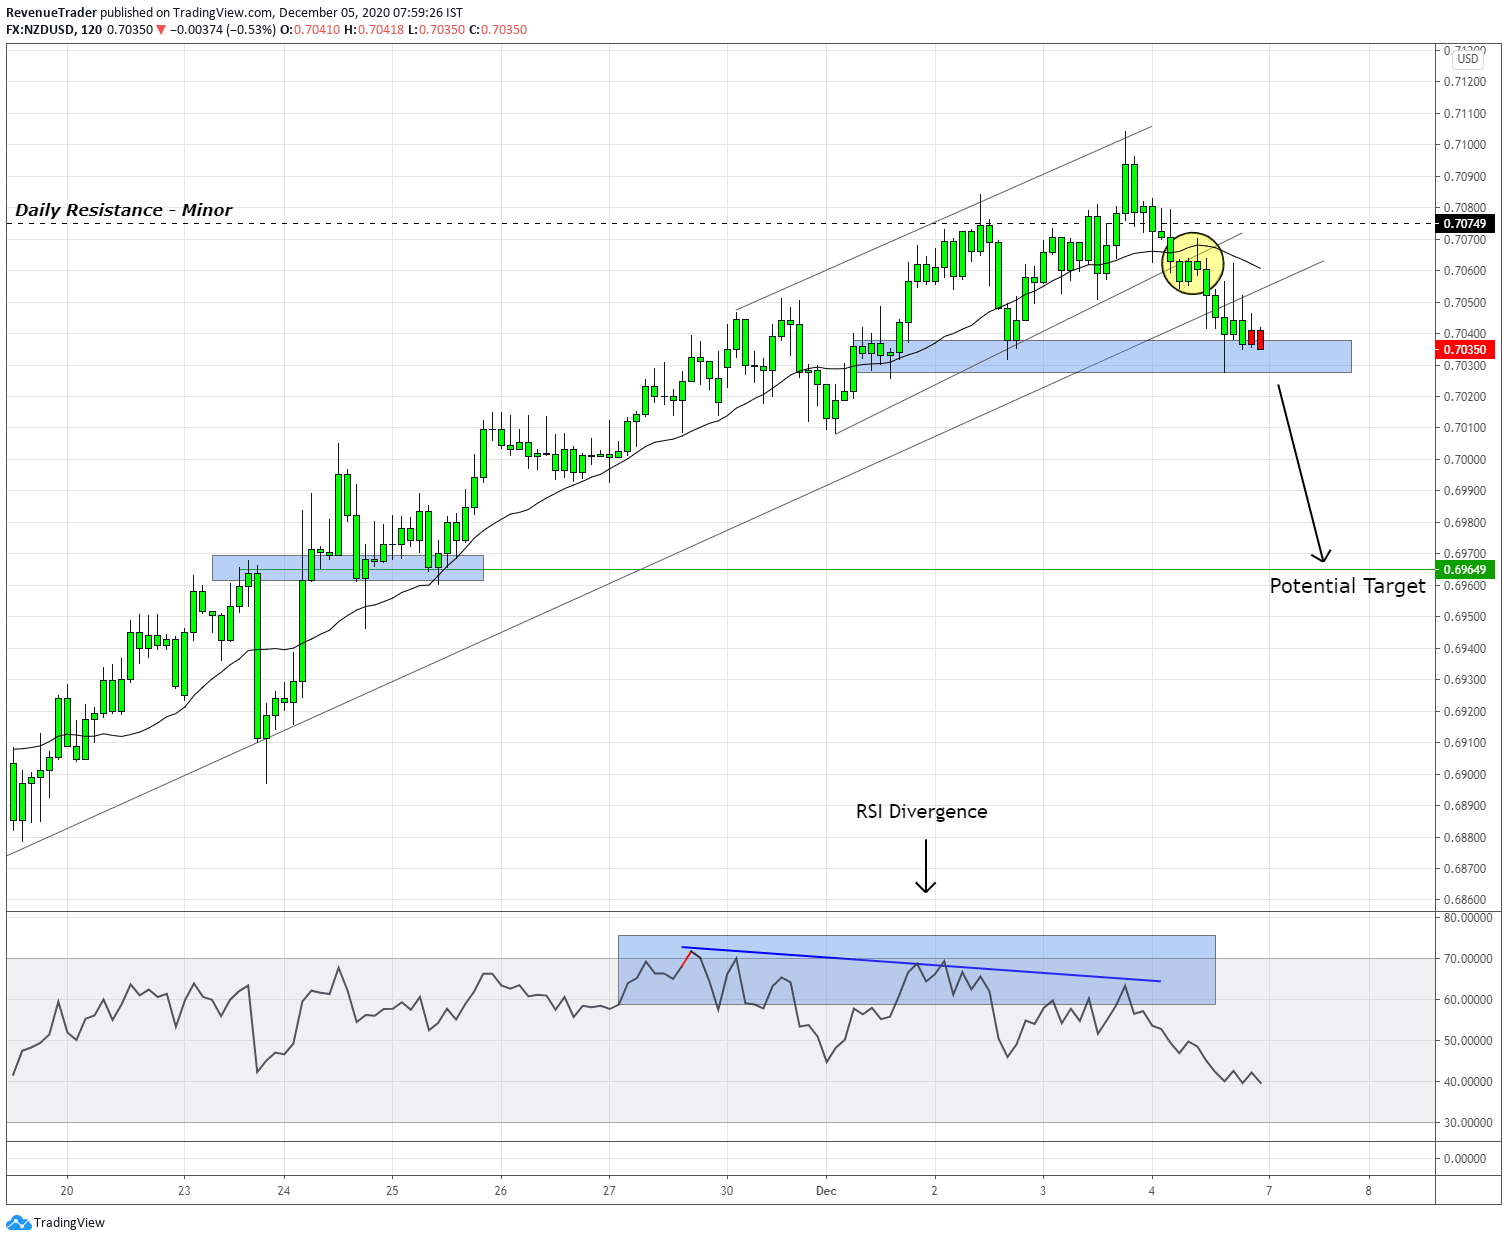
Key Level – At the moment, The Long, clear and technical oriented uptrend is showing selling activities around 0.70749 resistance level which comes from the daily chart. Keep in mind that this is a minor structure level in the daily chart, Hence we should be careful when trading around this level.
Rising Channel – Rising channel at the resistance level indicate that buying momentum is slowly fading away. Have a look at the breakout of the rising channel and moving average (Yellow circle) which even confirm the selling activities.
Trendline – The long term trend line is also broke. This indicates that the whole trend structure is going to change.
RSI Divergence – The divergence on the RSI confirm the lack of bullish momentum and the above trading confluences is also confirmed by the RSI divergence.
Market Forecast – All the trading confluences listed above indicating the lack of buying pressure, But the uptrend structure is still in place. If we willing to go short on this pair we have wait for a break below the local structure level which confirms the validity of a new trend reversal. If that happened we can expect a bearish rally all the way down to the market target area.
Trade Idea – If the price breaks below the local structure level, we will consider going short by targeting 0.69649 target level marked in the chart.
Head over to Trade Revenue Pro Trading Blog to learn more about how to trade forex with Proven Trading Techniques and Strategies.
Want more Trade Ideas – Head over to Trade Idea Page.
That is all for this week and If you want constant trade updates – consider following Trade Revenue Por on Tradingview.
Also, consider following us on social media and Pinterest, Instagram and Facebook.


