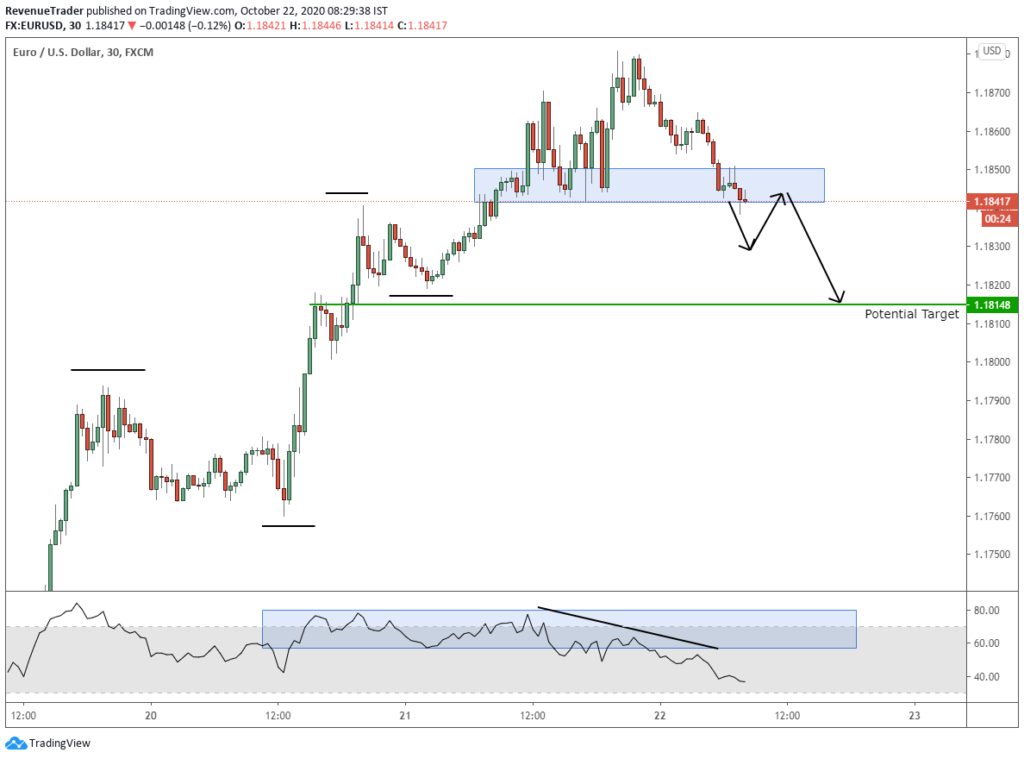
Key level – Right now the price is trading around 1.18450 at the previous HL (Higher Low). This level is critical because if the seller breaks below the 1.18450 zone (blue zone in the chart), the whole uptrend will be invalidated and this can lead to a whole new downtrend that means a reversal of the trend.
Trend Structure – Look, the left side of the market is on a strong upward trend, right? Sequences of HH and HL. But sellers are trying to break below the previous HL right now. This will invalidate the previous trend and this would also lead to the formation of a new LL, which is the starting point of a new trend.
RSI Indicator – The 4-hour RSI indicator is in overbought condition and there is a reasonable edge over the market for this trade confluence. To learn wh,y read the ultimate guide to the RSI indicator. The RSI indicator indicates strong divergence in the 1-hour chart, which is a clear indication of a trend reversal.
Market Forecast – When considering all the above trading factors, it is obvious that buyers are losing their control and the sellers are trying to create a new lower low. If this happens, the likelihood of price dropping all the way down to the marked target level at 1.18148 (Green line on the chart) is higher. We will be looking for a break and retest of the blue zone which is previous HL to place the trade on EURUSD. We would also ensure that this trade is executed at the London trade session, as the Asian session tends to generate more false breakouts.


