
Support and resistance levels have always been an important part of my trading strategy. It’s something I can’t live with.
I struggled to find the right key level to place trades at the start of my trading career. I read a lot of articles about how to draw support and resistance and watched a lot of YouTube videos. Some of them got little assistance, and the majority of them failed.
So with that little experience in hand, I decided to backtest my own, and surprisingly enough, I found that the way I draw support and resistance was totally wrong. I’m sure I would have blown my trading account if I continued to trade the way I learned from those articles and videos.
Now, in my backtesting, I discovered that there is no rocket science behind identifying these key levels, and because these levels can be very subjective, I can affirm that identifying and drawing support and resistance levels is an art.
In this article, we are going to talk about how to draw support and resistance levels while constantly adapting to the market condition. Adapting to the changes is the key point here and we will talk deeply about it in upcoming chapters.
Let’s get started.
First of all…
What is Support and Resistance in Forex Market?
In a forex chart, support and resistance levels are previously tested levels where currency pairs (or equities, commodities, etc.) are anticipated to encounter a barrier in the near future. This is because these are psychological levels displaying the various behaviours of market participants, including you.
What happens when prices near these critical levels?
When prices reach such key levels, they may bounce in the other direction or consolidate, or the level may be broken and the price may make a rapid continuation move.
Support and resistance levels act as a battleground for buyers and sellers.
The stronger always beats the weaker, which means that if buyers have more buying pressure at the support, they may easily bounce the price from the support level, while sellers will struggle to break the support level.
Learn bare basics about support and resistance from here.
Let’s put that basic stuff aside and talk about what we are here: how to draw support and resistance.
Identifying and Trading Support and Resistance is an Art.
When dealing with support and resistance, adapting to the market changes play a huge role. Also knowing the fact that you have to adapt at some point as the market changes will help you to keep your emotions under control as well.
Now, why do we need to adapt? Let me explain by using the chart below. (At this point do not worry about how these key levels are drawn)
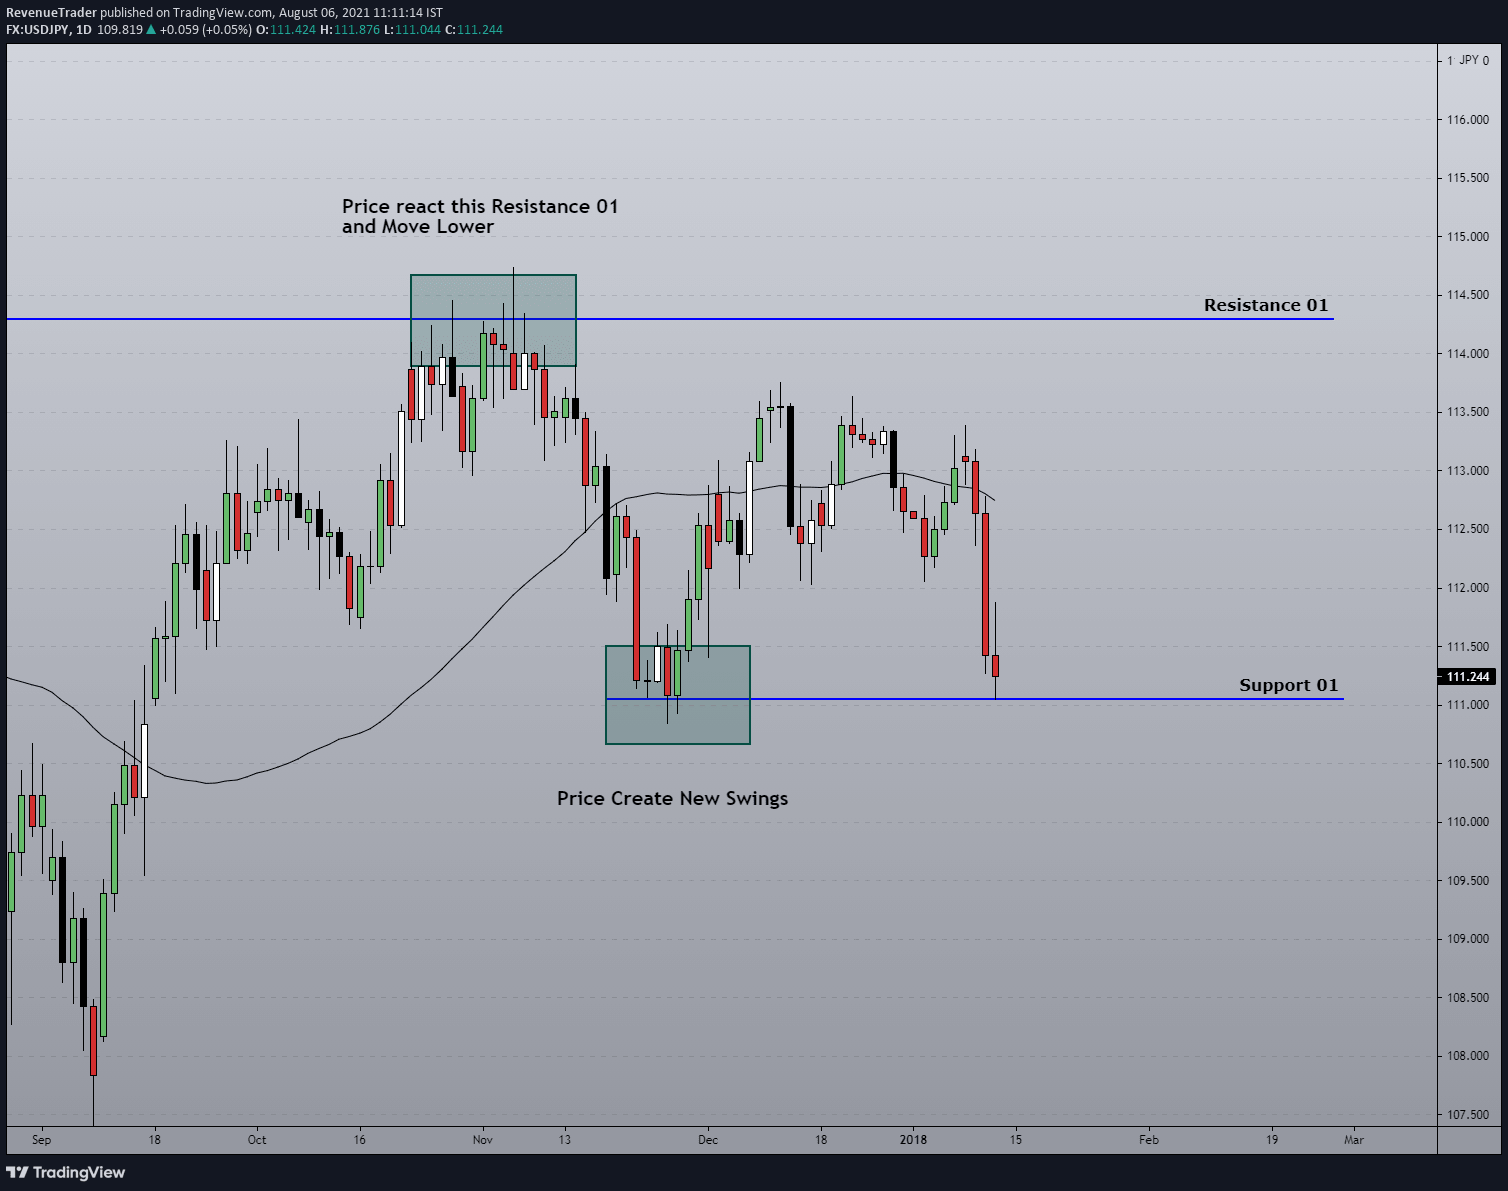
This is USDJPY daily chart. Have a look at the first green box. At that point, the price reject that level (Resistance 01) and pushed down strongly all the way down to the second green box and from that point, the price again retrace upward. Since this retracement is heavy and clear we can take the second green box as a swing point and draw a new support level from there.
See, this is what I called adaption. Basically, the price creates a swing point, and with that information, we draw a support level utilizing that swing point.
Now, what happening? The price action is now trading around support 01.
On this point, we can look out for three possible outcomes. They are…
- Price can easily break below the support 01,
- Price can come at the support level 01 and can be consolidated OR,
- Price can hold the support 01 and can be reversed.
Now as traders, we should be ready to adapt to any of these outcomes. For example,
- If the price break below, we looking for that support 01 to test as a resistance level,
- If the price action started to consolidate around the support 01, then we should avoid this level. OR,
- If price actions show a rejection around the support 01, we should look forward to placing buy orders and riding the reversal.
It is simple as that.
Let’s see what happened here?
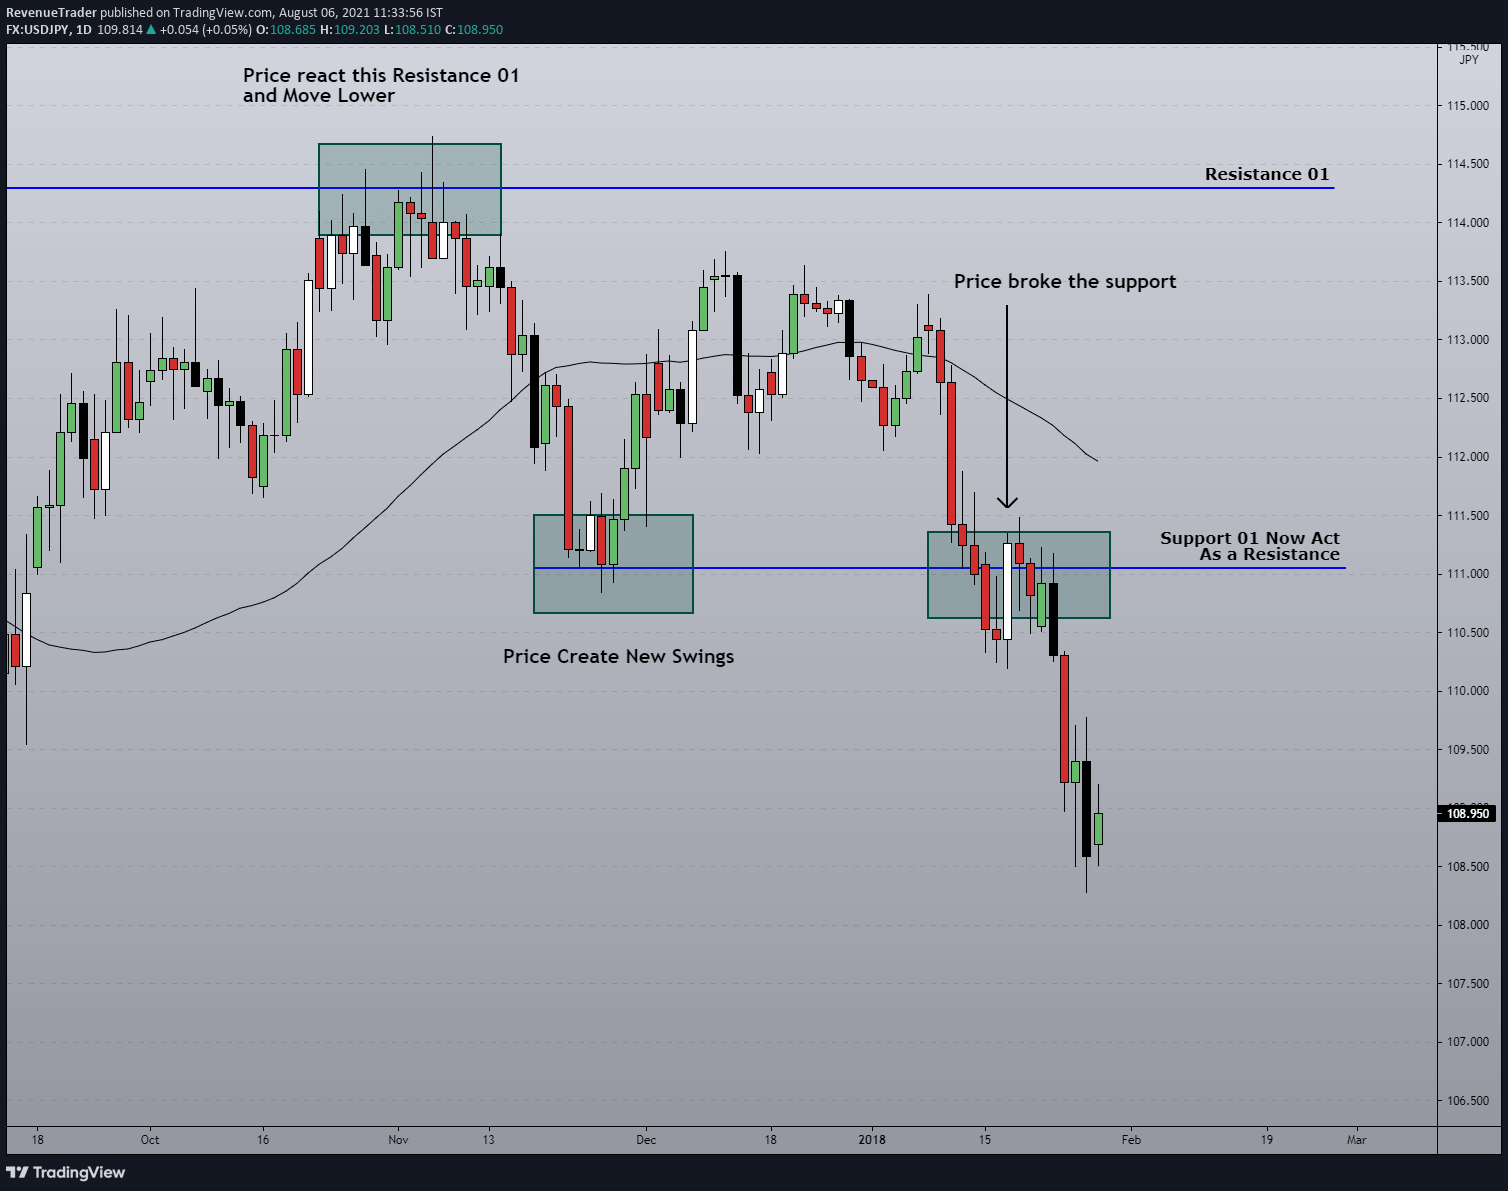
Now, what happened there? Price broke below the support 01 and act as resistance before moving down.
Fortunately, we had a plan for adaption.
Since we had an adaption plan for every possible outcome, we were able to catch the bearish movement without putting in much effort.
That is why adaption is very important when it comes to trading with these key levels.
Here is the reality, there is an equal distribution of happening breakouts, reversals and consolidations around these key levels. Therefore we should always be ready to switch, flip and change these levels according to the market behaviour.
With these things in mind let’s move forward and talk about how to draw support and resistance level in forex.
How to Draw Support and Resistance in Forex
As I said previously, drawing support and resistance is an art.
No one can tell you that this is the right level to trade at, or that this level is weak and should be avoided.
These key levels can be very subjective, therefore I created 3 major rules to follow when placing support and resistance on a chart.
Let’s talk about those rules one by one…
1. You Should Place Support and Resistance Level on The Same Timeframe Where You Intended to Trade
We all heard about the term Multi Timeframe Analysis. Yeah, it can be used to trade support and resistance profitably. There is no doubt about it.
BUT, Actually, you don’t need multi-timeframe analysis since it makes your trading approach more complex.
The whole purpose of this type of analysis is to take the risk to reward ratio in your favour. But what If I told you that you can also make favourable risk to reward without switching to the lower timeframe.
Now have a look at the chart below.
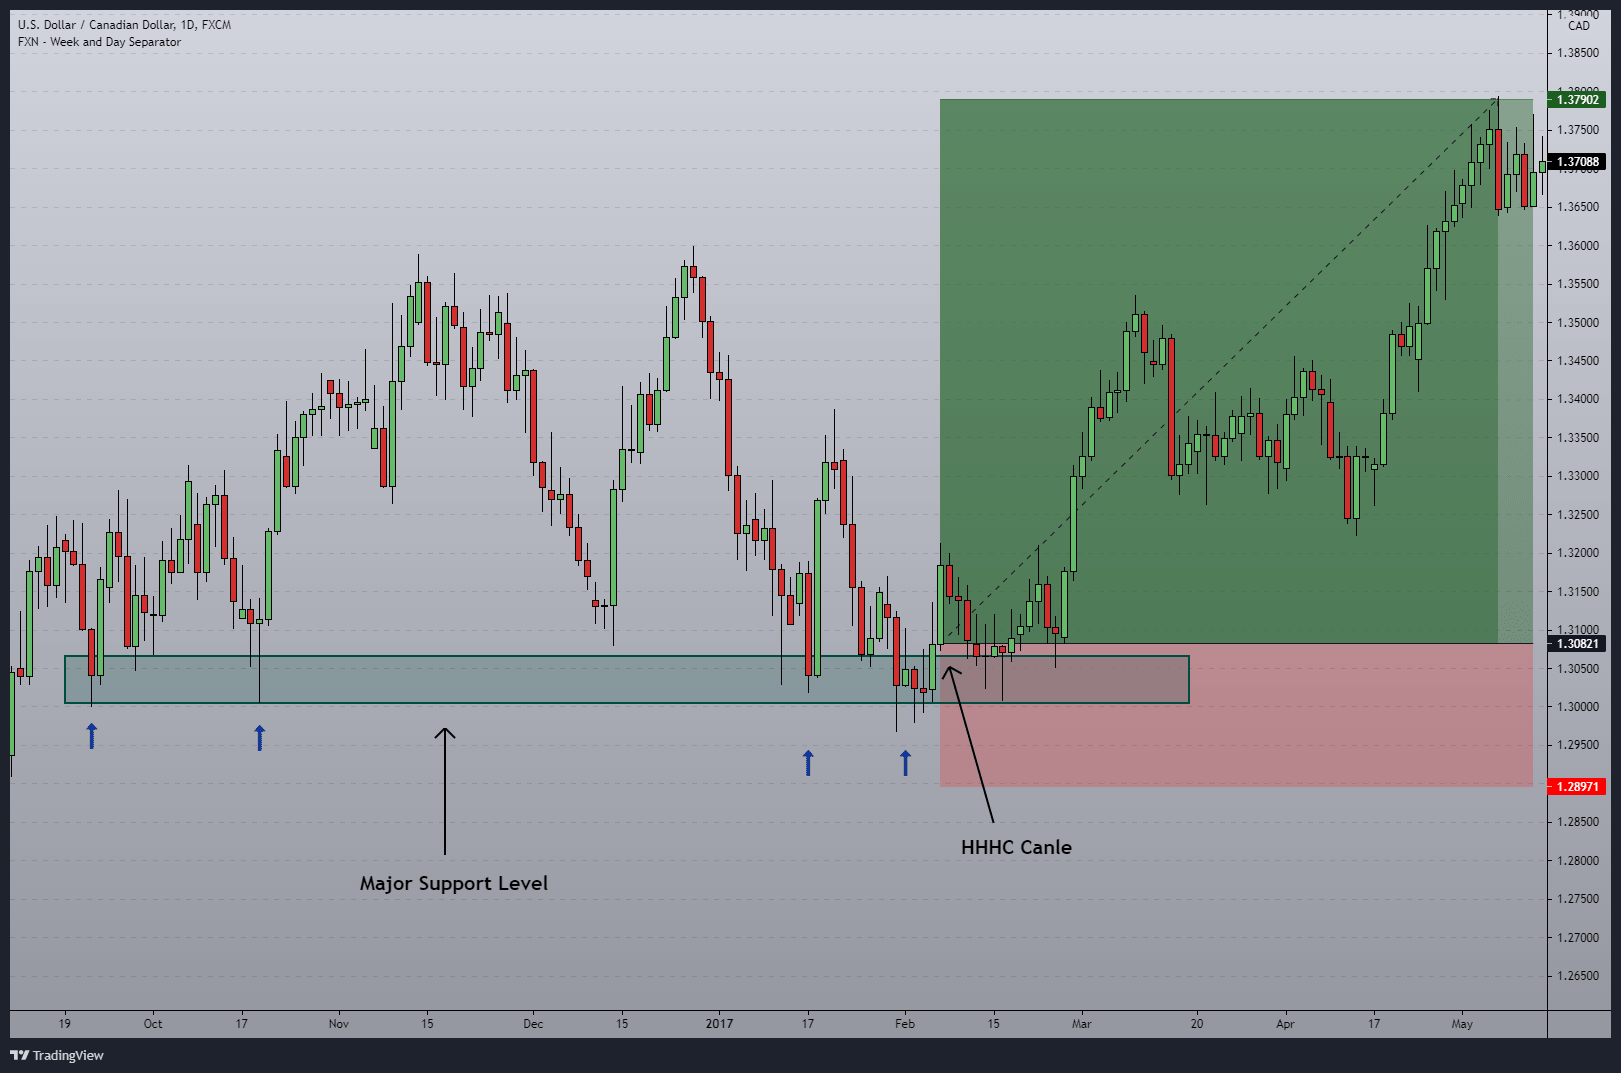
This is USDCAD daily chart, we can see a support level drawn on the same timeframe and the trade is also taken using the same timeframe price action without switching down to the lower timeframe.
Now according to the above trade, it is a highly profitable trade and the Risk-Reward ratio is also in our favour, then why bother changing the timeframe, right? I hope you got the idea here.
So what is the advantage of using the same timeframe for plotting and trading support and resistance, It is Simplicity.
Now how do I place this trade? don’t worry about it now. We will talk about it in the How to Trade chapter.
For now, keep in mind that you should place key levels on the same timeframe where you intended to trade.
with that next move into the next rule.
2. You Should Prioritize Near Term Levels
Stop using levels from a month or a year ago in your charts. These levels are too old to trade, and the number of buyers and sellers are relatively low at those levels. Rather, focus on the higher-probability near-term level.
Let’s start by drawing these levels together on a blank chart. Have a look at the chart below.
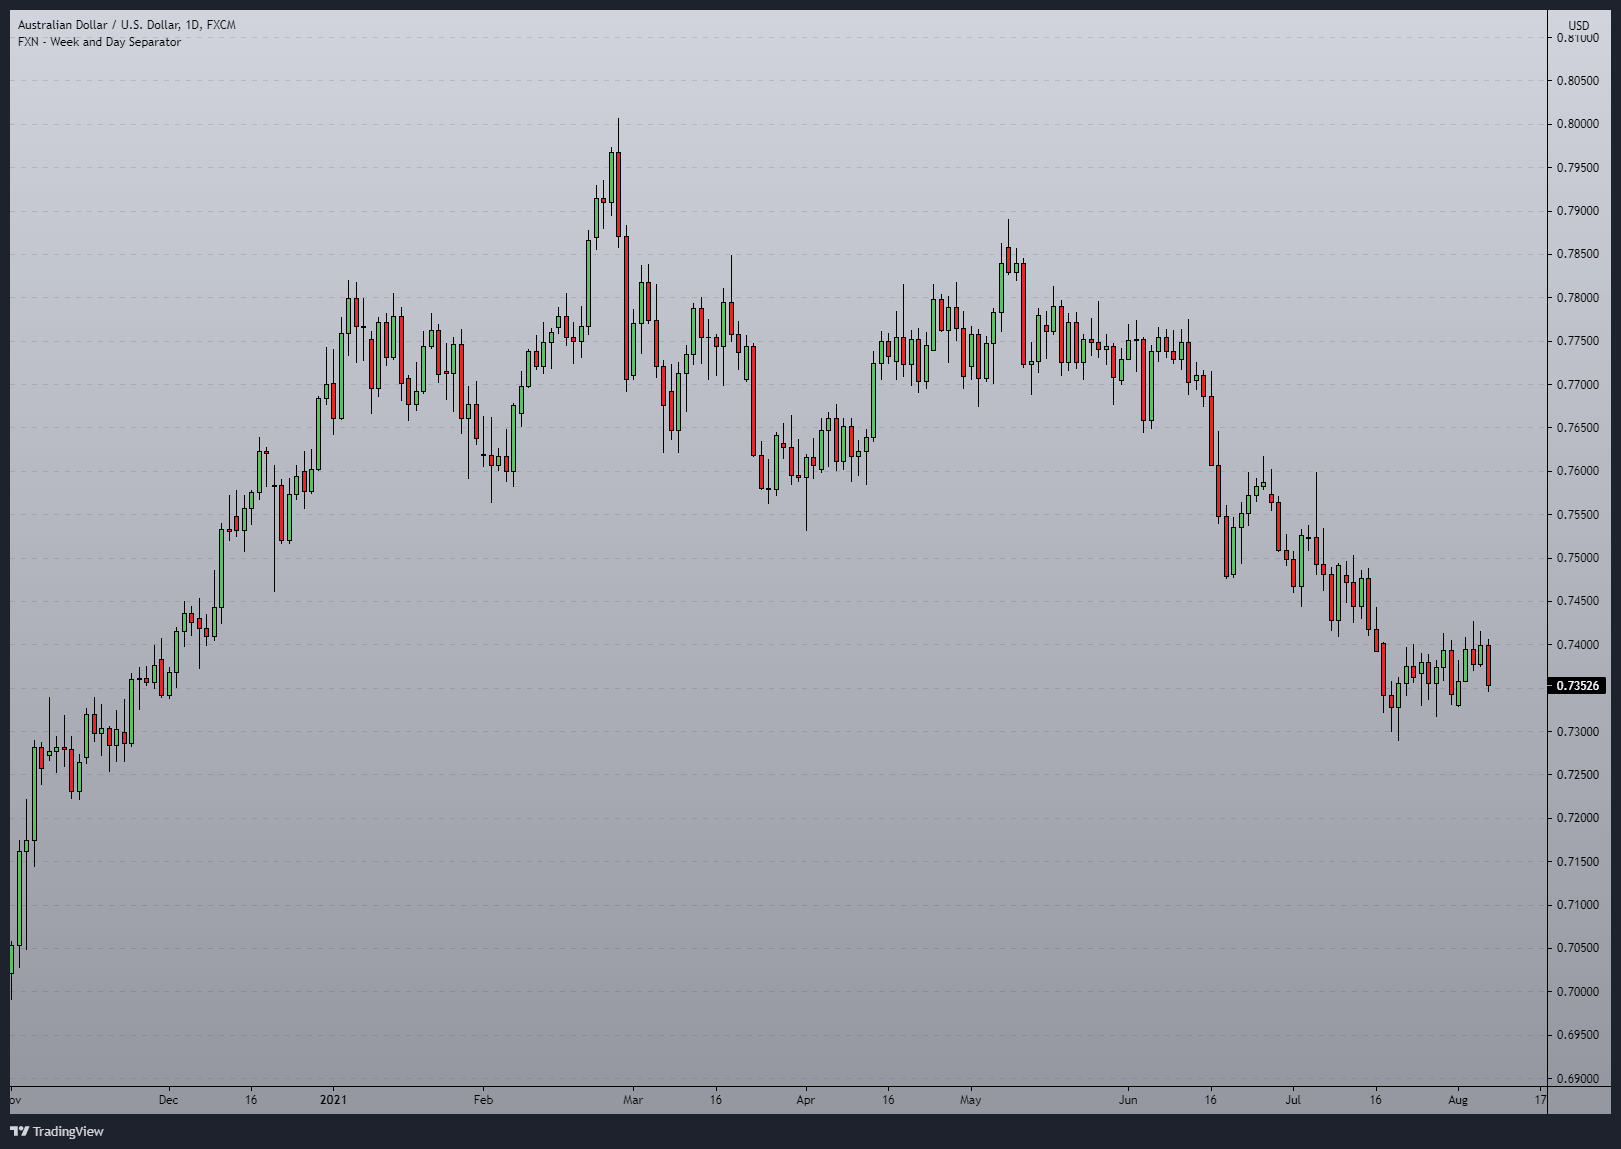
Above is a blank chart with only candlesticks. From this perspective, we cannot see anything on this chart. Therefore let’s mapping this chart by plotting some near term support and resistance levels. So that we can actually see what are probabilities we have in the future as well as what happened in the near past.
Have a look at the chart below.
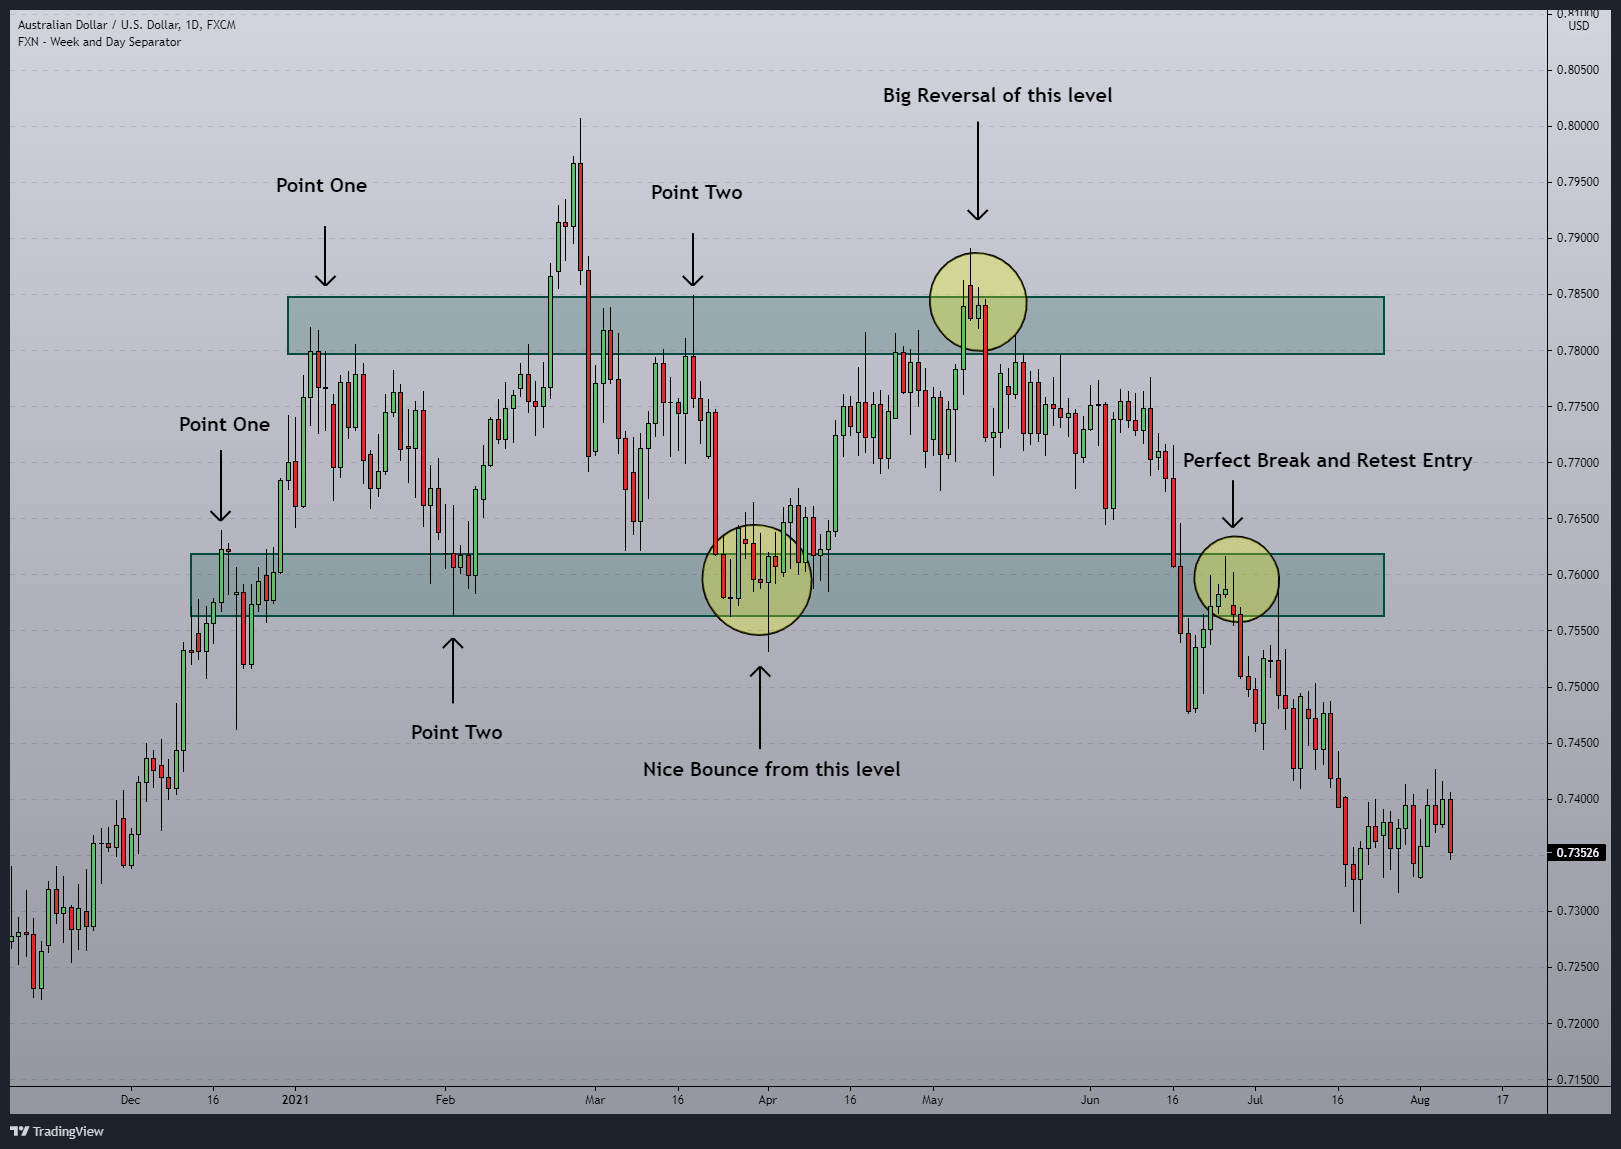
Now the things are crystal clear on this chart, isn’t it?
First, you can see that there are two levels. Have look at the level is in the top, we drew this level using two points (point one and point two in the chart). what happened when the price pushed up to that level again (yellow circle marked on the level on the top)? Price made a huge reversal, right?
The same thing happened in the level marked in below as well. Again we used near term swing points to drew this level (point one and point two). The price tested this near term level two times. The first yellow circle on the bottom level shows the nice bounce from this level and the last yellow circle shows the perfect break and retest entry from this level.
As you guys can see, we had three perfect trade opportunities around these NEAR-TERM support and resistance levels.
So next time when you draw support and resistance make sure they are near-term levels.
With that let’s move into the last rule, you should follow when drawing support and resistance.
3. Support and Resistance Levels Should be Zone, Not a Single Line
I hope you already heard about this because everyone is talking about this.
Therefore I’ll explain this briefly.
When you draw support and resistance levels, make sure they are not lines. They should be zones like we drew in the previous example.
For example, have a look at the chart below.
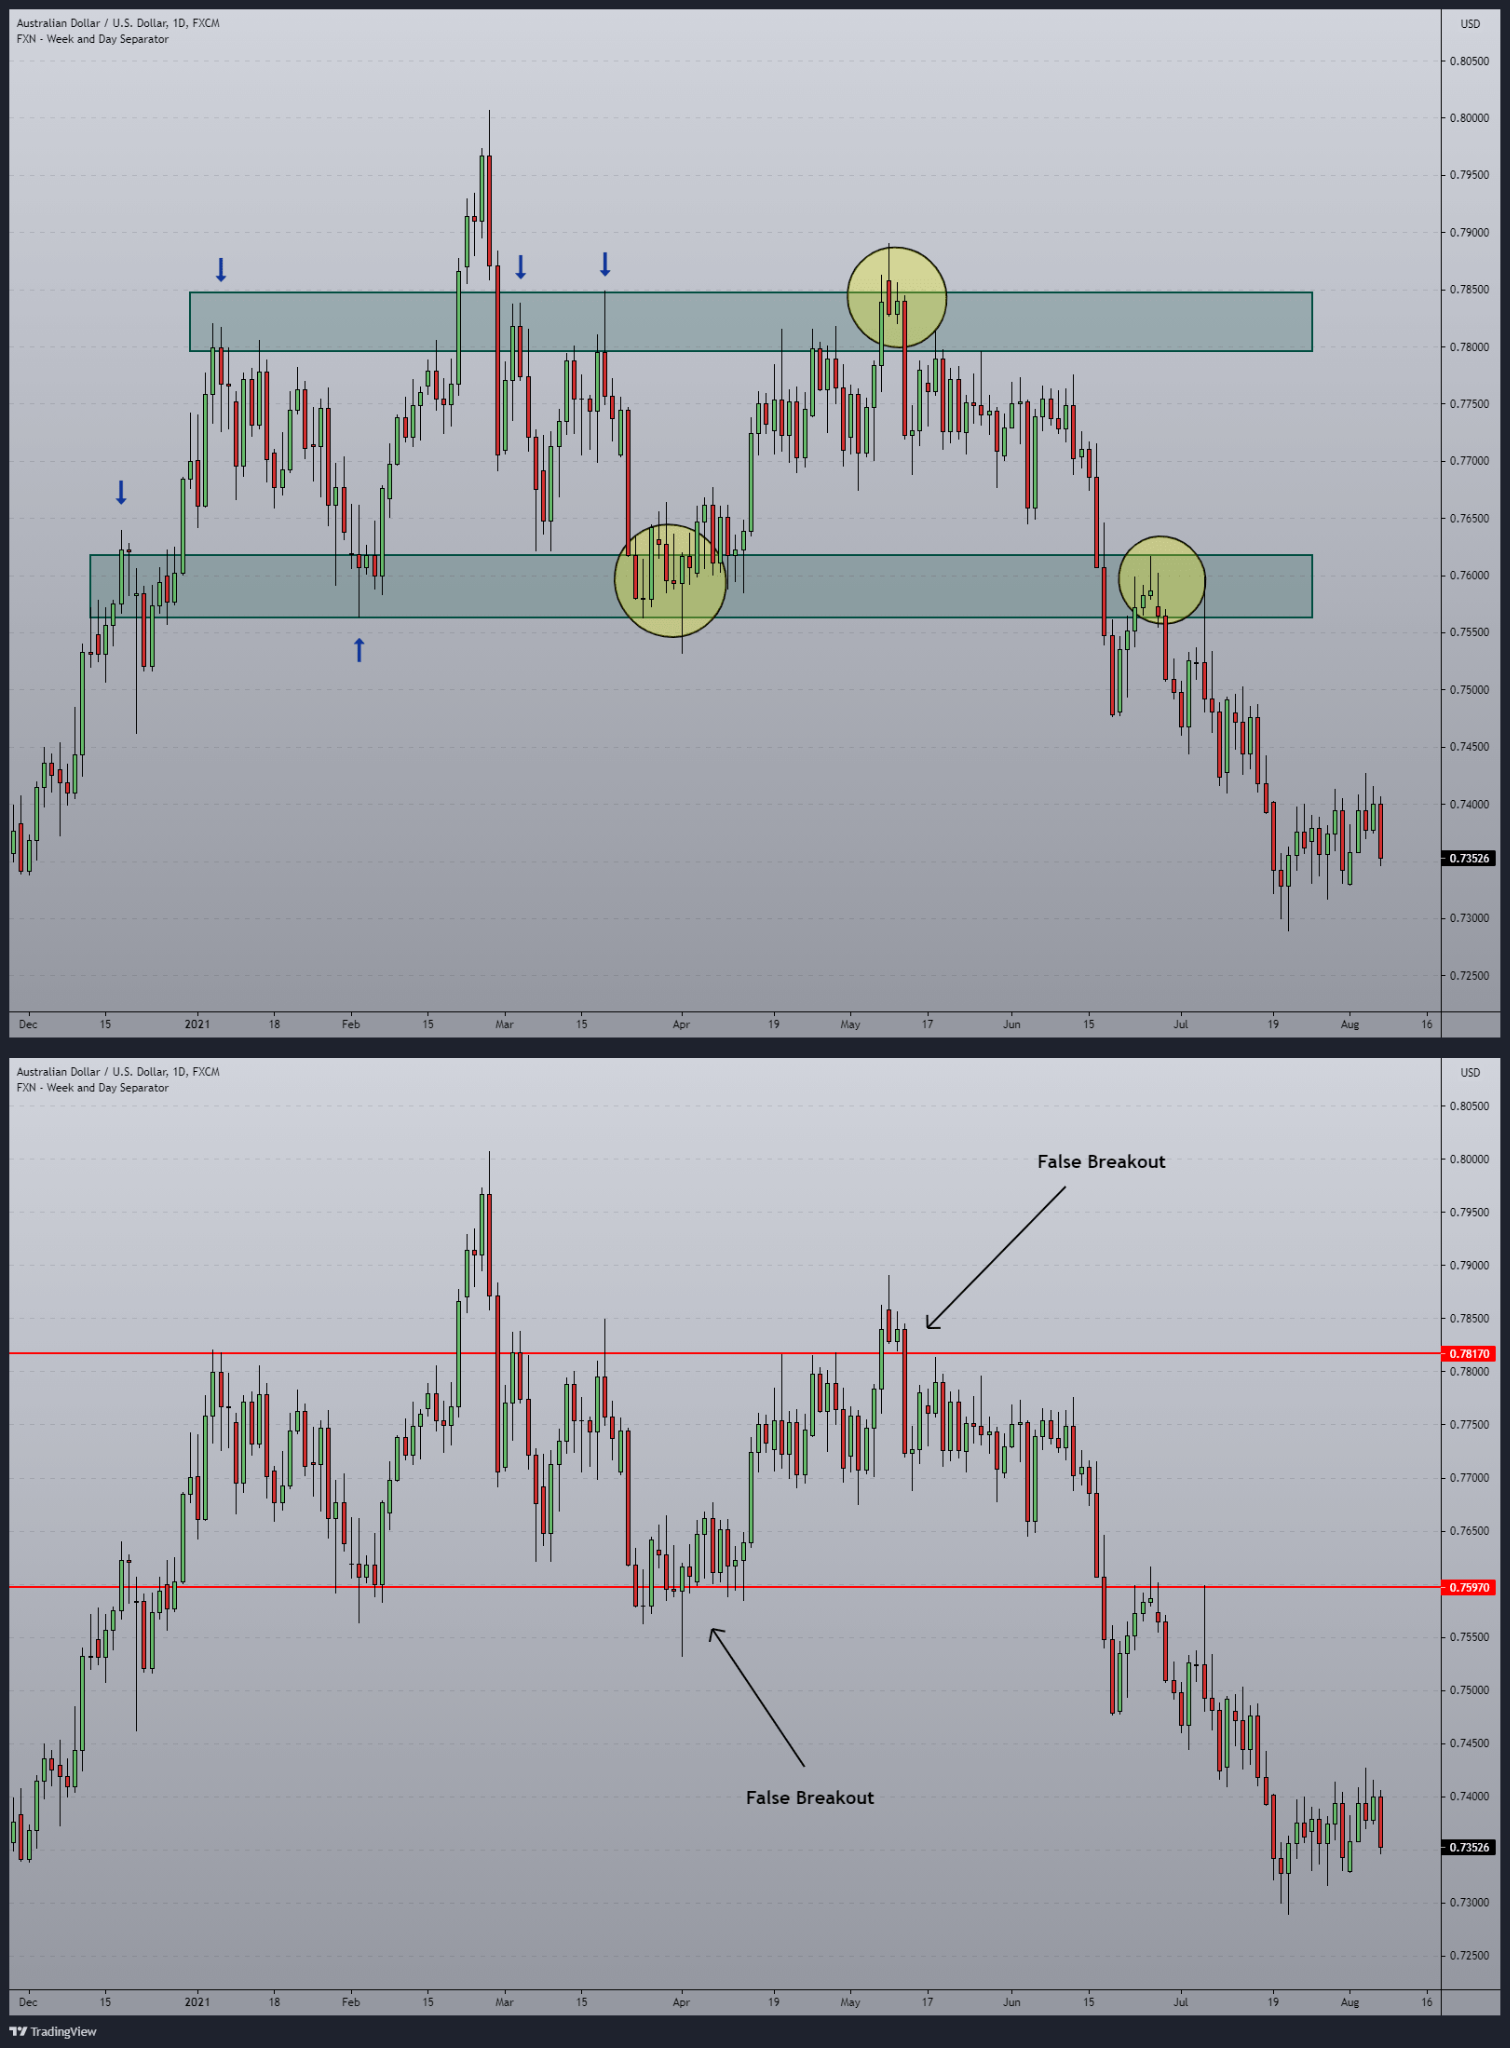
The first one with the zones and the second one with just lines.
On the first chart, we can see that price respected to the zone nicely and we can easily wait and catch the movements without having a headache.
But on the second chart, the support and resistance levels are drawn by using single lines. Which resulted in false breakout around these key level and this make it harder to distinguish between a breakout and a rejection.
So make sure to use zones when drawing support and resistance levels on your chart.
When drawing support and resistance levels, following these criteria will allow you to be more selective rather than drawing thousands of levels, which will only complicate your trading approach.
Also by following these three rules will help you to draw only higher-probability support and resistance levels.
So far you already knew how to draw support and resistance on your chart and by reading this article so far now you know how to draw higher probability support and resistance levels.
Let’s move forward and see how to trade these levels.
Now here is the interesting part: from this point onward you will learn how to trade support and resistance in a way that when you win, you will win big and when you lose, you will lose small which really help you to maintain the equity curve like this one 👇.
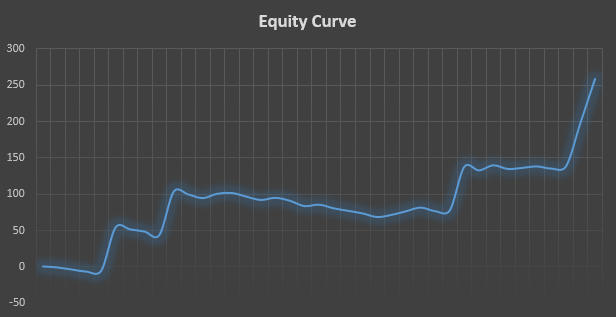
With that let’s dive right in.
How to Trade Support and Resistance in Forex
Simply, trading support and resistance means, you buy at support and sell at resistance.
BUT…
If you trade these levels blindly, there is no doubt that you will end up blowing your trading account for surely.
To trade support and resistance profitable, you need to have proven trading techniques. That is exactly what we are going to talk about in this chapter.
We already talk about the first one which is how to draw higher probability key levels in the market.
Next, we have to talk about:
- Trade Entries.
- Stop Loss and Take Profit.
- How to Cut Losses and Letting Profit Run.
- Finally, Optimal Trade Management.
But before that, Let’s talk about…
How Support and Resistance Trade Should Play-Out?
Here I’m talking about the validation of your trade.
Now think about it for a moment, If a trade you placed around a key level is not moving in your favour and not respecting the support and resistance as well, then what is the point of holding that trade?
There is no point in holding this kind of trades. Therefore we should exit ASAP when we see these types of trades.
On the other side, we should let trades that are moving in our favour to play out in order to maximize our profit and avoid being bothered by losing trades.
Now have a look at the few chart examples below,
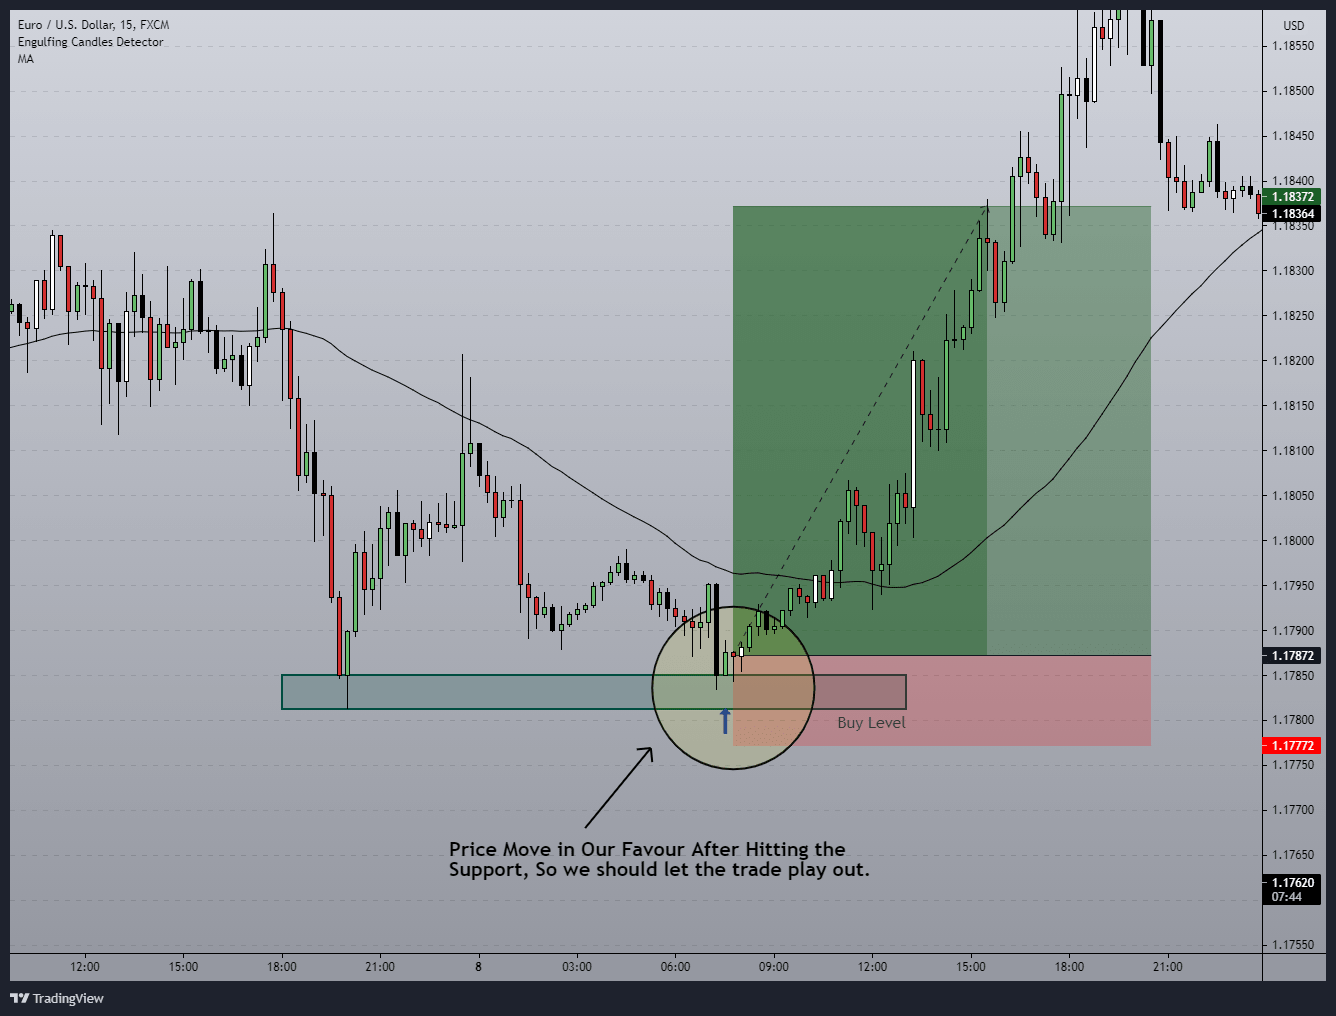
According to the above chart, you can see that after the price hit the support level, it bounced up and kept moving higher. So in a scenario like this, we should let our profit run until the price hit our maximum take profit level.
Now, what if the price did not bounce from that support or resistance level. We simply close the trade.
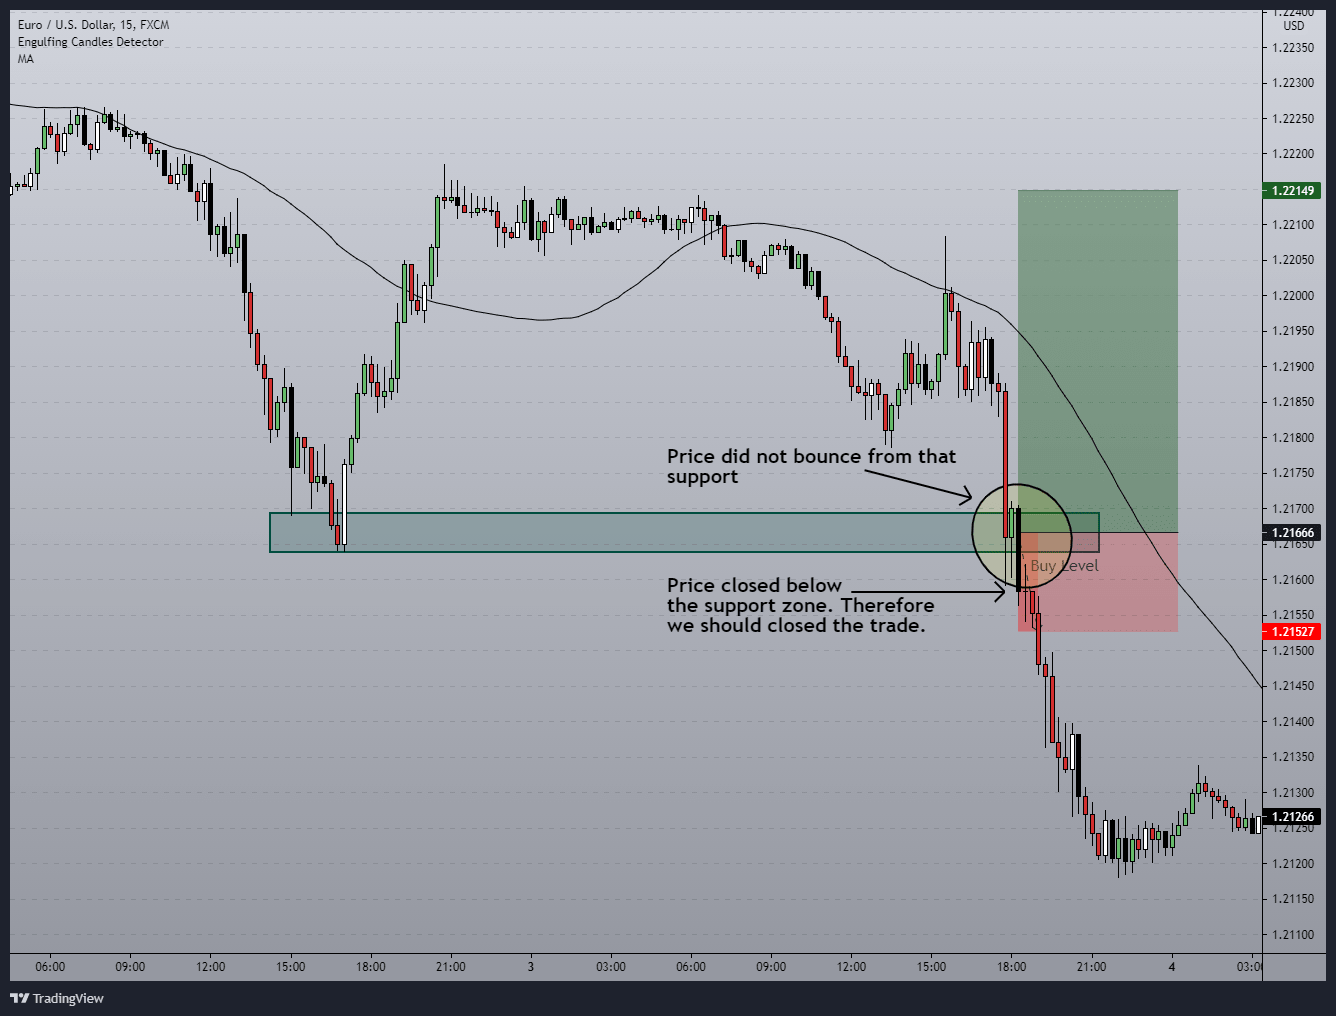
Now according to the above chart, we can see that price did hold the support zone for a while but after the next candle, it broke and closed below the support level. Which indicate that this support is no longer valid and instead of waiting for stop-loss to hit, we should close our trade manually.
In trading, we called this “THE ART OF CUTTING LOSSES.”
The whole point here is that, you should know how your trade should play out beforehand and if it works in your favour, then let the profit run and if it is not moving in your favour, stop hoping that it will turn back again. Instead, close the trade ASAP for a small loss.
We will talk about this in detail in the trade management section.
Next, let’s move forward and talk about Trade Entry.
Trade Entry – This Should be Simple
Please note that I use a 15-Minutes chart to find trade entries as well as placing stop losses and take profits.
Now after finding the right key levels to trade, our next objective is to wait for the right entry signal to go short or long at that particular level.
These entry signals should be as simple as possible, and when they are generated, traders should be able to enter the trade with minimal effort.
I heard some people say that waiting for chart patterns at these levels like head and shoulders, double top and bottoms are going to increase the probability of the trades.
This is false and that is not how the probability works in forex trading.
Building and finding as much as trading confluences (chart patterns, round numbers, etc) around these key levels will not increase the probability of the trades. But this will increase the confidence of the traders because they think that more confluences mean a higher chance of winning trade.
Don’t Fall into That Trap.
In reality, if support or resistance is going to hold, it will hold and also if it is going to break, it will break.
Therefore instead of waiting for complex trade entries which resulted in missing lots of trades, focus on simple entries.
Now, what are those simple entries?
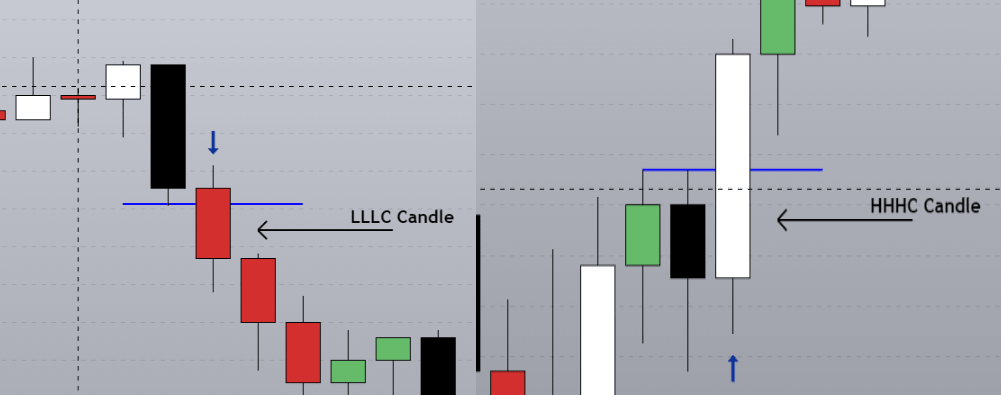
In my trading, I only follow two trade signals. They are Higher High Higher Close (HHHC) and Lower Low Lower Close (LLLC).
Now, What are those candlestick patterns? Simple.
HHHC – If the candle close and break above the previous candle it is Higher High Higher Close Candle.
LLLC – If the candle close and break above the previous candle it is Lower Low Lower Close Candle.
Have a look at the example below.
Before moving into the Stop loss and the take profit, let’s take a few chart examples and comprehensively talk about how to use these entry signals around support and resistance.
Have a look at the USDJPY 15-Minutes chart below.
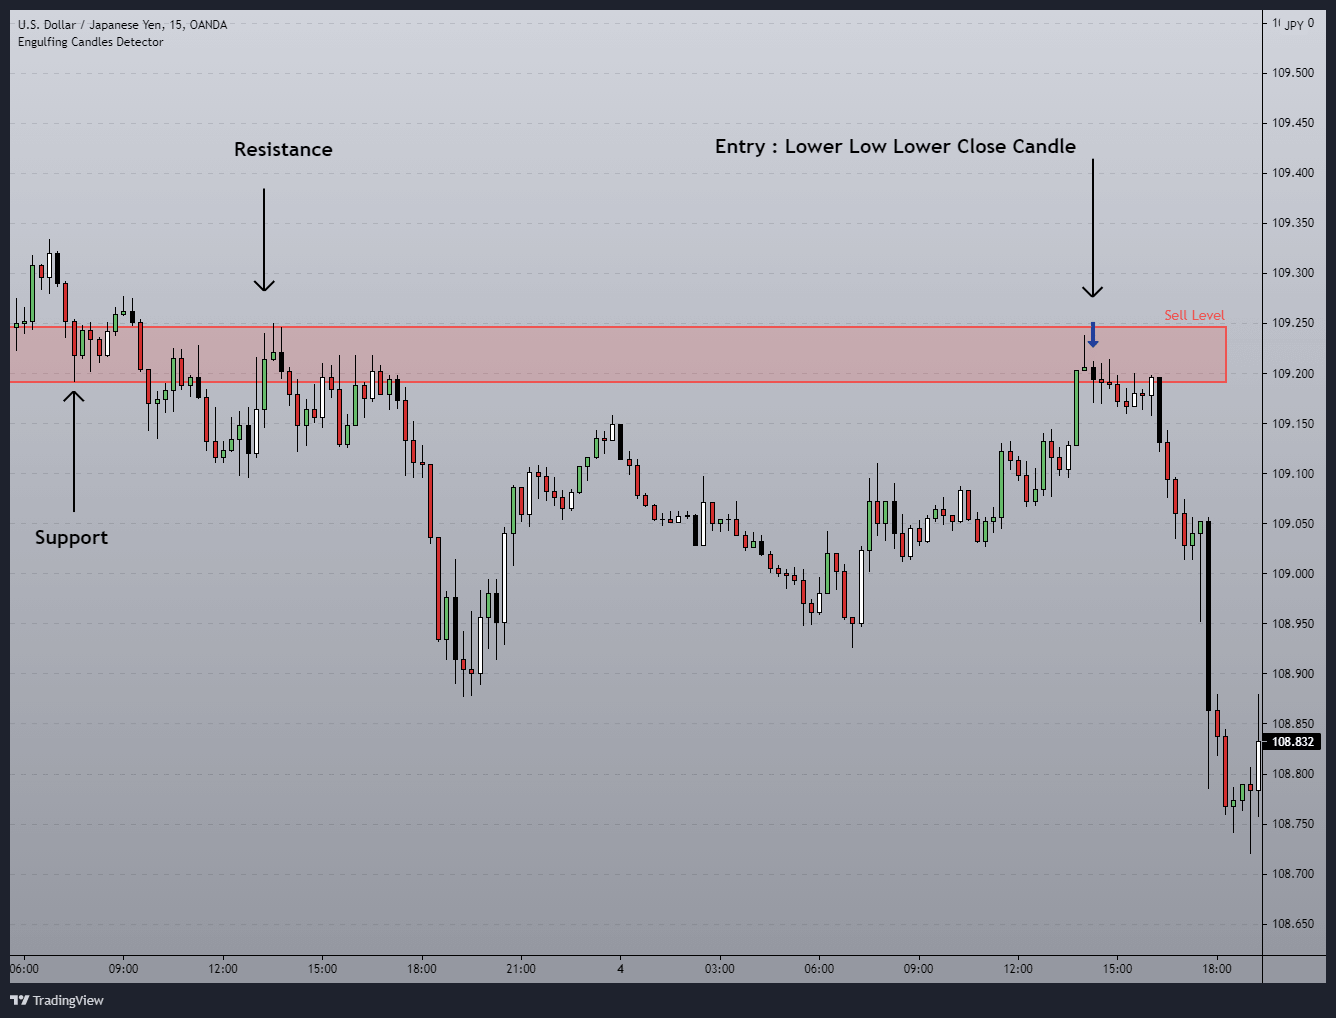
According to the above chart, you can see that we have strong resistance marked in red. This level also acts as support and resistance in the previously, also this is a near term level as well which make this is a key level to look for a trade.
Now, observe the chart carefully, what we got at the resistance level before the price starting to move lower?
A Lower Low Lower Close candle, right? This is our entry signal and what happened after that entry signal, Price fell like a waterfall. Perfect…
One thing to keep in mind is that we don’t give a damn about the shape of the candle around these key levels as long as we meet the entry criteria we execute the trade.
Now let’s move into the second example. This time it is the USDCAD 15-Minutes chart.
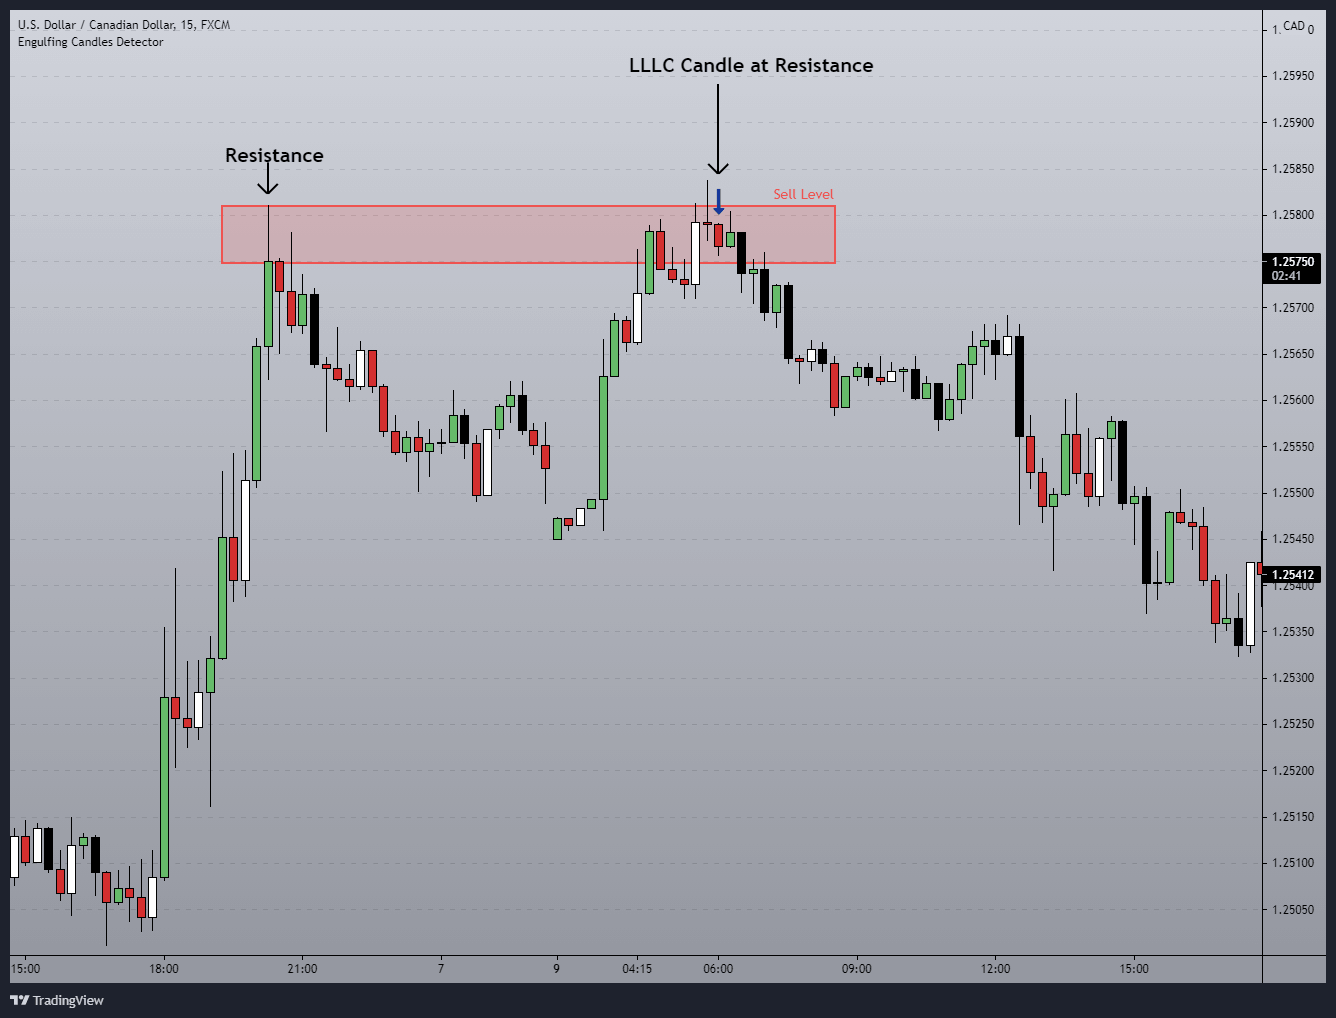
Again the same scenario as the previous trade. We had a strong resistance level marked in the red and then when the price came back to that level all we need is an LLLC candle. In this case, we had an LLLC candle right at the resistance zone and after that price started to move down.
Let’s see one last example. This time let’s have look at a long trade before move into the stop-loss section.
Have a look at the NZDUSD 15-Minutes chart below.
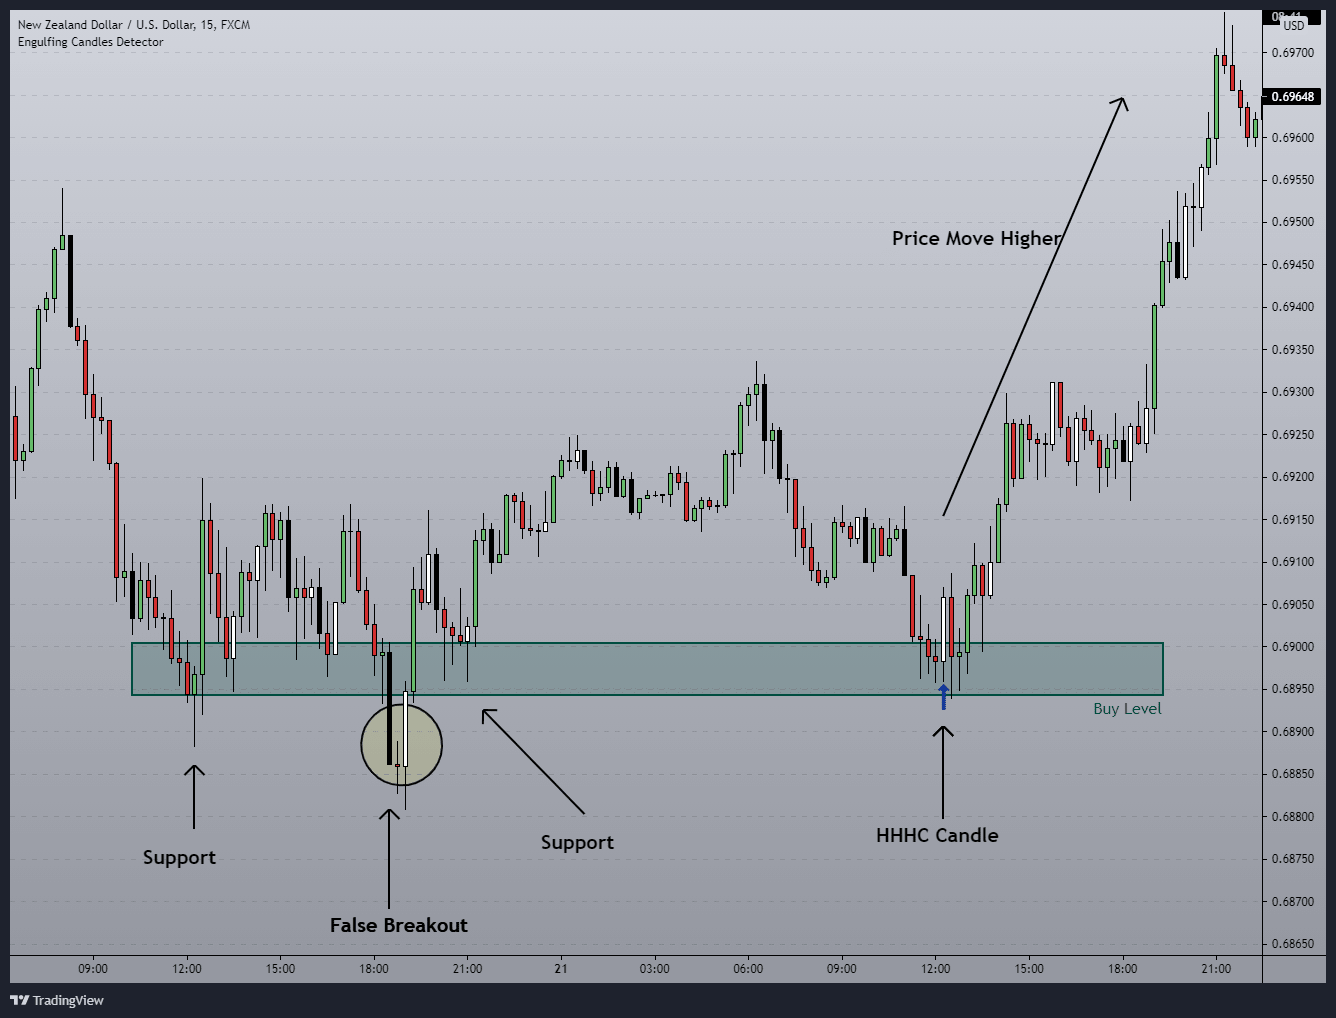
Just like the previous two examples, we used the same candlestick formation for the entry and the only difference is that this time it is an HHHC candle.
Also, pay closer attention to the support zone. In there we can see that price respected this zone multiple times and in a one-time price did break below the support and quickly move up which resulted in a false breakout.
Then price once again came back to this zone and the occurrence of the HHHC candle indicates the long entry and just like the previous two examples, the price ended up moving in our favour.
That is it.
I hope you got the idea of the entry.
Now, does this work all the time? No!
Like any other strategy out there, this one is also suffering from losses, which is normal.
Now whenever I place trades, I keep a plan to cut losses. This will help me to drastically reduce the amount I lose from trades. We will talk about this in deep in the trade management section. So just hold on.
But before that, let’s talk about how to place Stop-Loss and Take-Profit.
Placing Stop Loss and Take Profit.
Uncertainty is always present in the Forex Market, as we all know. therefore, risk management should be a top priority for any trader.
One way to manage the risk is by placing stop-loss. This is an entry-level risk management method.
Now placing the stop-loss around support and resistance is easy. You just have to place your SL a few pips above or below the key level.
Let’s take few examples and see how this work.
Have a look at the USDCAD 15-Minutes chart below.
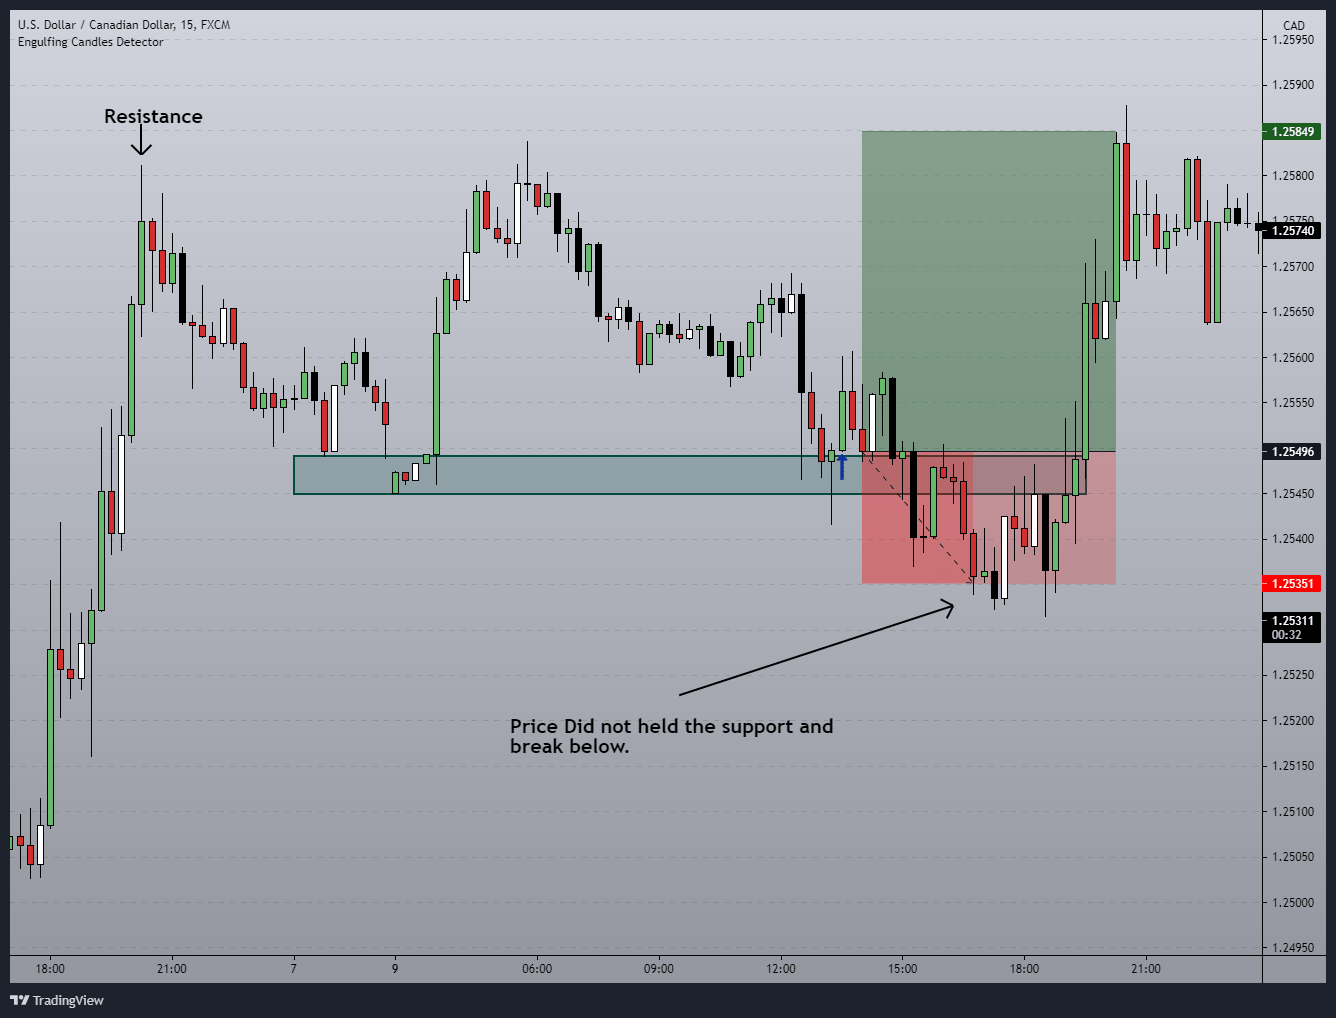
First, we can see that we have a strong near term support level marked in green. On there we got our trade entry which is HHHC candle and since that candle closed a little bit above the support level, I place a buy limit order few pips below that candle. Eventually, the price retrace back down and filled the limit order. Then price did hold the support for two or three candles but right after the next candle, it breaks below the support and hit the stop loss.
Now observe how we placed the Stop loss here. We placed the SL a few pips below the support zone so that we can survive false breakouts and spikes happening in the market.
Next, let’s take another example before move into the take profit part.
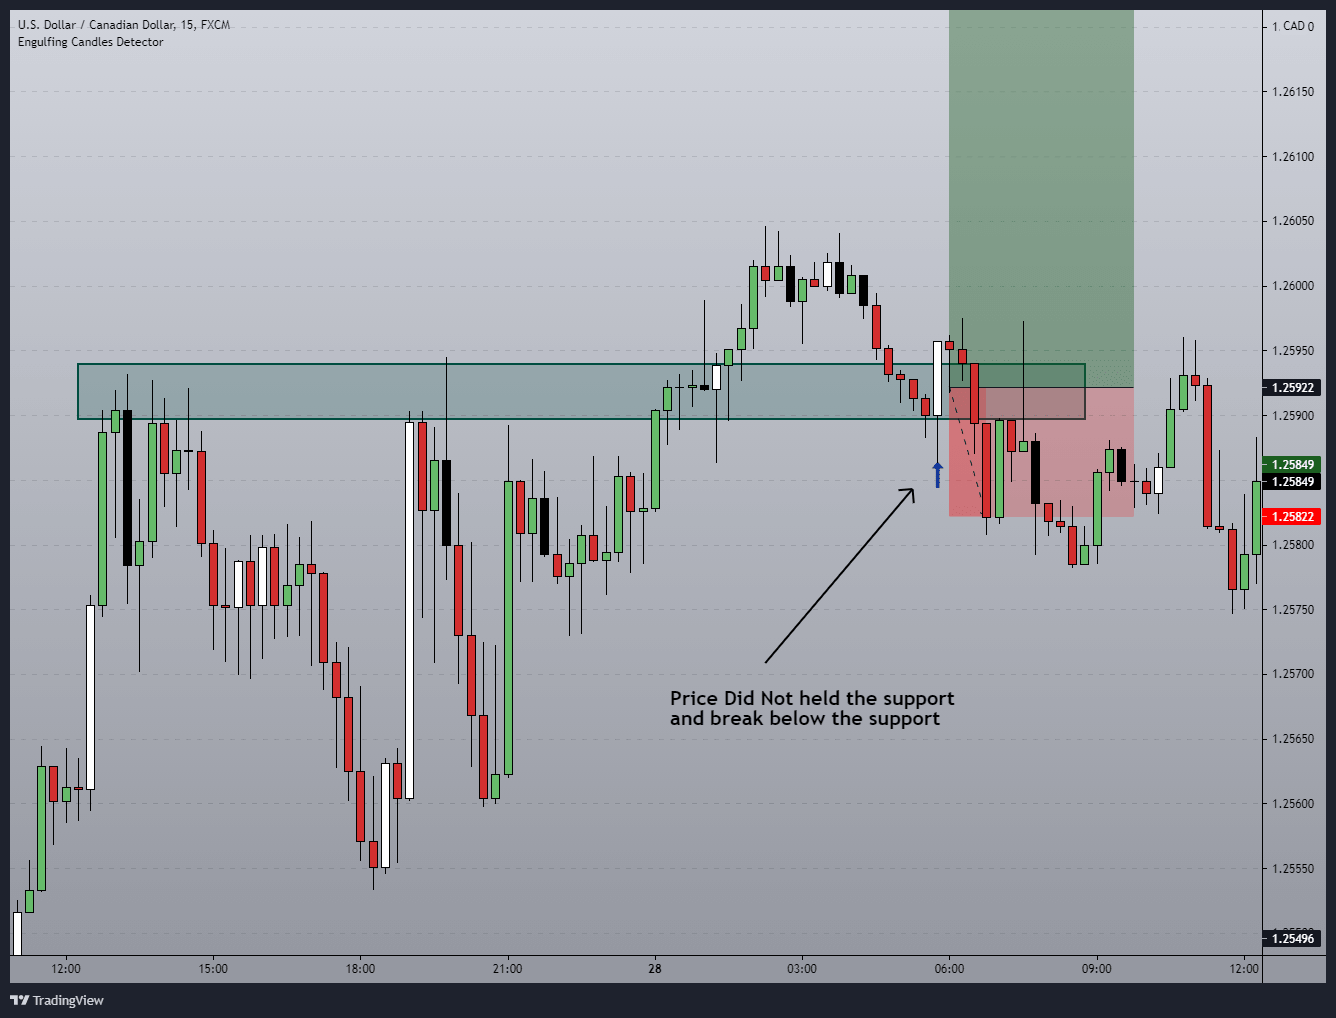
Same as the previous one, right?
We placed the SL a few below the support zone and then what happened there? Price breaks below the support level and hit the stop level.
As you guys saw, trading with the stop loss will help you to have a little bit of control over your losses.
In my trading, I called this Stop Loss which we placed when we are going execute the trade as Initial Stop Loss.
But Why?
Because I’m a risk manager before trader. I followed a very tight set of rules to cut my losses and therefore my Stop loss is not always sitting on the initial position, It will be dynamic. Again will talk about this in the next chapter.
With that in mind let’s talk about how to place take profit.
When we executing the trade, along with the stop-loss, we are going to place the take-profit as well, and I call this take profit as initial take profit level which is 5 times your Stop loss.
For example, if your stop-loss is 10 Pips, then your take profit should be 50 Pips.
Have a look at the chart below.
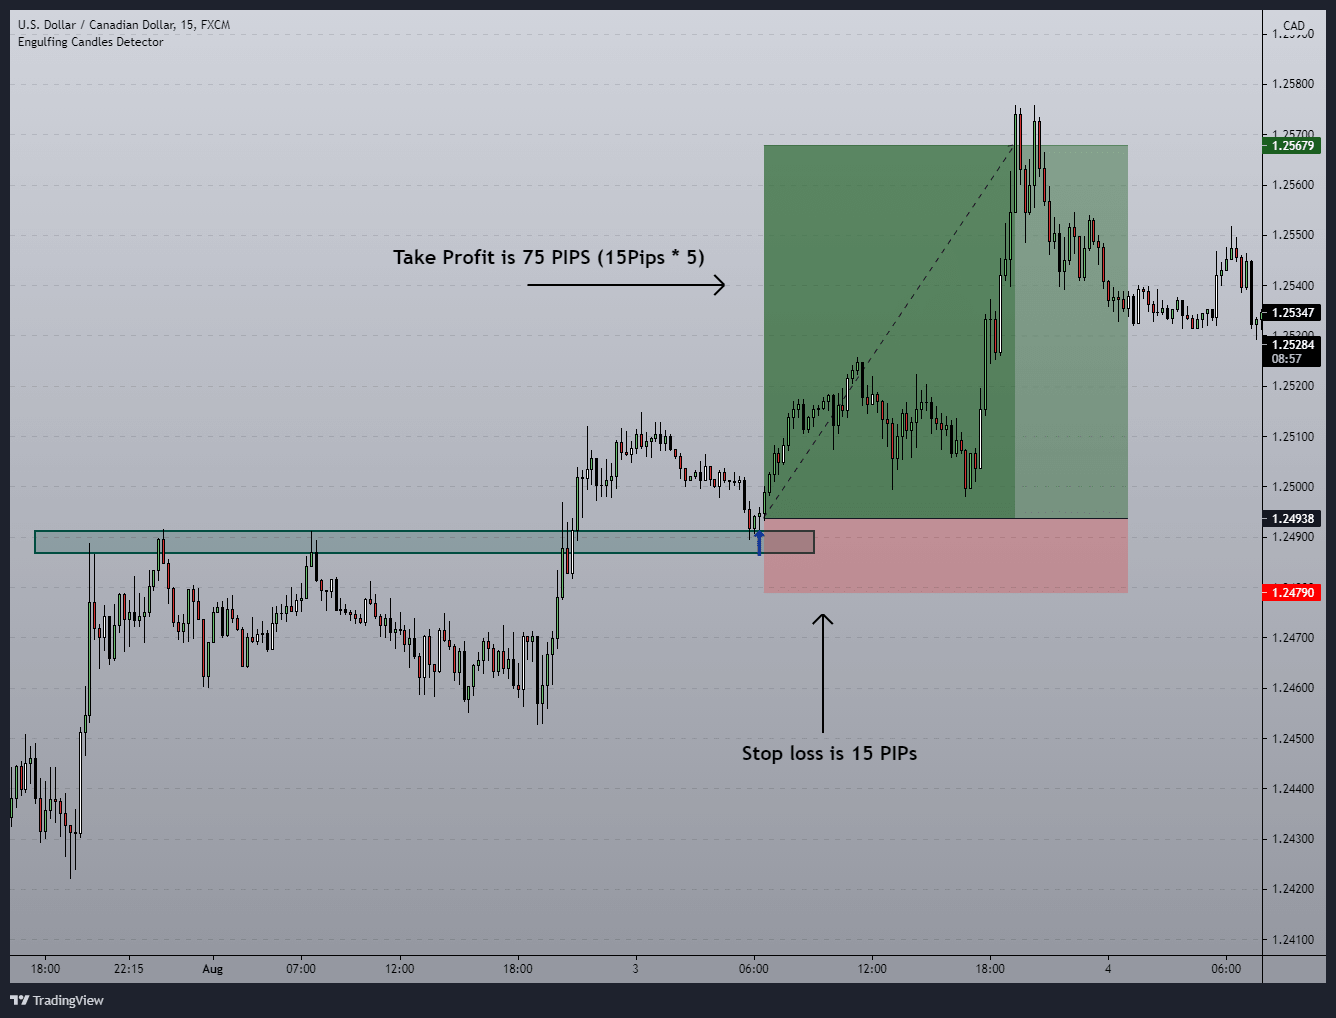
First and foremost, let us admit that this is a brilliant trade with a massive 5R risk to reward ratio.
Now just like the previous examples, we place the stop loss a few pips below the support level. After that placing take profit is simple and it is all about calculating 5 times of that SL and placing the take profit.
In this case, the Distance of the Stop Loss is 14 Pips. Therefore our take profit should 75 Pips which is 5 time of stop loss.
See placing the initial take profit is not a big deal.
Now, since we have quite a long initial take profit level, what happens if the price reverses from the middle of the profit before reaching the trade?
Any plan for that?
Yeah! Of course, we have plans for that and also we have plans to cut the losses as well.
With that let’s talk about trade management which is the most important chapter in this article.
But Before that…
Let me allow you to give an overview of what will going to happen to your trade outcomes if you follow my trade management rules without hesitation.
- Trade 1 – (+5R)
- Trade 2 – (-0.4R)
- Trade 3 – (+1.2R)
- Trade 4 – (-0.5R)
- Trade 5 – (-0.65R)
- Trade 6 – (+1.7R)
- Trade 8 – (+5R)
- Trade 9 – (-0.75R)
Now after the end of 9 trades, you end up 10R in profit. If 1R is equal to 1%, then you will end up with a 10% profit in your hand.
This is the power of “Cutting losses early and letting winners run” and also another example of why I am obsessed with a higher Risk to Reward Ratio.
With that let’s talk about how to manage your trades like a Risk Manager.
How to Effectively Manage Your Trades in Forex.
When it comes to trade management there are two main things to focus on managing after executing a trade.
In my trading, I call those as,
- Cutting losses,
- And Letting profit run.
Ok, let’s get the first and talk about how we can drastically reduce the risk on a trade.
The Art of cutting losses in trading.
In my trading, I used two methods to cut my losses and both of these methods are based on how probability remaining in favour.
The first one is…
4 Candle Method
This is simple. Upon the trade entry, I move the stop loss to half of the initial stop loss. For example, if my initial stop-loss is 10 PIPs, then after the close of the 4th candle, I will be moving my stop-loss to 5 PIPs. This way I can take 50% risk out of the table.
Also, in this stage, when you move your stop loss, make sure it is still below or above the support or the resistance level.
Now, Why the 4 candle method?
Because in trading if support or resistance level is really going hold and bounced, I will be bounced. But if the price still trading around that key level even after the closed of 4 candles, then the probability of bouncing from that is much lower. Therefore we give a trade one chance to see whether the price still has a chance to bounce from that level or not.
If it is not bounced, then there is no problem. Because we already cut the losses, right?
Now have a look at the example below,
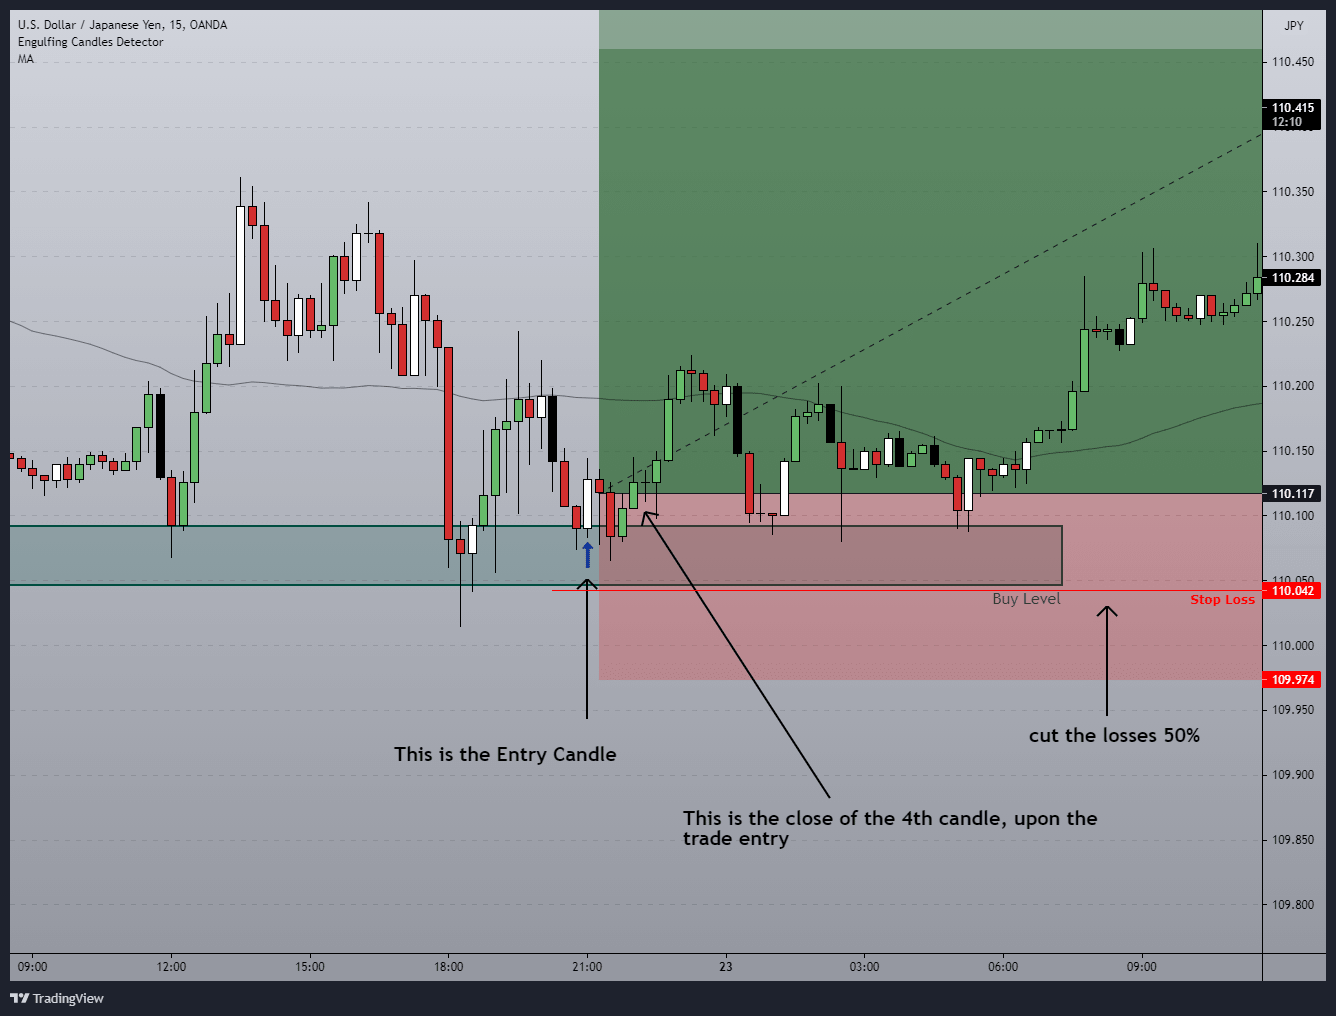
Observe the above chart carefully. Did you get the idea?
Now according to the above chart, we placed a buy trade using HHHC candle. Then we wait for 4 candles to close. Upon the close of that 4 candles, we moved the stop-loss to the middle of the entry and the initial stop-loss level to cut 50% of the risk of this trade. Also, note that the stop-loss is still below the support zone as well.
In this case, the price ended up moving in our favour, But even if is not, we still only lose 0.5R since we believe in probability, and followed by that, we move the stop-loss to breakeven.
This is the first way of cutting the losses.
Next, let’s move into the second one. Which is…
1R Method of Cutting Losses.
Now in the first stage, we cut half of the risk and in this stage, we are going to make our trade a free trade.
In this case, we are waiting for our trade to reach 1R in profit (1R mean – if the stop-loss is 10PIPs 1R is the same distance as stop-loss which is equal to 10PIPs), then we move the stop-loss to breakeven. This way we can take out the risk from the table.
Now let’s take the same example we used in the previous one and see how this is going to work.
Have a look at the chart below.
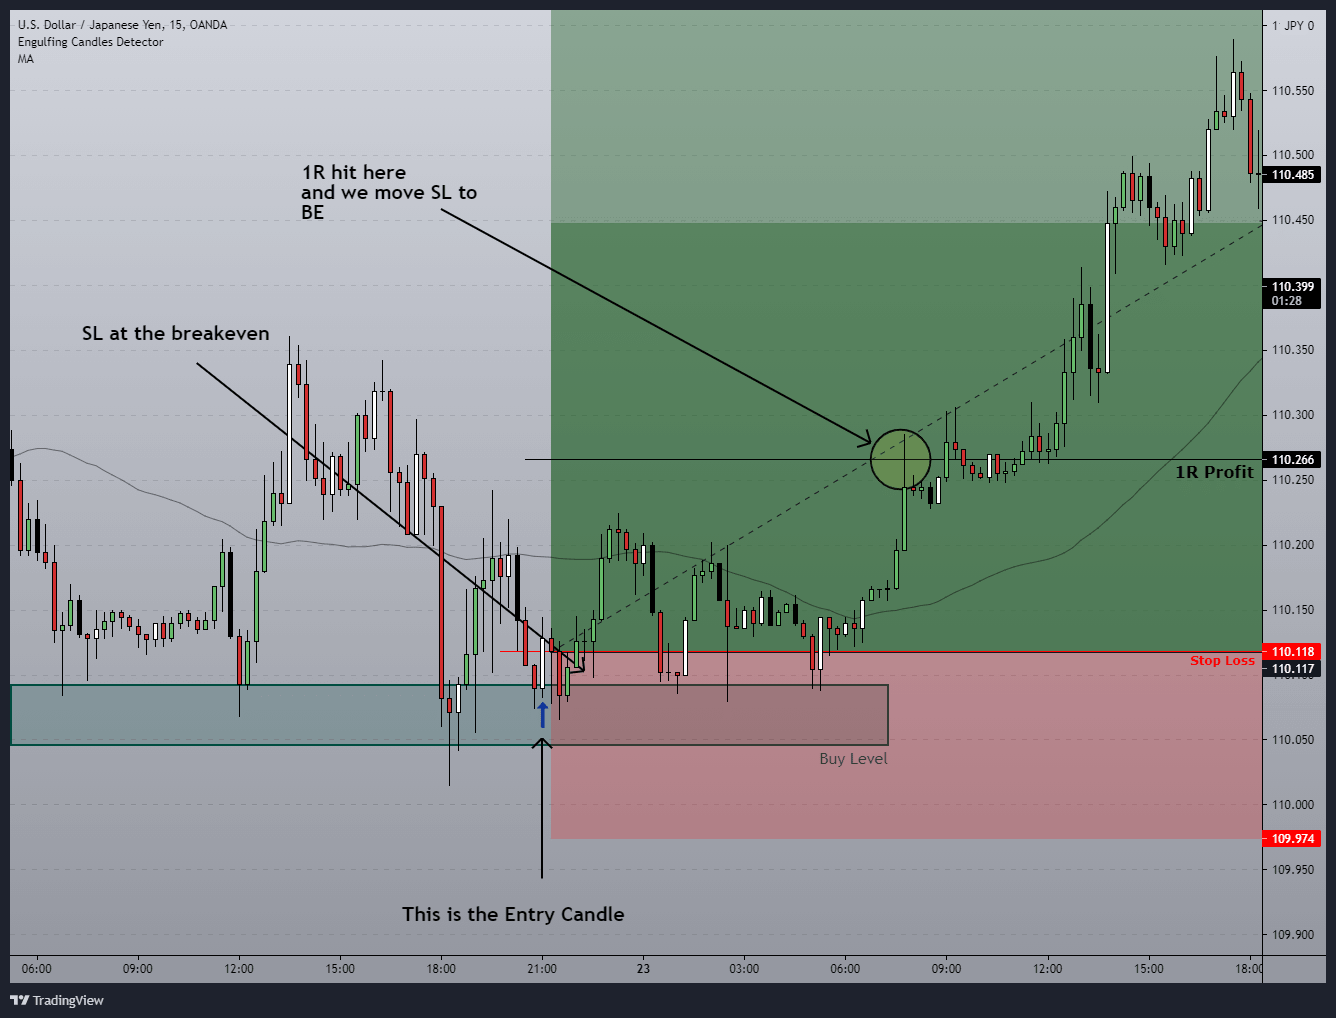
Now according to the above chart, we can see that price reached to 1R level after trading around at the support level for quite some time.
So now the price is reached 1R in profit, so at this point, we should move our stop-loss to the breakeven. This way we can make this trade a free trade.
If you can apply these methods to every trade you are going to take, there is no doubt that you can drastically reduce the risk which helps you make new equity highs when you having winning trades.
With that let’s see how to manage our profit.
How to Let Our Profit Run, So That We Can Win Big
Now as I said, previously, our initial take profit is five times the stop-loss. For example, if the stop-loss is 10 PIPs, then our take profit is 50 PIPs.
While we keeping that 5R take profit, we also need a plan to catch the profit if the price decided to turn in the middle of the trade, right?
That is why I came across an effective plan to trail the stop-loss.
Here is how you are going to trail your stop loss.
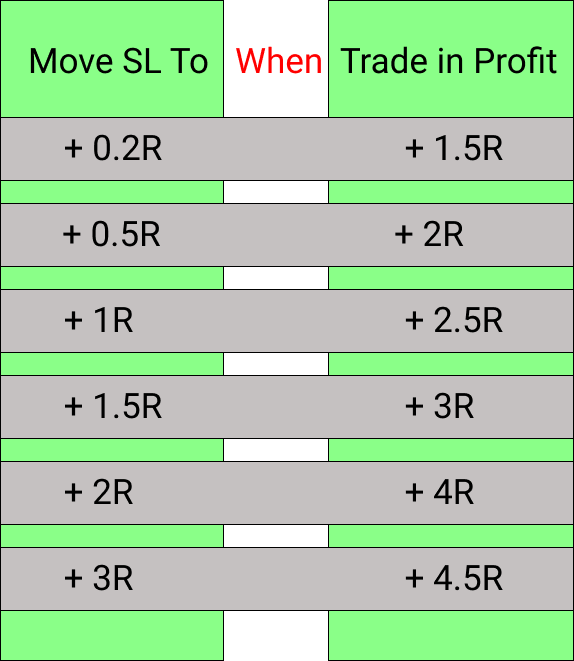
With that, I hope you got the idea of how to manage the trade like a Risk Manager.
Now it is time to end this long article.
Final Thought.
I hope you got something valuable from this article.
In this article, you learned how to draw support and resistance in forex as well as how to trade using this key level while managing your risk like a professional forex trader.
Now it is your turn. Go ahead and test the stuff we talked about in this article to see if this is going to work for you.
Finally, let me know in the comment section, what you think about this article? Do you like it or not.


