Here is the truth: most traders hate to trade in larger timeframes because it is slow, it has fewer trading opportunities and it requires a ton of patience but knowing how to trade daily timeframe in the forex market will increase chances of being a success as a forex trader.
But most new traders are attracted to lower timeframe because they think they can make a lot of money in lower timeframes because of high volatility trading activities happening in the lower timeframe.
But…
There is another group of trader, who trades in the daily timeframes with their busy lifestyles. Traders who trade daily timeframes are more calmly, they can make good decisions because time is on their side.
On the other hand, however, there are another group of traders, who trade on the smaller timeframe with the goal of earning lots of money in the period of 24 hours (Day). Most of the time these traders have to face lots of losing trades and ended up wondering where it all went wrong.
Okay as you probably guessed, we are going to talk about the daily timeframe but also we are going talk about how to forecast price movement in the daily timeframe in a reliable way.
Unlike the other timeframes, you don’t need any MACD or Moving average to gauge the price movement. All you need is patience & Pure price action.
If you are struggling as a trader, by switching to daily timeframe can drastically increase your chances of being a success as a trader. Also, business like this where probabilities matter everywhere, increasing your chances should be your top priority.
By the time you finish reading this post, you will know why I prefer daily timeframe rather than the lower timeframe.
Let’s dive in.
Advantages and Disadvantages of the Daily Timeframe
Just like anything, the trading daily frame also comes with advantages and also with some of the disadvantages.
But at the end of this post, you will find that those disadvantages are “HIDDEN ADVANTAGES” as well.
Okay, let’s talk about some of the advantages in the daily timeframe.
Okay, now let’s talk about some of the disadvantages of trading daily timeframe,
- Trade frequency is very low comparing to something like the 15-minute chart
- To trade daily timeframe you need considerable trading capital
- There is more risk due to the need for a wider stop loss (100 PIP stop loss)
- It’s slow and boring
As a forex trader who trades daily time, I can tell you that all these disadvantages are just a “MYTH”.
Let’s talk about the above disadvantages in detail to find out – are they really disadvantages or not?
There are few opportunities in the daily timeframe
High trading frequency is the main factor that lots of traders, especially new traders shift their trading activities to the lower timeframes.
These traders prefer to take more trades rather than waiting for quality trade setups.
Yeah! I can agree that lower timeframe is providing a good amount of trade opportunities each day, But are they all quality trade setup? No, right.
So, then why risk your trading capital to useless trading opportunities.
Remember that “Quality Over Quantity”.
Anyone who has experience in both lower timeframe and higher timeframe will tell you that daily timeframe is the king when it comes to quality.
My trading account is too small for daily timeframe
This argument is no longer valid. Now pretty much every broker out there offers micro-lots.
With that, you can risk $100 or $50 from your trading capital per each trade regardless of the timeframe.
But you have to know how to calculate the position size correctly.
There are people who trade daily timeframe profitably with a few hundred dollar trading accounts.
But comparing to the lower timeframe your trading capital is more secure in the daily timeframe.
This is because in daily you only take quality trades. But in the lower timeframe, however, you are trading all over the place without understanding what is the bigger picture is.
There is more risk due to the need for a wider stop loss
A 100 pip stop loss? That’s too much!
Calculating your stop loss distance from the perspective of PIPs only tells me a part of a story. Actually, the distance between stop-loss and take-profit is irrelevant.
The only thing that matter is how much you reward compared to the risk or else Risk to Reward Ratio.
Let’s say you are risking 100 pips to make 400pips in the daily timeframe.
Is it possible to risk 100 pips in the daily timeframe with a small account?
Yeah! Of course, as long as you can trade micro-lots, you can definitely risk 100 pips to make 400 pips.
Also, keep in mind that wider stop loss doesn’t affect your reward.
According to the above example, we risk 100 pips to make 400 pips. Although we had 100 pips wider stop, our reward is four times bigger than risk. Isn’t that great?
The daily timeframe is boooring.
Of course, it is. But the Time is on our side.
That means you have a lot of times to make great trading decisions and execute them.
Becoming a consistently profitable Forex trader isn’t about finding the most exciting and fast trading system out there. That is what the casinos are for.
Here is the thing,
“If your trading isn’t boring, Then you may be doing something wrong”
If your goal is to become a profitable forex trader – try to accept the fact that Real trading is boring and slow and that is a good thing.
“Having a quote machine is like having a slot machine on your desk — you ended up feeding it all day long. I get my price data after the close each day” Ed Seykota
Okay, so far we discussed why daily timeframe is playing major roled especially when it come factors like Quality and Reliability.
Now let’s go to the chart and see how to predict price movement in the daily timeframe in a reliable way.
How to Predict Price Movement in Daily Timeframe – Correct Way
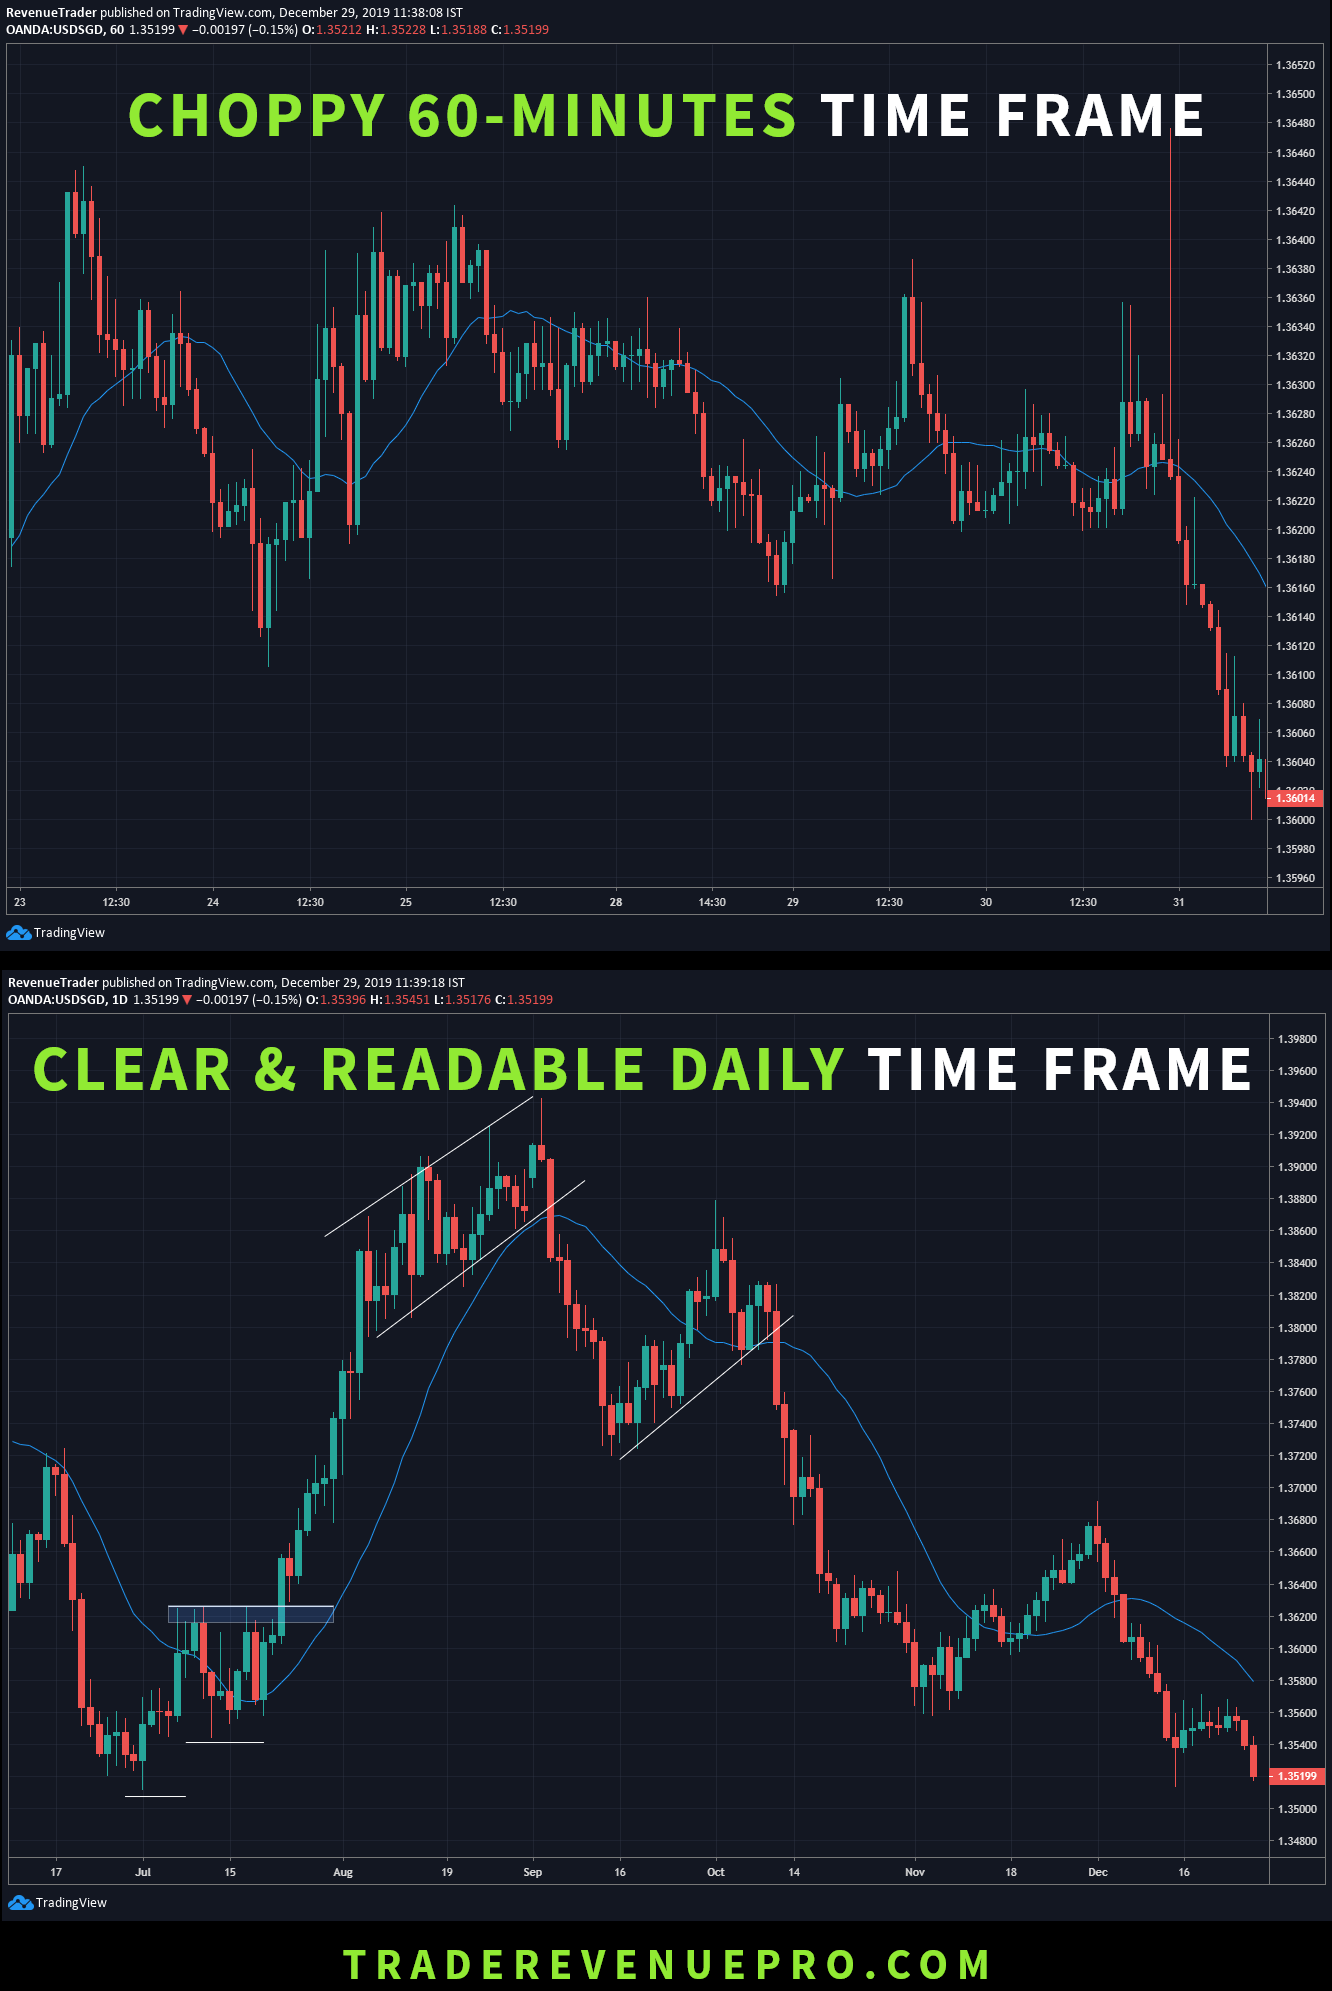
Predicting price movement in the Daily timeframe is more accurate compared to the lower timeframe. This is because lower timeframe is very choppy – It includes choppy movement of news events and lots of hard to read price movements.
In the Daily timeframe, however, price actions are more clear, because It filtered out all choppy movement comes in the lower timeframes.
Also, price actions in daily timeframe have more value than lower timeframes. This is because a Daily candle reflect whole trading activities in a given day or in another word a daily candle reflect all trading activities happening in Asia, London, New York sessions.
Have a look at the two forex chart below.
Okay, Let’s learn how to map out your forex chart.
Mapping Out Your Forex Chart (Daily timeframe)
What is mapping out actually?
The answer is – finding out where is the market heading & who controls the market at the moment.
To understand where the market is heading you need to place support and resistance in your forex chart. Let’s do that.
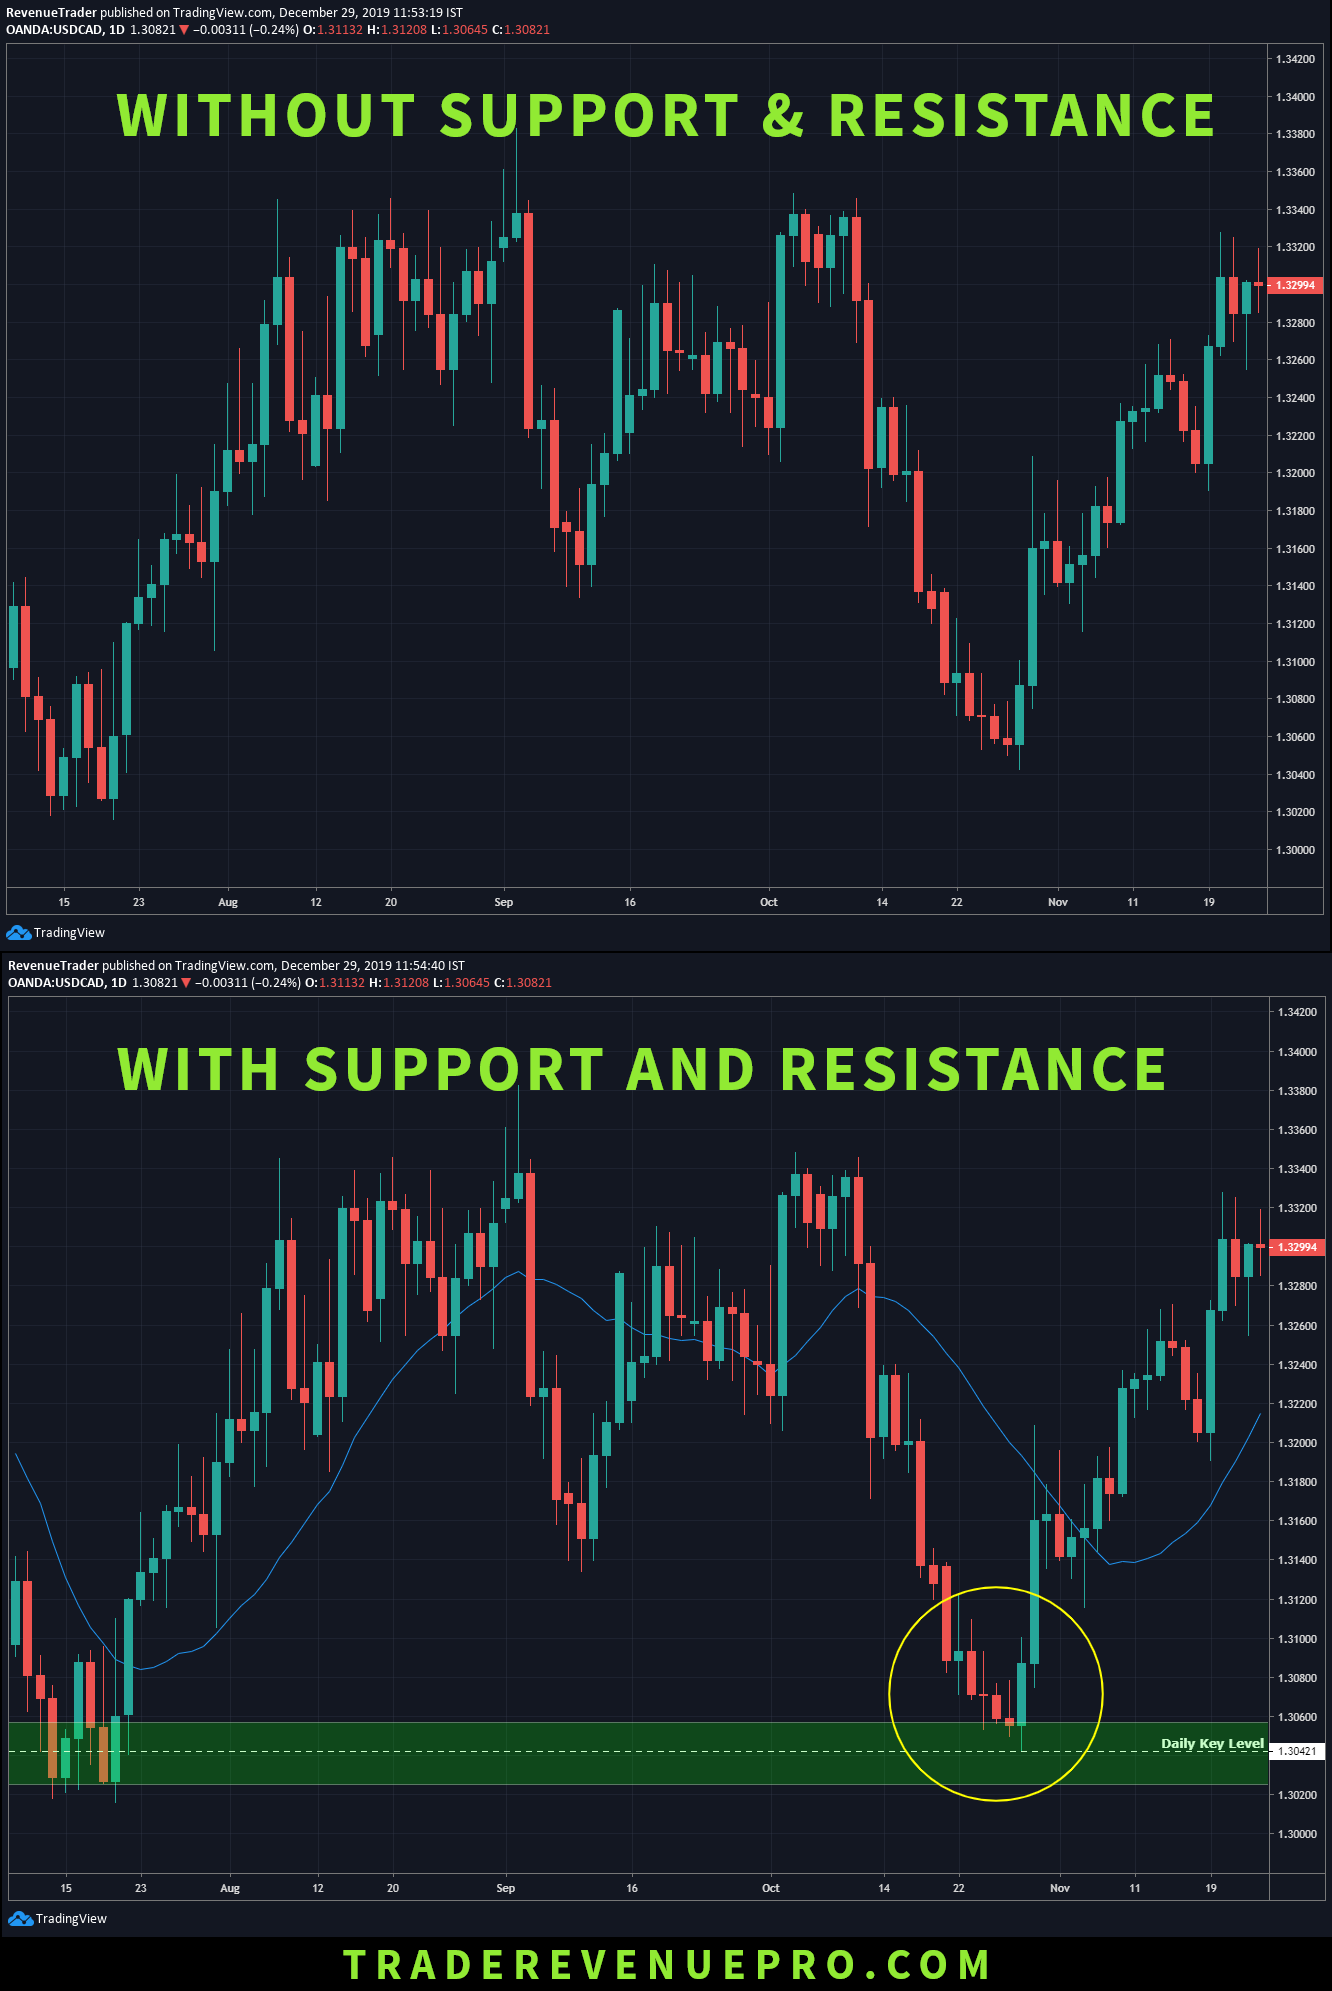
Have a look at the above chart,
We can’t get any clue from the chart without support and resistance. The only thing we can see is bullish and bearish price movements.
But the chart with support and resistance, however, we can clearly see that price is at the level of daily support (yellow circle).
From there we can say, “the price is currently holding the daily level of support, therefore there is a possibility for a market reversal from this support.”
Okay, by simply placing correct support and resistance we can find out where is the market and where it is likely to heading.
But that doesn’t mean the price move higher when it is at the level of support. As a forex trader, we need more confluence to buy at support levels.
Okay, now you know where is the market and what are the possibilities for future price movement.
Let’s learn how to find these support or resistance levels is actually going to hold or not?
Observing Candle Strength at Support or Resistance Levels
By observing candle size at the support and resistance levels will give you clues about how buyer and seller behave at the support or resistance.
If you spot candle are getting smaller and smaller when it getting closer to support level, It basically saying sellers are losing their control over the market at the support and at the same time there are buyers who are willing to buy at the support.
Have a look at the chart below.
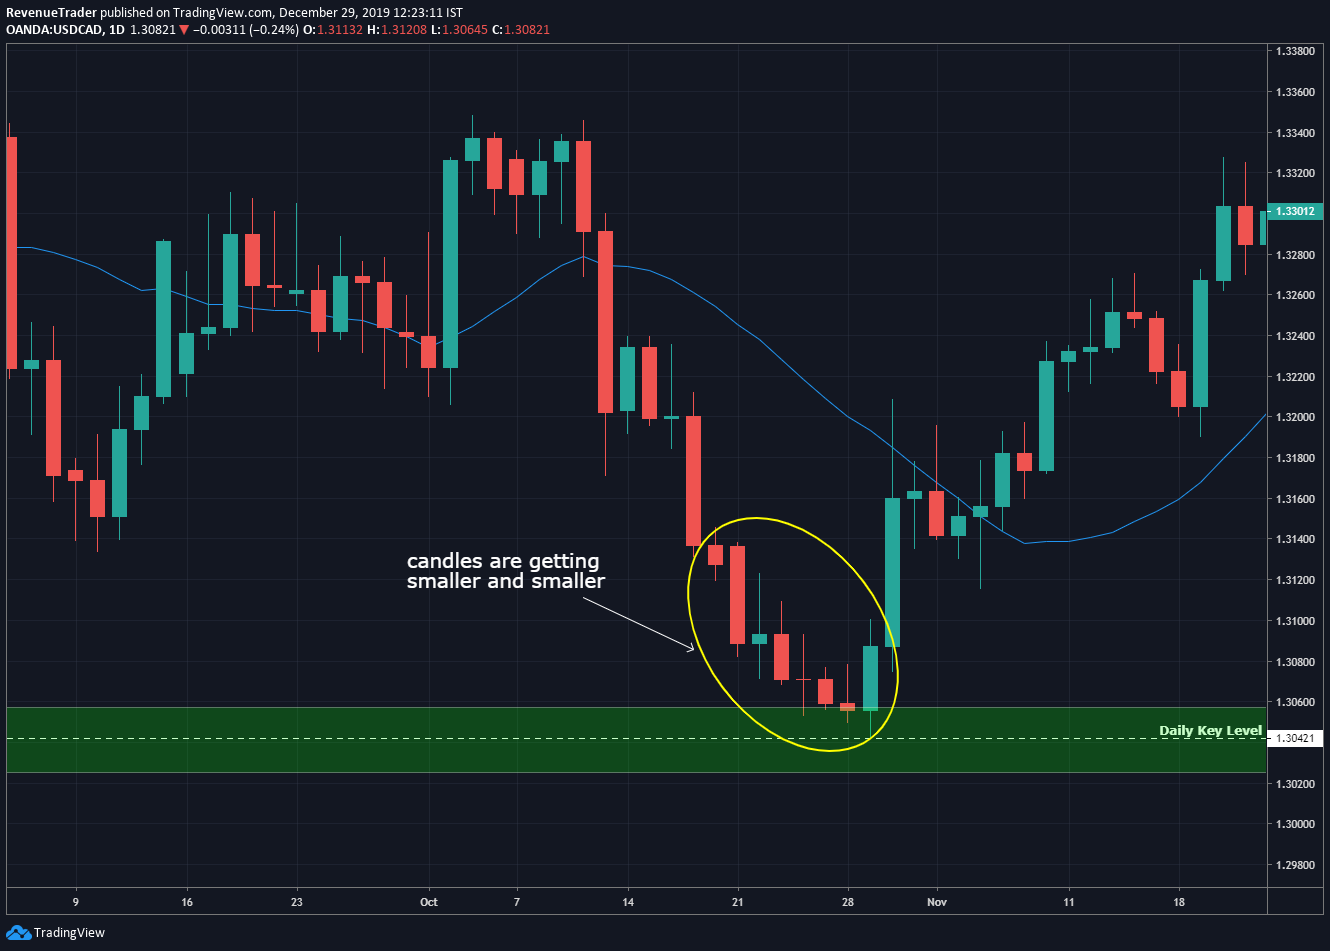
This is the same chart that we used above. Have a look at the yellow circle. Did you notice anything?
The yellow circle shows candles are getting smaller and smaller when it comes to the support level. (Green zone) which is a great indication that saying sellers are losing momentum at the support and at the same time buyers are buying at the support.
Now you already got very import clues about this support (green zone) level.
Now we have to wait for buyers to step in before buying at the support.
This is where price action signals come in.
Confirming Price Direction Using Price Action
Let me take the same example we used above.
Have a look at the chart below. Did you spot any Price action trade setup? If yes, pat on your back.
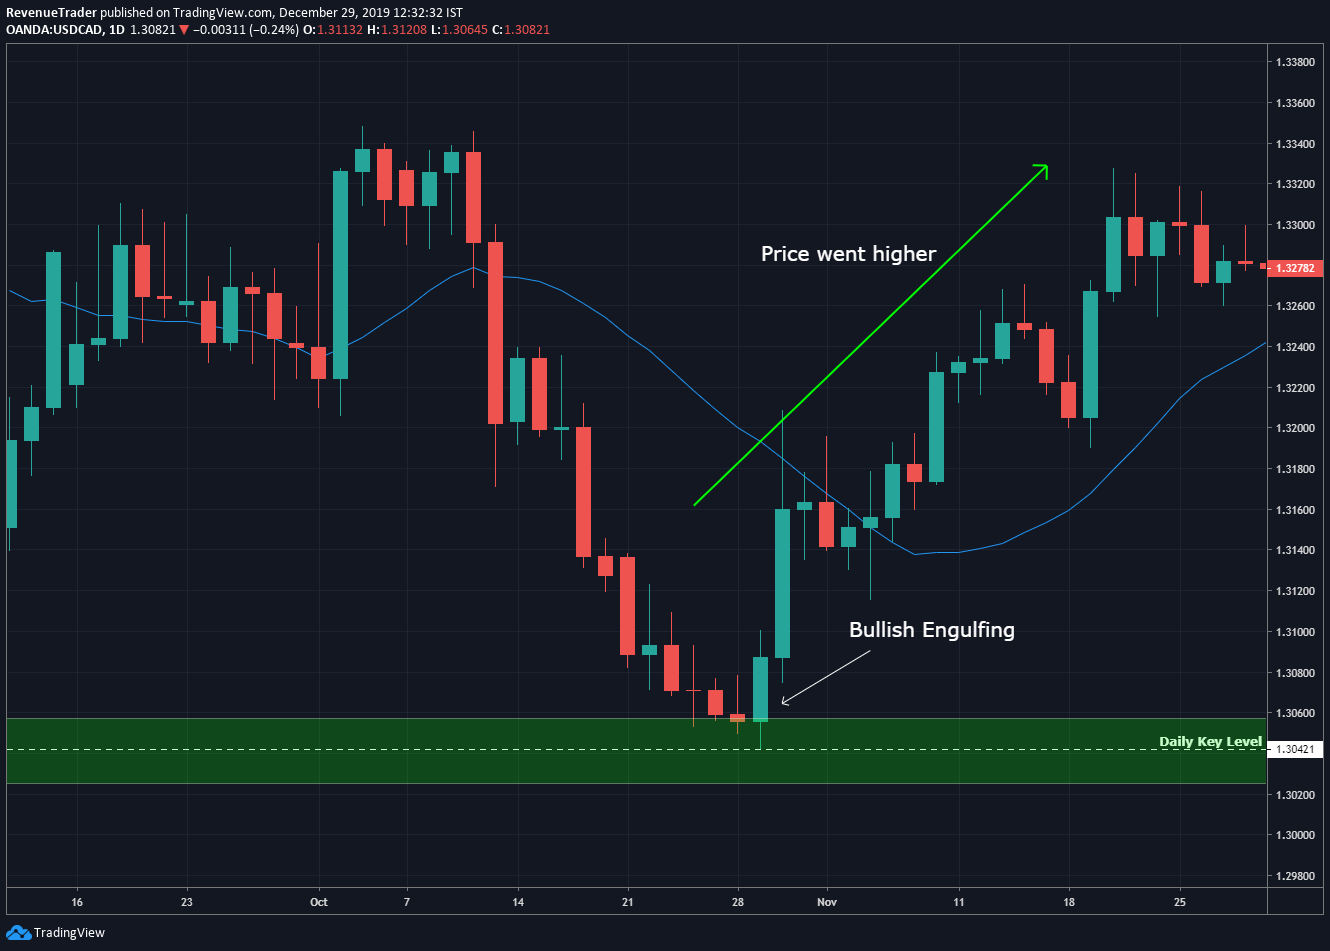
Look at the indecision candles at the support. What are they saying? Indecision between buyers and seller. Simple is that. What happened after the indecision?
A Big Bullish Engulfing candle saying that buyers are stepped in into the market at the level of support which is a good indication to say that price is going to bounce from this support level and it went up like a rocker.
See these are simple prediction made by utilizing support, candle strength and price. This is why your trading methodology should be simple.
Now have a look at the few chart example below to understand further.
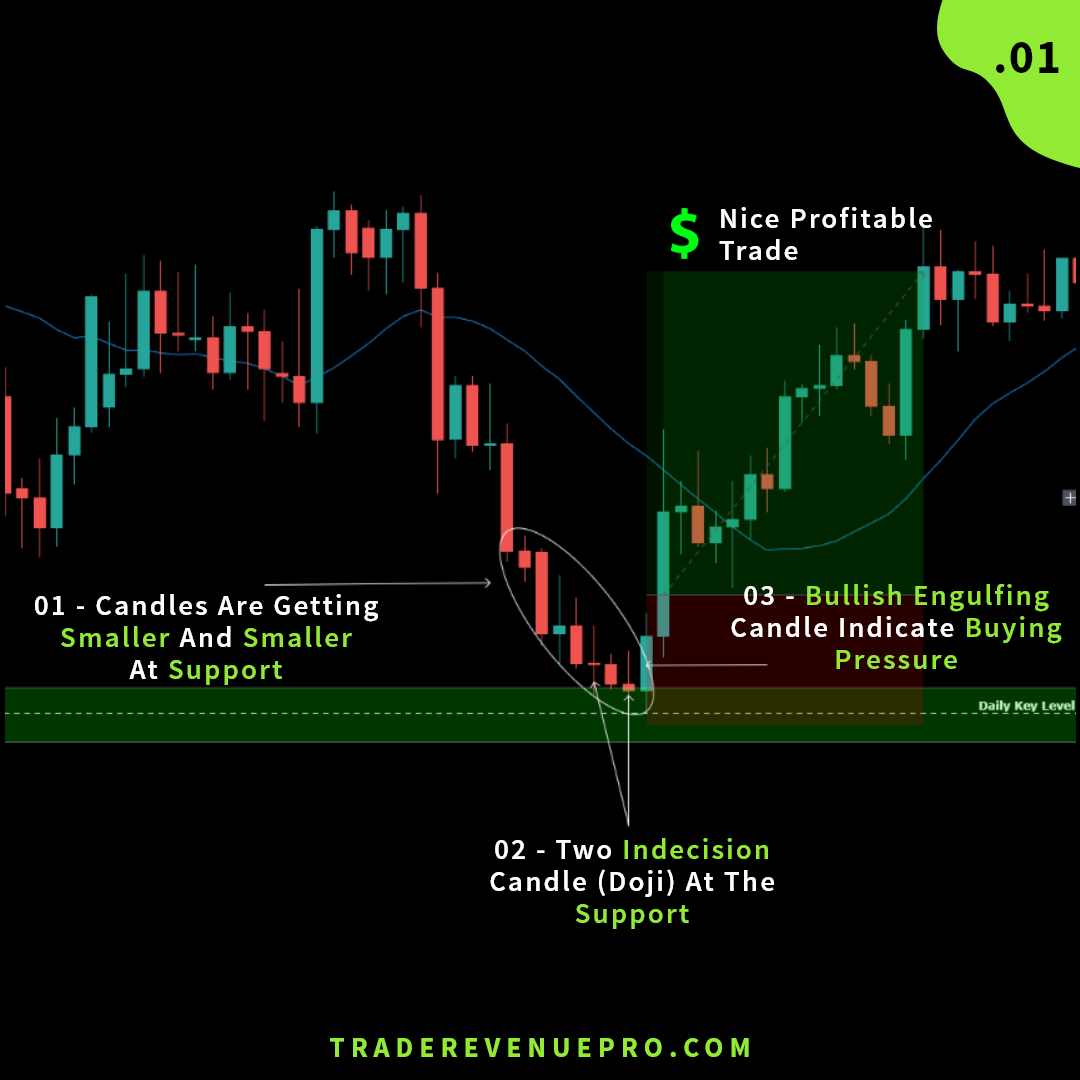
Example #1 – Buying at the support level
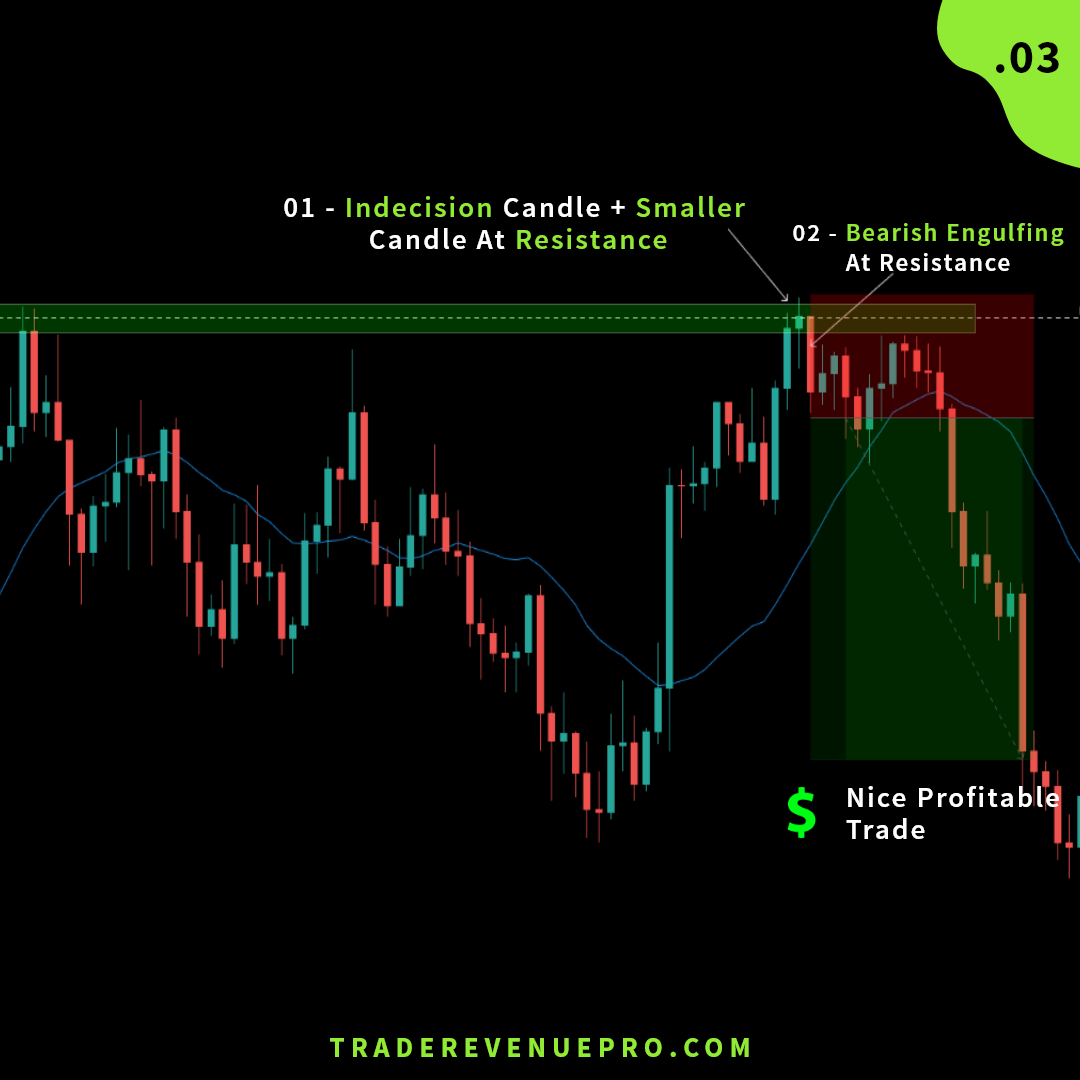
Example #2 – Selling at the Resistance
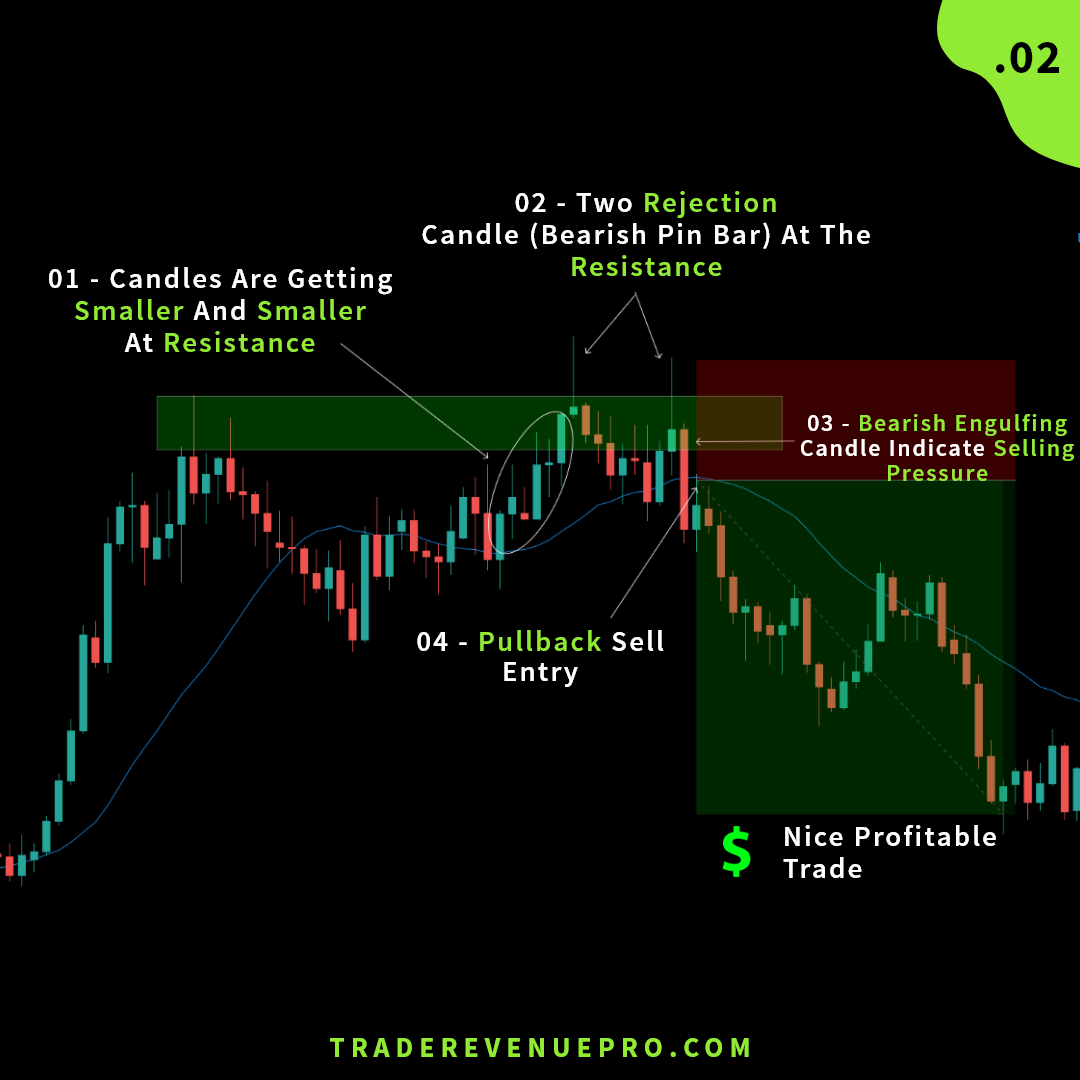
Example #3 – Selling at the Resistance
If you like these types of analysis make sure to follow us on Instagram.
Final Words
As you saw we didn’t use any complicated trading method to analyze and forecast future price movements.
We used the daily timeframe and pure price action. That’s all.
I’m sure you have tried so many complicated and (or) expensive holy-grail trading systems at some point of your trading career and afterward realize that they weren’t provide the result how you had thought.
In forex trading, The simplicity is the most overlooked aspect to profiting long-term.
So what is the point here,
As a forex trader make sure to keep all the aspects of your forex trading simple – from the way you think and the way you place the trades.
Now try to go through all forex pairs and apply the concept we learned here. Make sure to do it in the Daily timeframe.
Conclusion
- Daily time frame is more accurate compared to the lower time frames.
- As a trader, we have lots of time to plan and execute our trade idea in the daily timeframe.
- We can predict price movement in daily time utilizing support/resistance and pure price actions more accurate than a lower time frame.
- We have lots of benefits as a daily time frame trader.
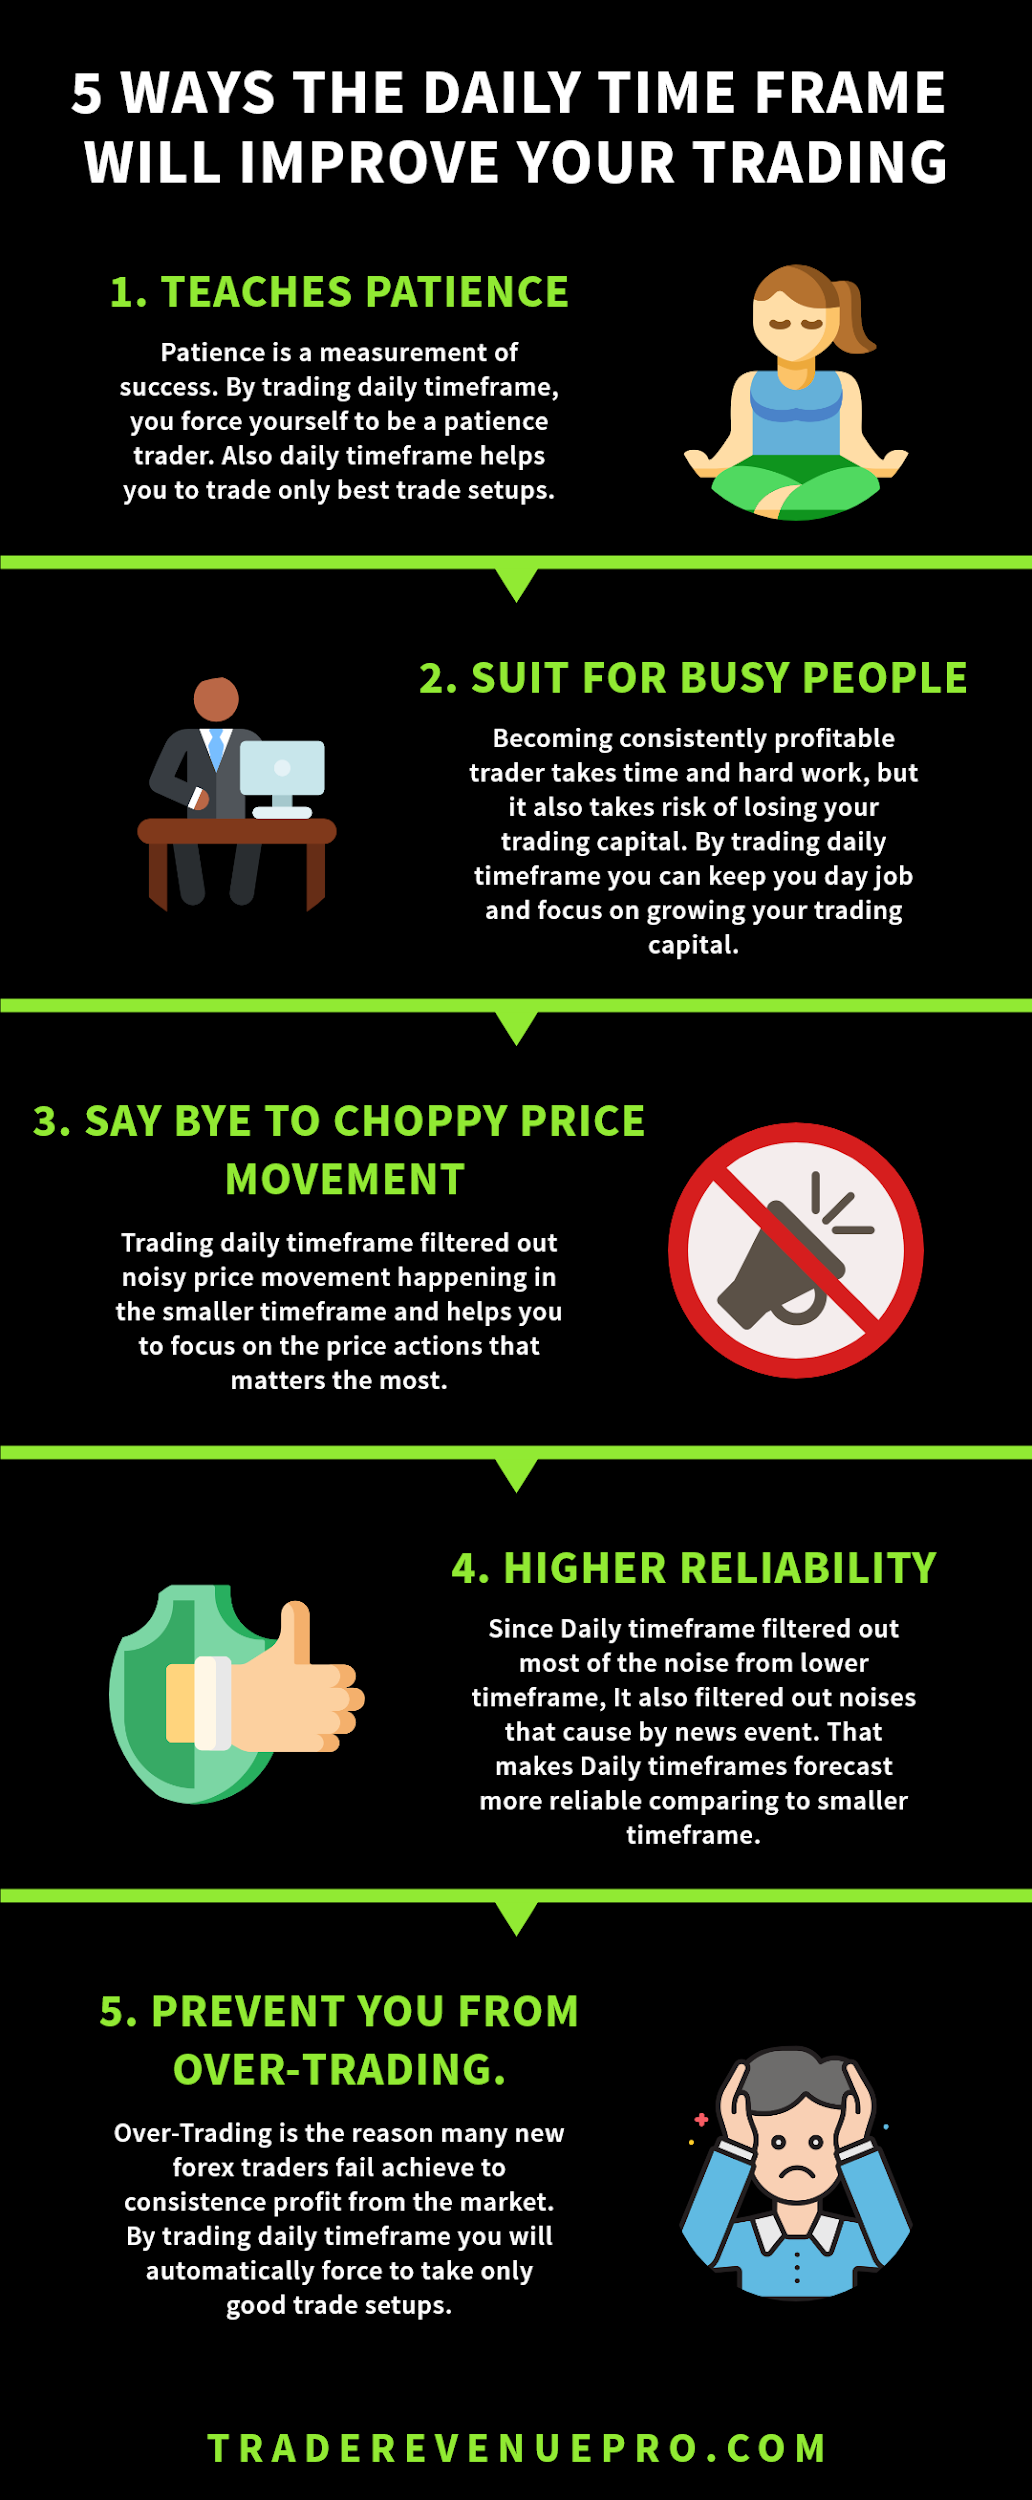
- It teaches patience
- It suits for busy people
- No more choppy price movement
- It has higher reliability
- It prevents you from over-trading.
- We also have some disadvantages in the daily time frame. If we do deep research we can clearly find out those are actually Hidden advantages as well.
- In forex trading, simple trading systems can outperform any holy grail system out there.


7 Responses
clear and precise. easy analysis
Glad you found it helpful, terrence.
enjoyed reading patiently and found it informative.
will give me more time to analyse trade
Thank you for the great work
Very helpful to me as a beginner
I admire your simple method of teaching thanks for that
Glad you found our website helpful