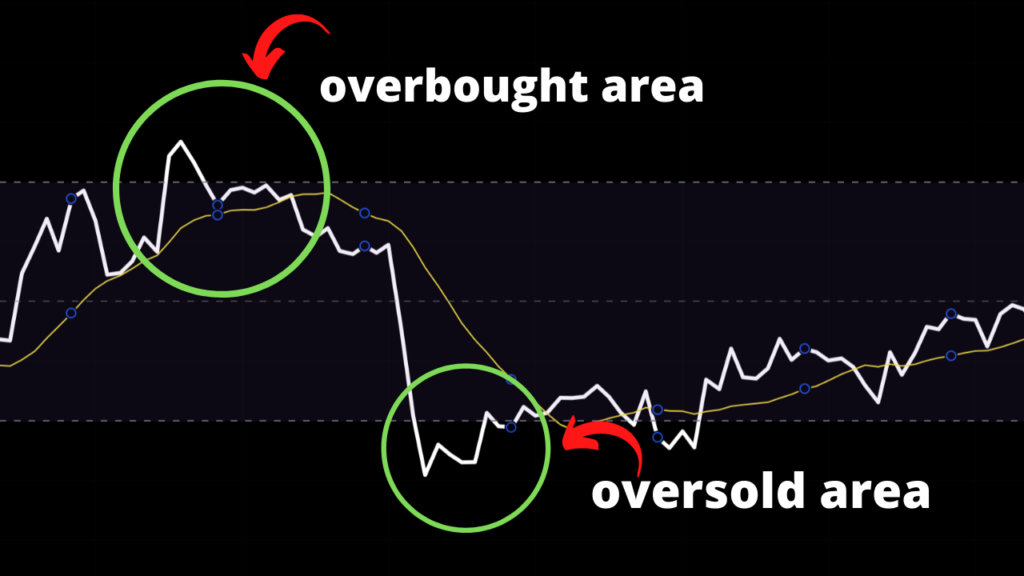
the RSI indicator effectively can be used if you understand the overbought conditions and oversold conditions. If the market is in an overbought condition there is a high probability of retracement. If the market is in an oversold condition probability is towards a pump.
There are a lot of traders who use RSI to trade crypto/forex effectively.
when the RSI value is above the 70 % level it is called an overbought situation, if it is less than 30%, oversold situation.
but you should keep in mind there can be some false signals.
price can continue to extend above 70 or below 30 for extended periods.
so the best practice is to combine the RSI indicator with other indicators always. It is very difficult to trade with RSI along.
Take away points:
The most important levels in RSI are 70 and 30 levels
if RSI is above 70 it is overbought
if RSI is below 30 it is oversold.
but there are false signals so, always combine them with other indicators.
what is the rsi divergence pattern :
divergence is asset price and RSI move in two directions.
divergence pattern is a good trading opportunity.
what is bullish divergence rsi :
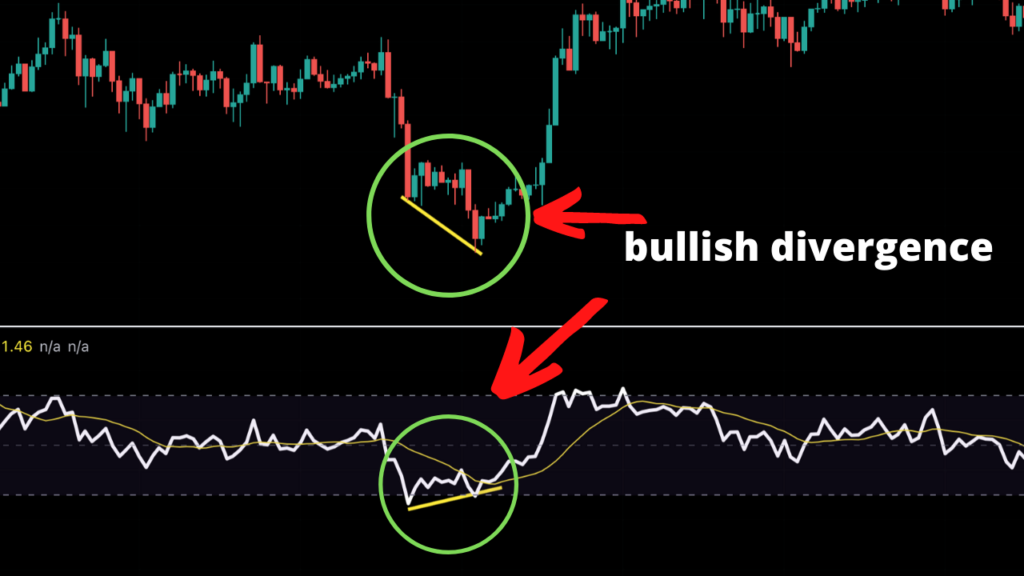
bullish divergence is a positive divergence.
when asset price goes low but RSI rises, it is called a bullish divergence. this is a good clue for an upward price reversal.
what is bearish divergence rsi:
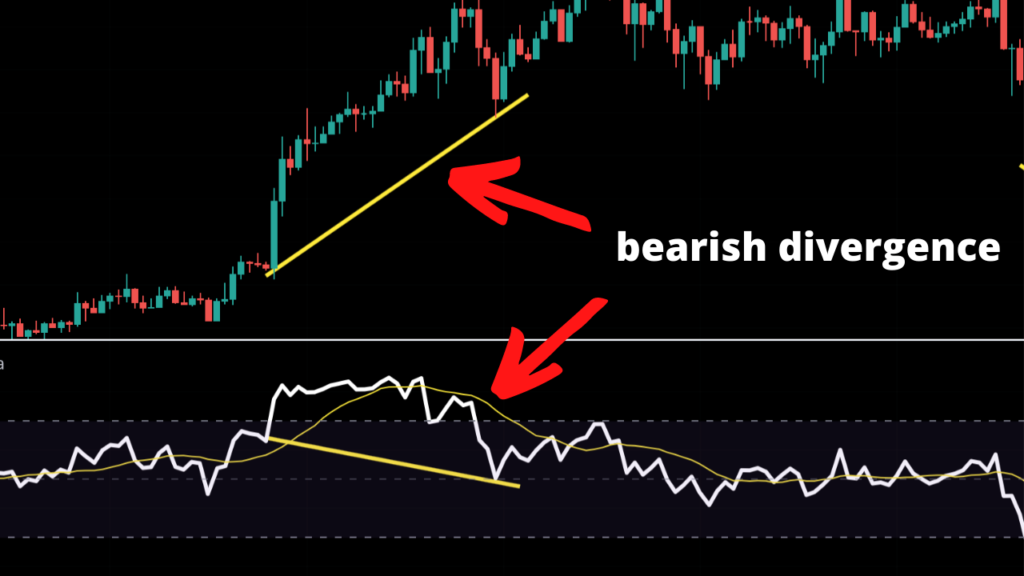
bearish divergence is a negative divergence.
when the asset price is going upward but RSI going down it is called a bullish divergence.
this is a good clue for a downward price reversal.
how to use rsi for day trading
what is day trading:
day trading is buying an asset for a low price and selling for a higher price on the same trading day.
it is very important to find the lowest possible price and highest possible price.
you can use the RSI indicator for that.
in day trading no need to do a lot of trades, but only a few trades with good profit margins.
using the RSI indicator we can find good antra trading opportunities.
A simple strategy is buying when it is in an oversold area and selling when it is in an overbought area.
but it is better to combine this strategy with a few other indicators for successful trades.
best indicators to combine with are, moving averages, money flow index,


