Welcome back to the weekly market analysis of Trade Revenue Pro. Today we have two trend reversal trades on AUDNZD and EURJPY. Both of these trade setups were building from the middle of the last week. At the moment trade opportunity on AUDNZD is almost ready to break above the neckline, while the trade on EURJPY is still in a developing stage.
But first, let’s review the USDCHF trade idea that we talked in the last week.
Did you get into that trade? Let me know in the comment section. For me, it was a rough trade and the trade is still running.
Have a look at that trade below,
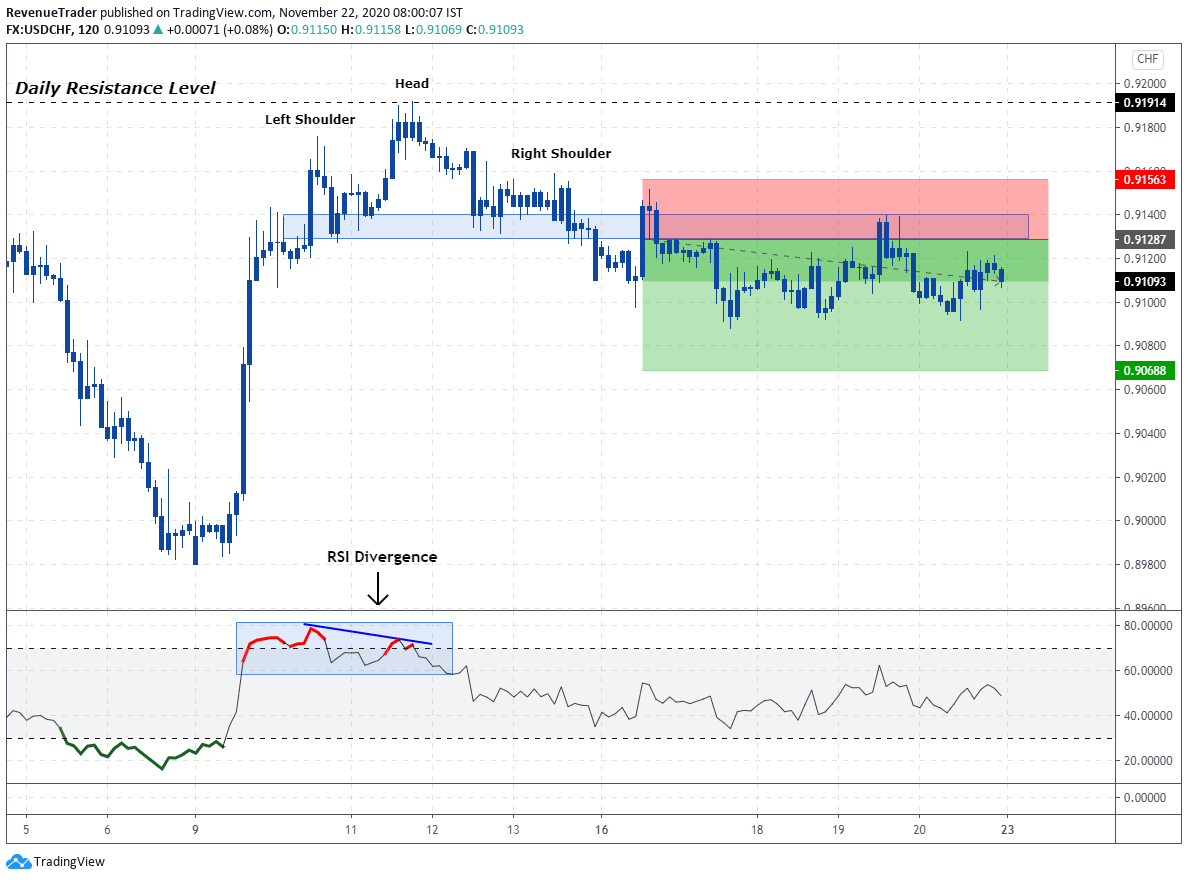
As you guys can see, after the entry, the price was moving in sideways, and still, the price is in range.
I did move the stop loss to breakeven on Friday. So at the moment, there is no risk associate with this trade.
There is one thing I need to talk about before we start talking about the trade ideas for the week ahead.
That is a lesson hidden inside the above trade on USDCHF.
When we talk about this trade idea on the last week, this trade seems to be a textbook trade idea, right?
But have look at it now. It is moving sideways, even the price actions are not aligned with technicals.
This is not a rare thing in forex trading. This can happen any time on any trade. Therefore stop picking perfect trades. More importantly, never bet higher on the trade that you think perfect ones.
There is no perfection in the forex market. That is the reality. Sometimes the ugliest trade can be the most profitable one. So, rather than spending time on weighing, judging, doubting, perfecting and fine-tuning, be there, available and ready when those opportunities arise.
With those things in mind, let’s talk about the trade ideas for the week ahead.
Disclaimer: Trade Revenue Pro’s view on the Forex Charts is not advice or a recommendation to trade or invest, it is only for educational purposes. Don’t Blindly Buy or Sell any Asset, Do your own analysis and be Aware of the Risk.
Keep in mind, These are Just Market Predictions and not a Trade Signal or Trade Ideas, At Trade Revenue Pro We are Using Daily Time Frame to Identify Major Price Movements and Push Down 4-Hour Time Frame to Get Favourable Risk to Reward For Our Trades, Furthermore, We are Using Tight Risk Management Method to Preserve Our Trading capital.
AUDNZD – An Inverted Head and Shoulders Pattern at Daily Support
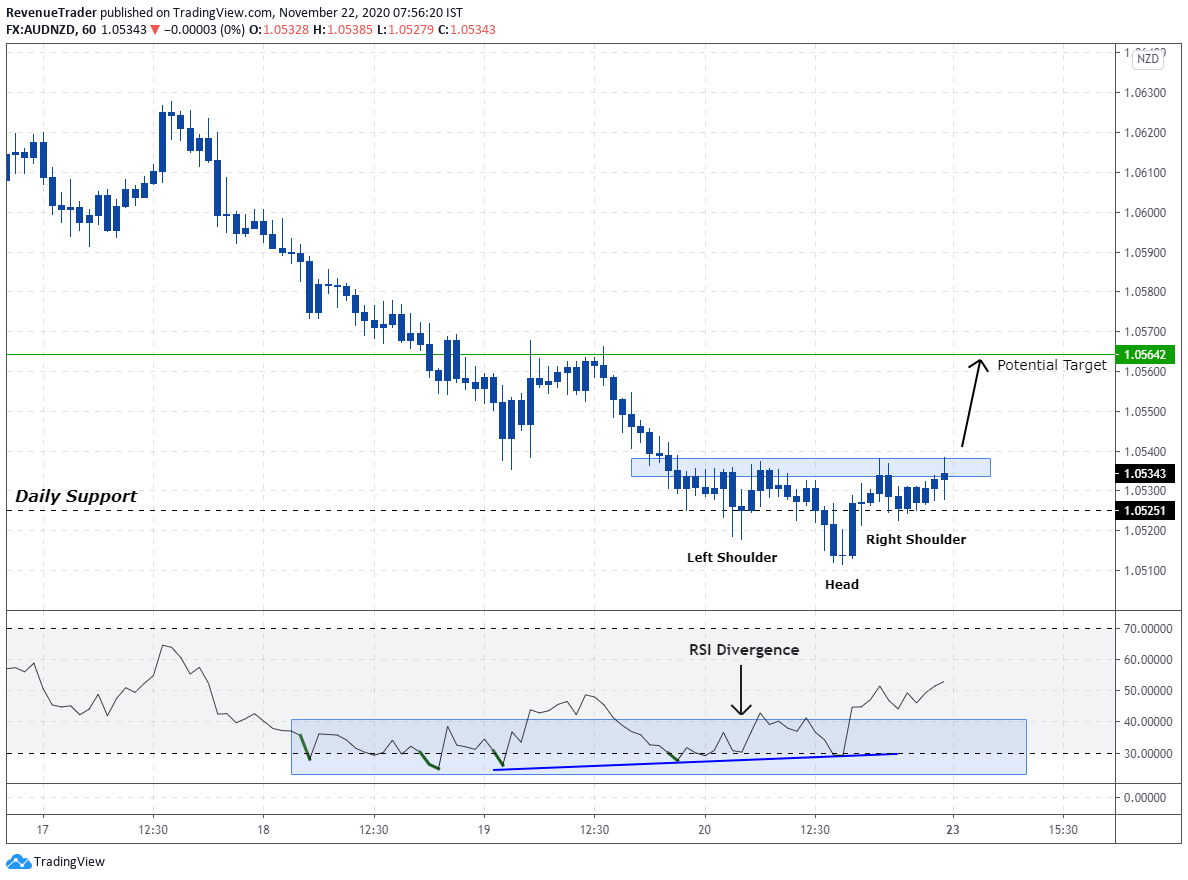
Key Level – As the above showed, the ongoing downtrend struggle to keeps moving down as price met with the support level at 1.05251 comes from the daily chart. Sellers tried to drive the price down twice, but the sellers failed both times.
Head and Shoulders Pattern – Sellers behaviour around the support level confirm that it was a support level where buyers are interested in going long. An inverted Head and Shoulders Pattern itself has a reversal characteristic. Since this pattern formed around support level and at the end of the downtrend, we can say that there is a higher probability chance of a trend reversal.
RSI Divergence – RSI Divergence also indicate the lack of selling momentum and this is an additional confluence for our trade idea.
Market Forecast – Daily Support level, inverted head and shoulder and RSI divergence, all of these trading confluences are aligned with each other perfectly. Have a look at the inverted head and shoulder pattern. It is about to break above the neckline. If that happened, the possibility of occurring bullish momentum is much higher.
Trade Idea – If price break and closed above the neckline, we will consider going long by targeting 1.05642 level.
Related: Head and Shoulder Pattern in Forex – A Reversal Trading Strategy
EURJPY- Higher Low at Daily Support Level
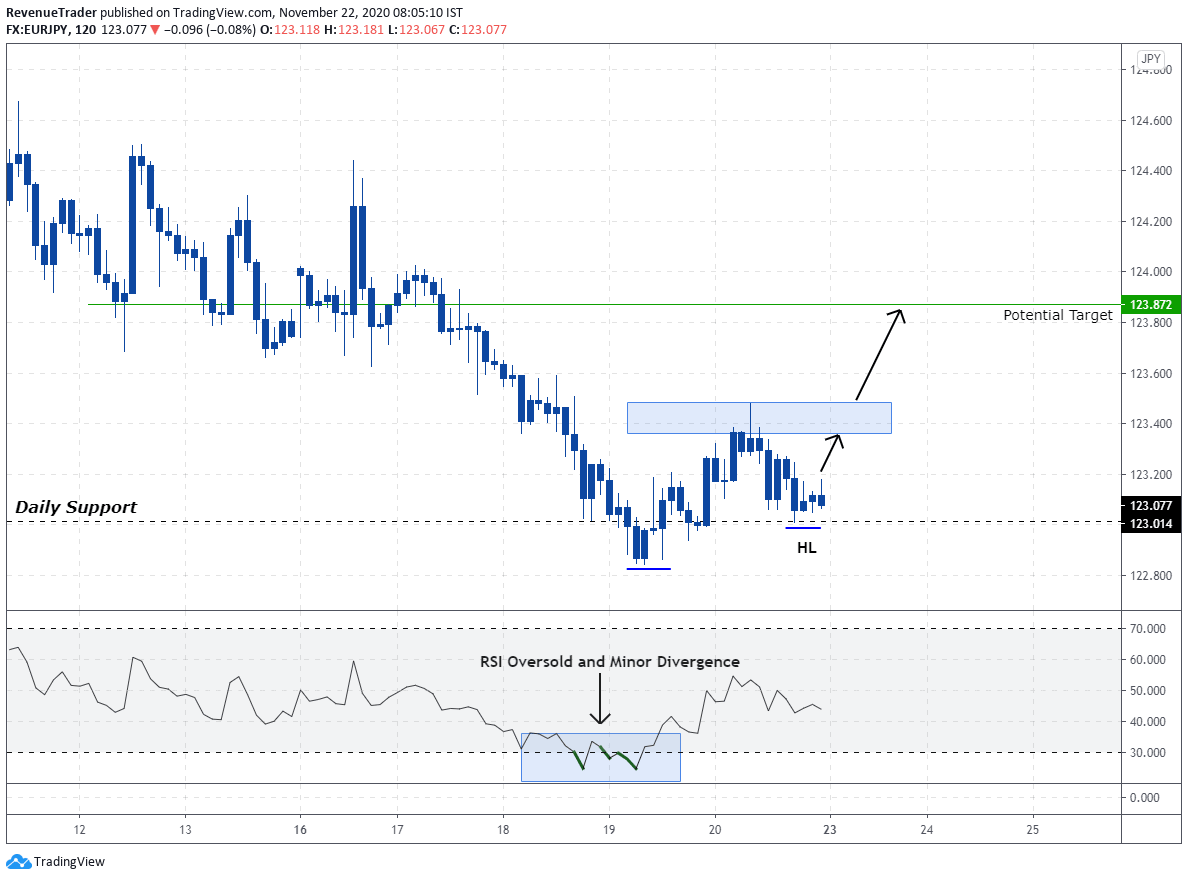
Key Level – Once again the same behaviour, Sellers face difficulties to move price further down from the support level at 123.014 come from the daily chart.
Higher Lows – Have look at the higher Higher Low marked in the chart. If price able move from the marked HL level to local structure level, that confirm the validity of HL. If that happened there is much higher for a trend reversal.
RSI Over Sold and Divergence – In this case, we have a hidden RSI divergence but a valid one. This confirms the lack of selling pressure at the daily support level.
Market Forecast – All three confluences are aligned here as well. But have a look at the HL. It is in the developing stage. To confirm the validity HL price need to move up to the local structure level. If that happened, all we need is a break above the neckline. But if the price continues to move down HL will be getting invalidated and we can also expect a continuation of the downtrend as well.
Trade Idea – If price pushes higher and break above the neckline, that confirms the validity of our trade setup. In this case, we looking to buy on a retest of the local structure level targeting 123.872 level.
Head over to our Trading Blog to learn more about how to trade forex with Proven Trading Techniques and Strategies.
Want more Trade Ideas – Head over to Trade Idea Page.
That is all for this week and If you want constant trade updates – consider following us on Tradingview.
Also, consider following us on social media and Pinterest, Instagram and Facebook.


