Last week we were looking at AUDNZD and CADJPY. In these two currency pairs, AUDNZD trade opportunity was invalidated since price actions on AUDNZD start to move in sideways. On the other CADJPY was a nice profitable trade wich allow us to banked little over 2%.
As considered in the last week market analysis we placed a long trade after the breakout and retest of the local structure level. Have look at that CADJPY trade in the chart below.
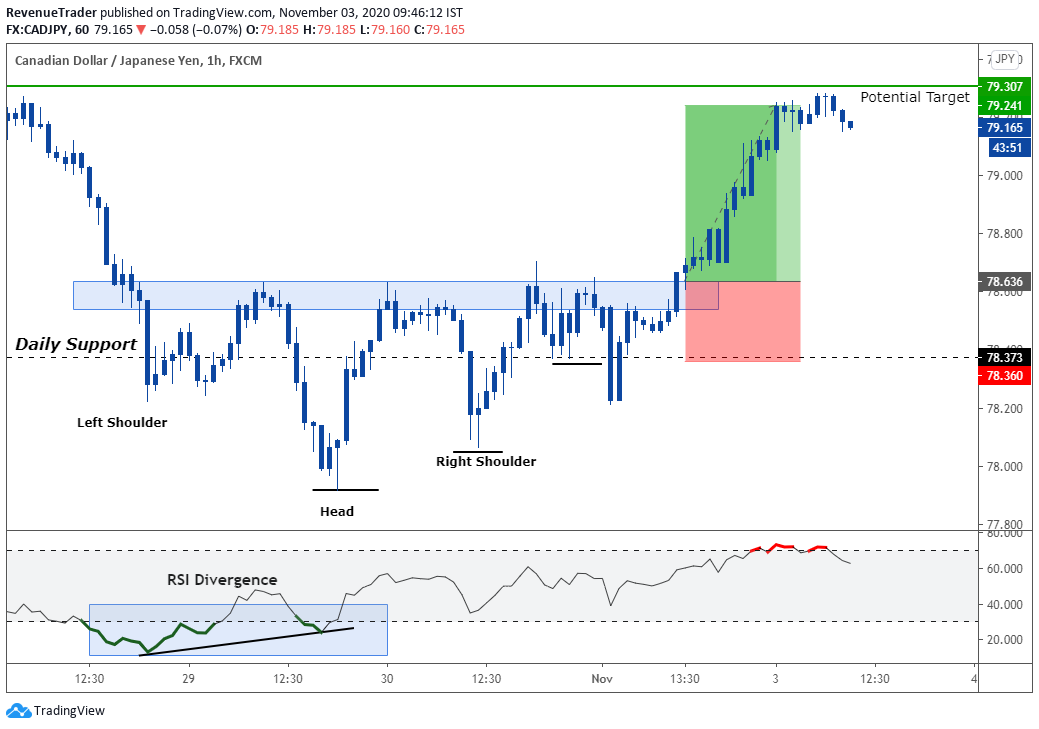
Have a look at this trade on Tradingview.com to see how we enter and manage this trade.
As we talked earlier AUDNZD trade was invalidated as price action starts to move in a sideways manner. But in the midweek AUDNZD formed a short term bullish trend which leads to a higher probability trade idea for this week.
Okay, let’s see how we can trade AUDNZD and GBPAUD in this week.
Disclaimer: Trade Revenue Pro’s view on the Forex Charts is not advice or a recommendation to trade or invest, it is only for educational purposes. Don’t Blindly Buy or Sell any Asset, Do your own analysis and be Aware of the Risk.
Keep in mind, These are Just Market Predictions and not a Trade Signal or Trade Ideas, At Trade Revenue Pro We are Using Daily Time Frame to Identify Major Price Movements and Push Down 4-Hour Time Frame to Get Favourable Risk to Reward For Our Trades, Furthermore, We are Using Tight Risk Management Method to Preserve Our Trading capital.
AUDNZD – Head and Shoulders Pattern at 4-Hour Structure Level
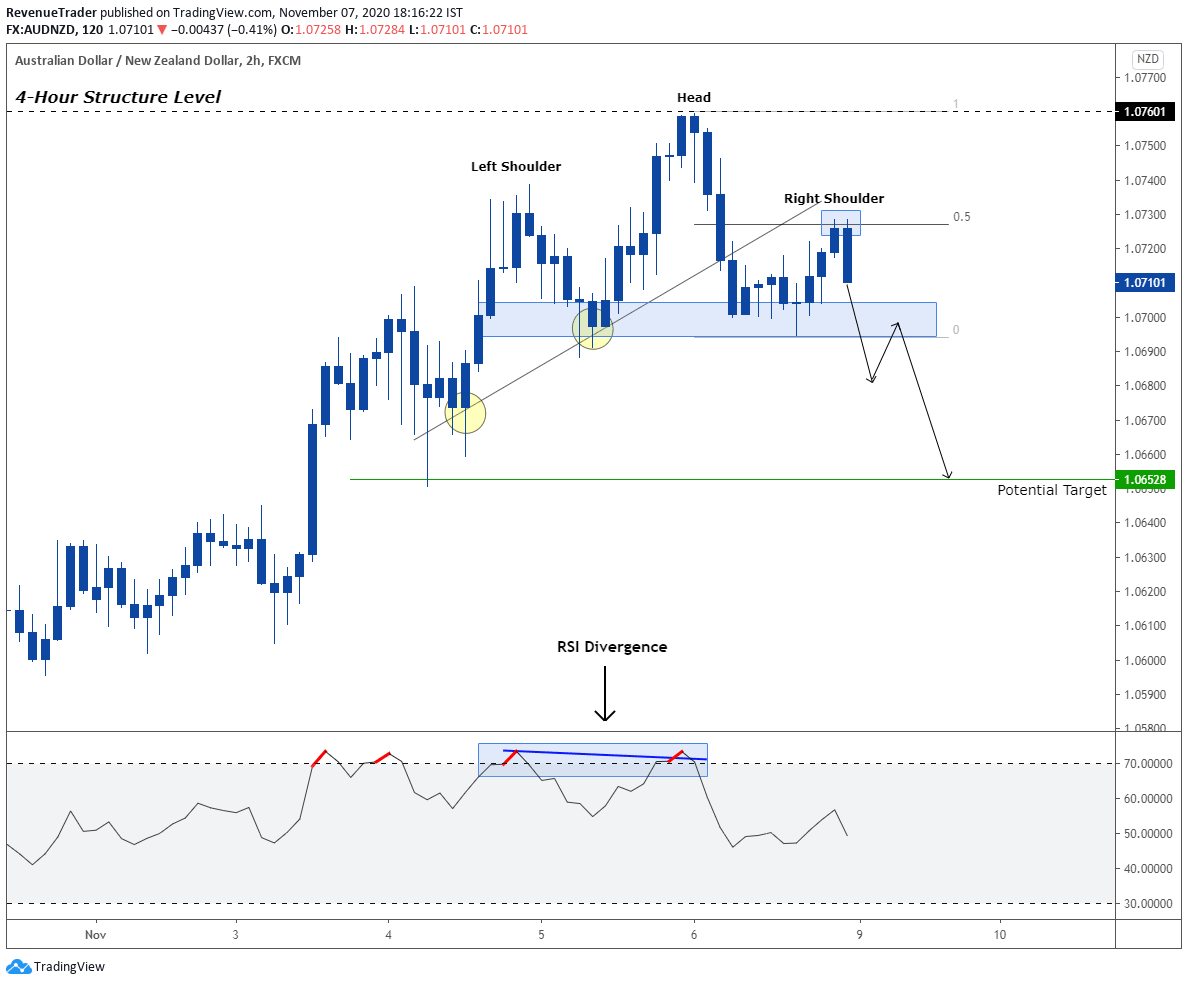
Key Level – At the moment AUDNZD is traded around 1.07601 Resistance level which comes from the daily level. If we observe this level on the daily chart, we can that this level comes from the previous swing low in an ongoing downtrend. This makes the probability of this level is much higher.
Head and Shoulders Pattern – As you guys can see in the above chart we have a textbook head and shoulders pattern nicely align with a resistance level that comes from the daily chart. The head and shoulders pattern at the daily resistance level clearly indicates the lack of buying pressure.
Minor Trendline – It’s clear that the marked trendline in the chart broke clearly and strongly. This indicates the change of technicals in short term uptrend. This trading confluence can be used as an additional factor for our trade idea.
Fibonacci – Have a look at the right shoulder, where it is aligned? It nicely aligns with the 50% Fibonacci level from Head to the neckline. Also, we can see that price fell strongly after testing the 50% fib level.
RSI Divergence – RSI also showed divergence while price making higher highs. This confirms the lack of buying pressure that happening as price approach to daily structure level.
Market Forecast – Right now AUDNZD is trading at major swing low point comes from the daily chart. If you switch to the daily chart and observe this level, It’s clear that this level is a must one to keep our eyes on. Next, the head and shoulders pattern at the daily resistance level is what makes this level and this pair eyecatching. Have look at where is the market right now, It is at the local structure level and in this case, this level is also worked as a neckline. If we see a break below of this level then we can anticipate bearish movement all way to down to the marked target area. But if the price keeps on trading above the local structure level then there are two scenarios we can expect. One is price can be traded sideways in between the daily resistance level and local structure level or trend can continue to the upside.
GBPAUD- An Inverted Head and Shoulders Pattern
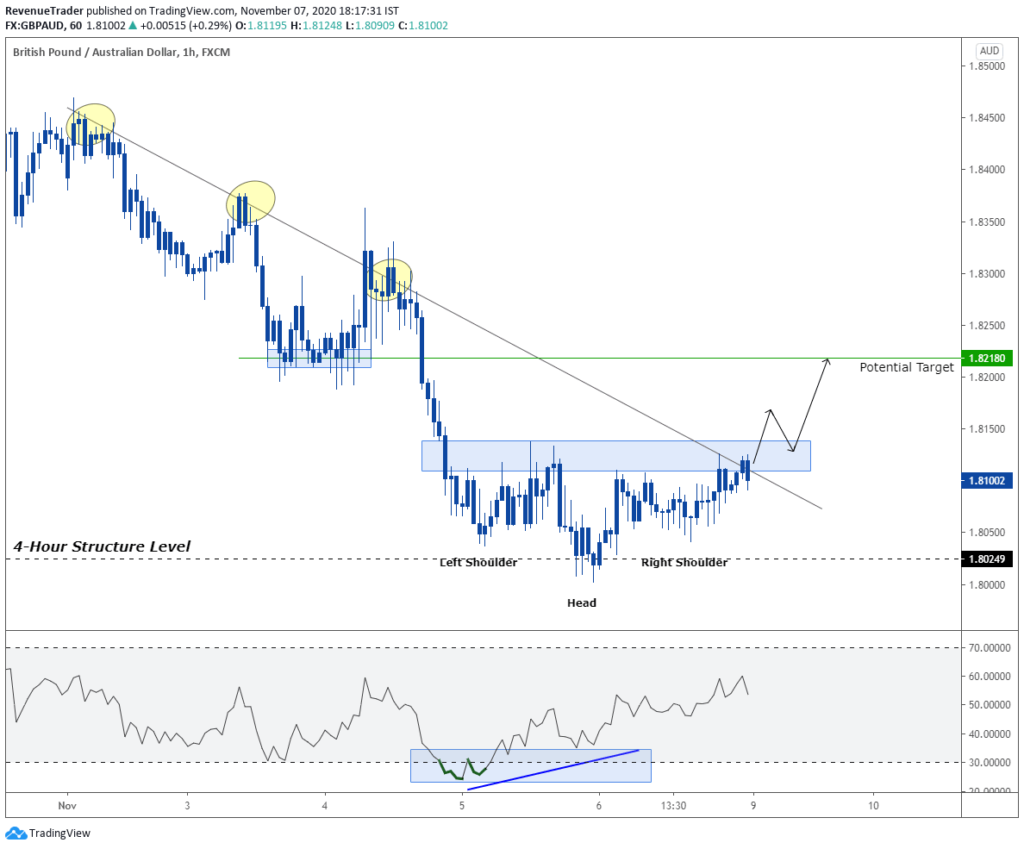
Key Level – Right now, GBPAUD is trading around the minor structure level at 1.80249 which comes from the daily chart. Unlike the AUDNZD, the level of the GBPAUD is not as strong as that one. Hence we have to carefully trad around this level especially when managing risk.
Inverted Head and Shoulders Pattern – Inverted head and shoulders pattern in this are visible on both 2-Hour and 1-Hour chart. This makes this level pattern stand out and makes it easy to trade and manage in both timeframes. While inverted head and shoulders pattern indicate lack of selling pressure at the support level we also have down trendline if break above we can confirm buying pressure.
Trendline – If we look to the left side of this market, we can see that price keep on making lower lows and lower highs also while respecting the trendline. But what happening right now? Sellers are failing to move the price down after hitting the trendline. This increase the probability of price breaking above the trendline.
RSI Divergence – Divergence on 2-Hour and 1-Hour both indicating the lack of selling pressure and as a result of that we can expect a bullish rally if…
Market Forecast – We can expect a bullish rally if price break above both trend line and local structure level. Since seller struggles to break below the local structure level which indicates by the inverted head and shoulder pattern there is more room for breaking above the local structure level if that happened we can expect a bullish movement all the way above to the market target area. If not we can expect a continuation of the ongoing downtrend.
Trade Idea – If price break above the local structure level, then we will consider placing long trade after a successful retest of the local structure level and for target, we use 1.82180 level which is marked in the chart.
Head over to our Trading Blog to learn more about how to trade forex with Proven Trading Techniques and Strategies.
Want more Trade Ideas – Head over to Trade Idea Page.
That is all for this week and If you want constant trade updates – consider following us on Tradingview.
Also, consider following us on social media and Pinterest, Instagram and Facebook.


