Speaking from my trading experiences, I can tell you price action is the only reliable and accurate indicator when comes to making trade decisions in the forex market.
Again speaking from my experiences, I can tell you most of the new traders use price actions in the wrong way.
let’s see why.
Have look at the candlestick formation below.
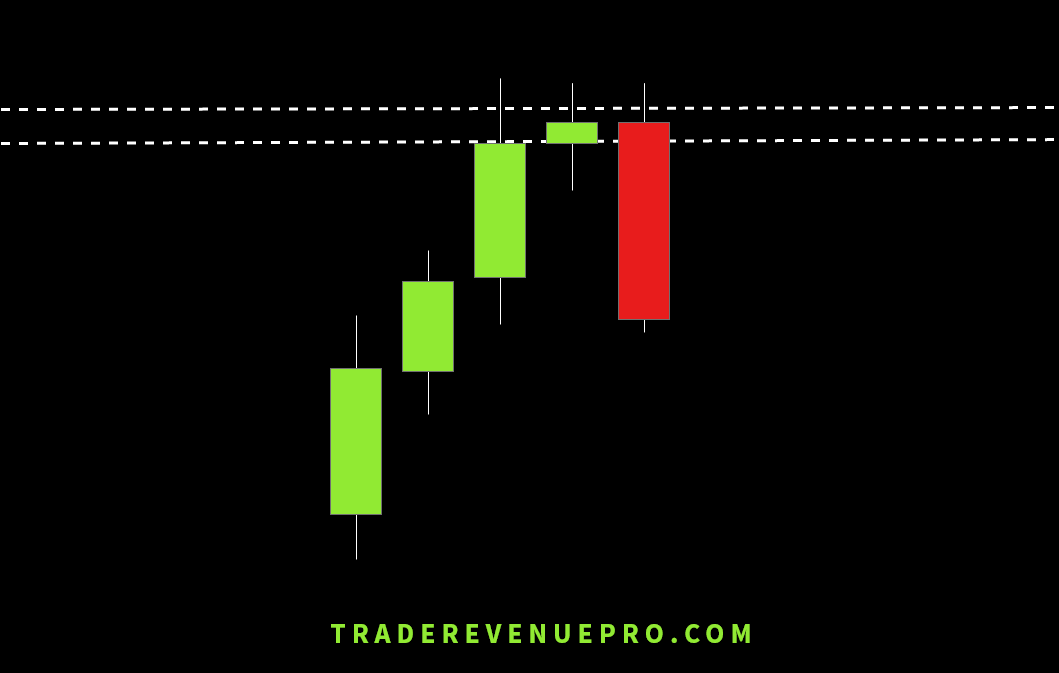
What you noticed first? A Red Candle (Bearish Engulfing Candlestick pattern) rejecting the resistance level. isn’t it? Most probably yes.
This where most of the new traders made the mistake of trading price action wrong.
What they are doing is, they will sell right away after they identified Red Bearish Candle said above and they neglect all other factors like chart patterns, support or resistance and Imbalance Between Buyers and Sellers.
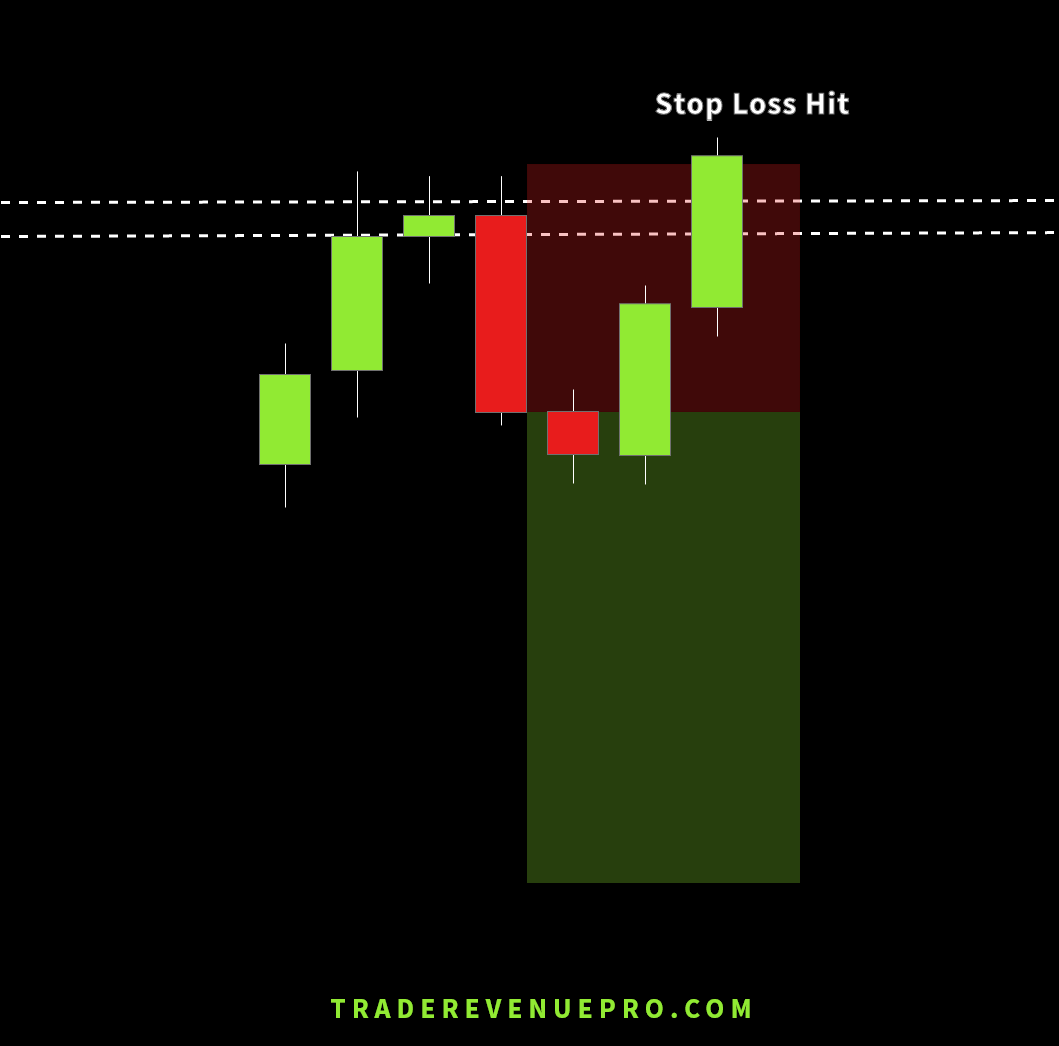
In a nutshell, these traders execute trades base on FOMO (Fear of Missing Out) and ended up having a losing trades in their hands like the trade below.
Here is what you need to understand, making trade decisions based on the candlestick patterns is not the price action trading means.
Also, Pattern recognition is one part of the price action trading.
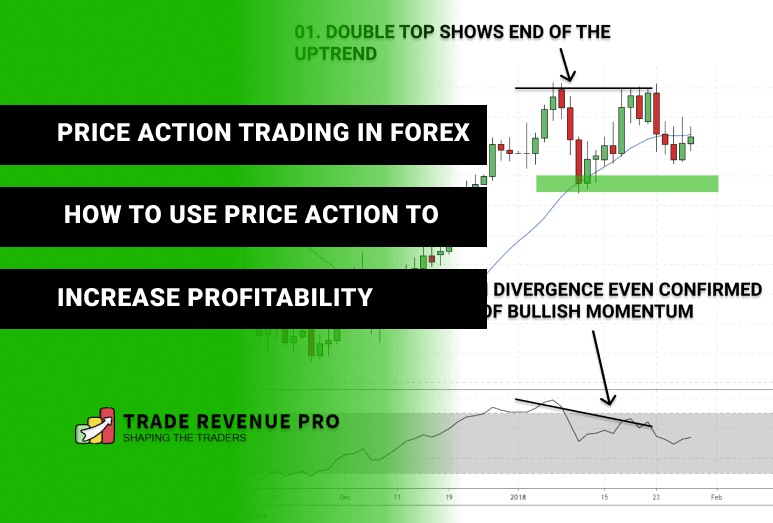
At the end of this article, you will know how to analyze and predict price movement in the forex market using price actions, also we will talk about how to use price action as a profitable trade entry technique with few real chart examples.
Okay, Before we talk about price action trading let’s talk about what are these price actions are? and why we should focus on price actions rather than some of the holy grail or magic trading systems.
What is Price Action in Forex Trading?
Since there is no certainty found on the forex market, as currency traders we have to deal with a lot of uncertainties. This is what makes trading forex market so hard.
Also in this ever-changing market, we have to always keep eyes on the news events, actions of big players and other external factors as well.
But what if I tell you that there is an indicator that filtered out all the news and other factors and provides good trading opportunities in this highly uncertain forex market.
As you already guessed, That indicator is the PRICE ACTION.
A price action analysis is a process of studying, reading and evaluating the price movements of the forex market utilizing raw candlesticks patterns and without any lagging indicator.
Also in order to get more out of the price action, you should focus on the trading daily time frame rather than noisy lower timeframes.
From here I’m going to refer daily candlestick patterns whenever I’m talking about price actions or candles.
In the article how to effectively trades daily chart in forex, we talk about how to execute quality trades in the daily timeframe.
3 Main Reason to Use Price Action Rather Than Indicators?
#1 – Price action reflects all the activities happening in the forex market.
When we take one daily candle it consists of all of the news events, behaviours of big players like institutions and bank, also behaviours of retail traders like us and other external factors as well.
So do we need any other indicators besides price actions?
This brings me to the second reason.
#2 – Even Indicators Depend on the Price Movement
No price action means no indicators.
All of the indicators out-there, non-paid or paid indicators are depending on price movement. These indicators calculate their values after closes of every candlestick. This makes these indicators are lagged.
So, It’s your choice to either trade with price actions or trade with lagged indicators.
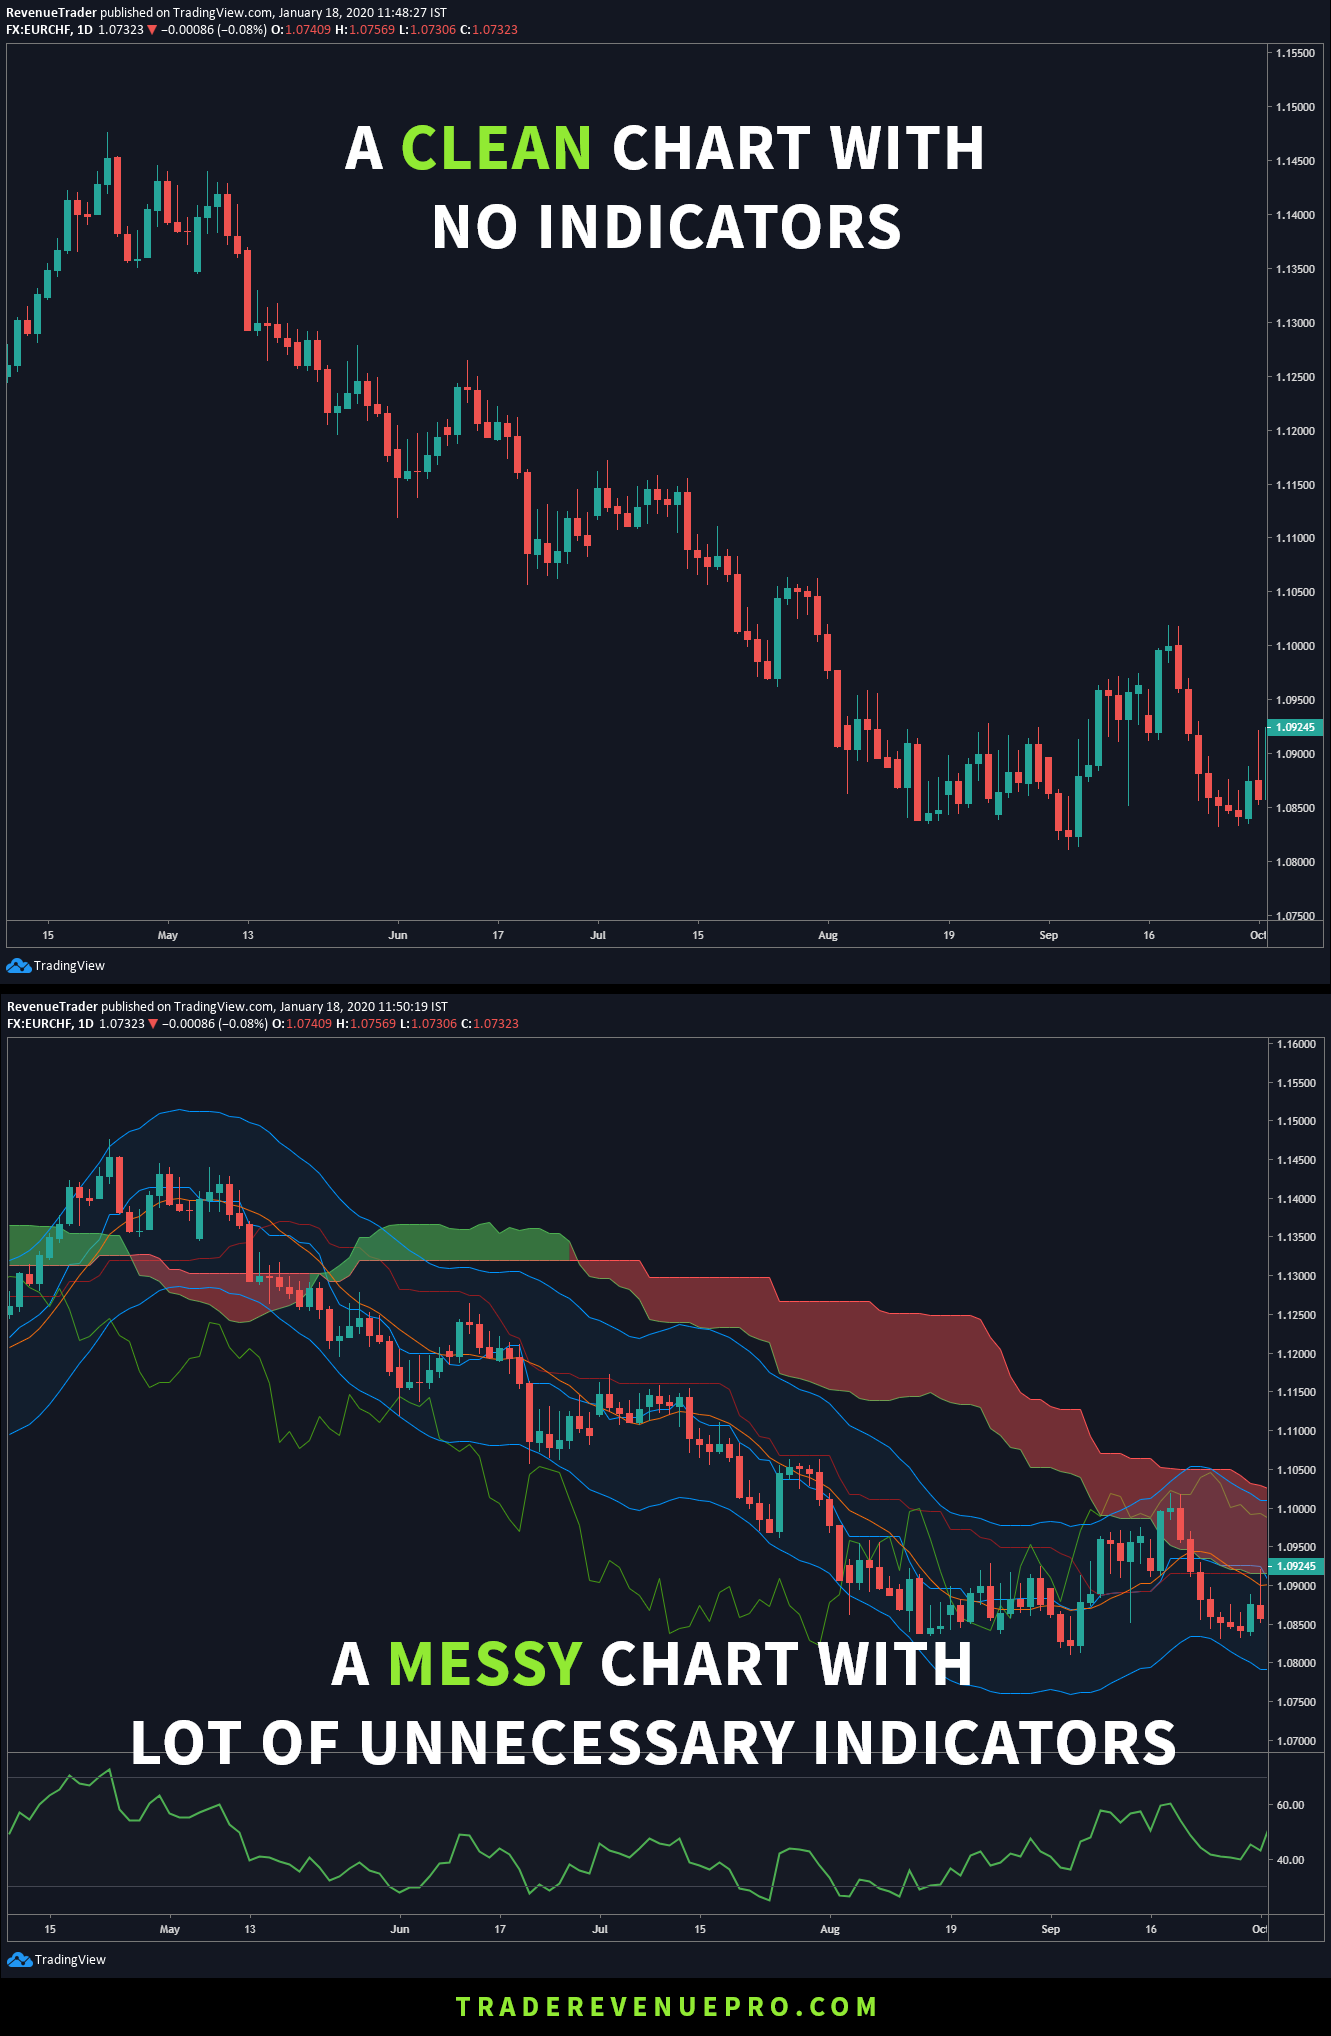
#3 – Clean Chart vs Messy Chart
Trading with price actions without any indicators makes your chart more clear and easy to understand plus a clean forex chart will inspire you to make clear trading decisions as well.
However, a messy chart with lots of indicators only makes you frustrated.
The reason is instead of focus on one clear thing your mind is all over the market and eventually, you ended up making a bad trade decision because of the frustration.
Have a look at the two chart comparison below. Which one do you prefer?
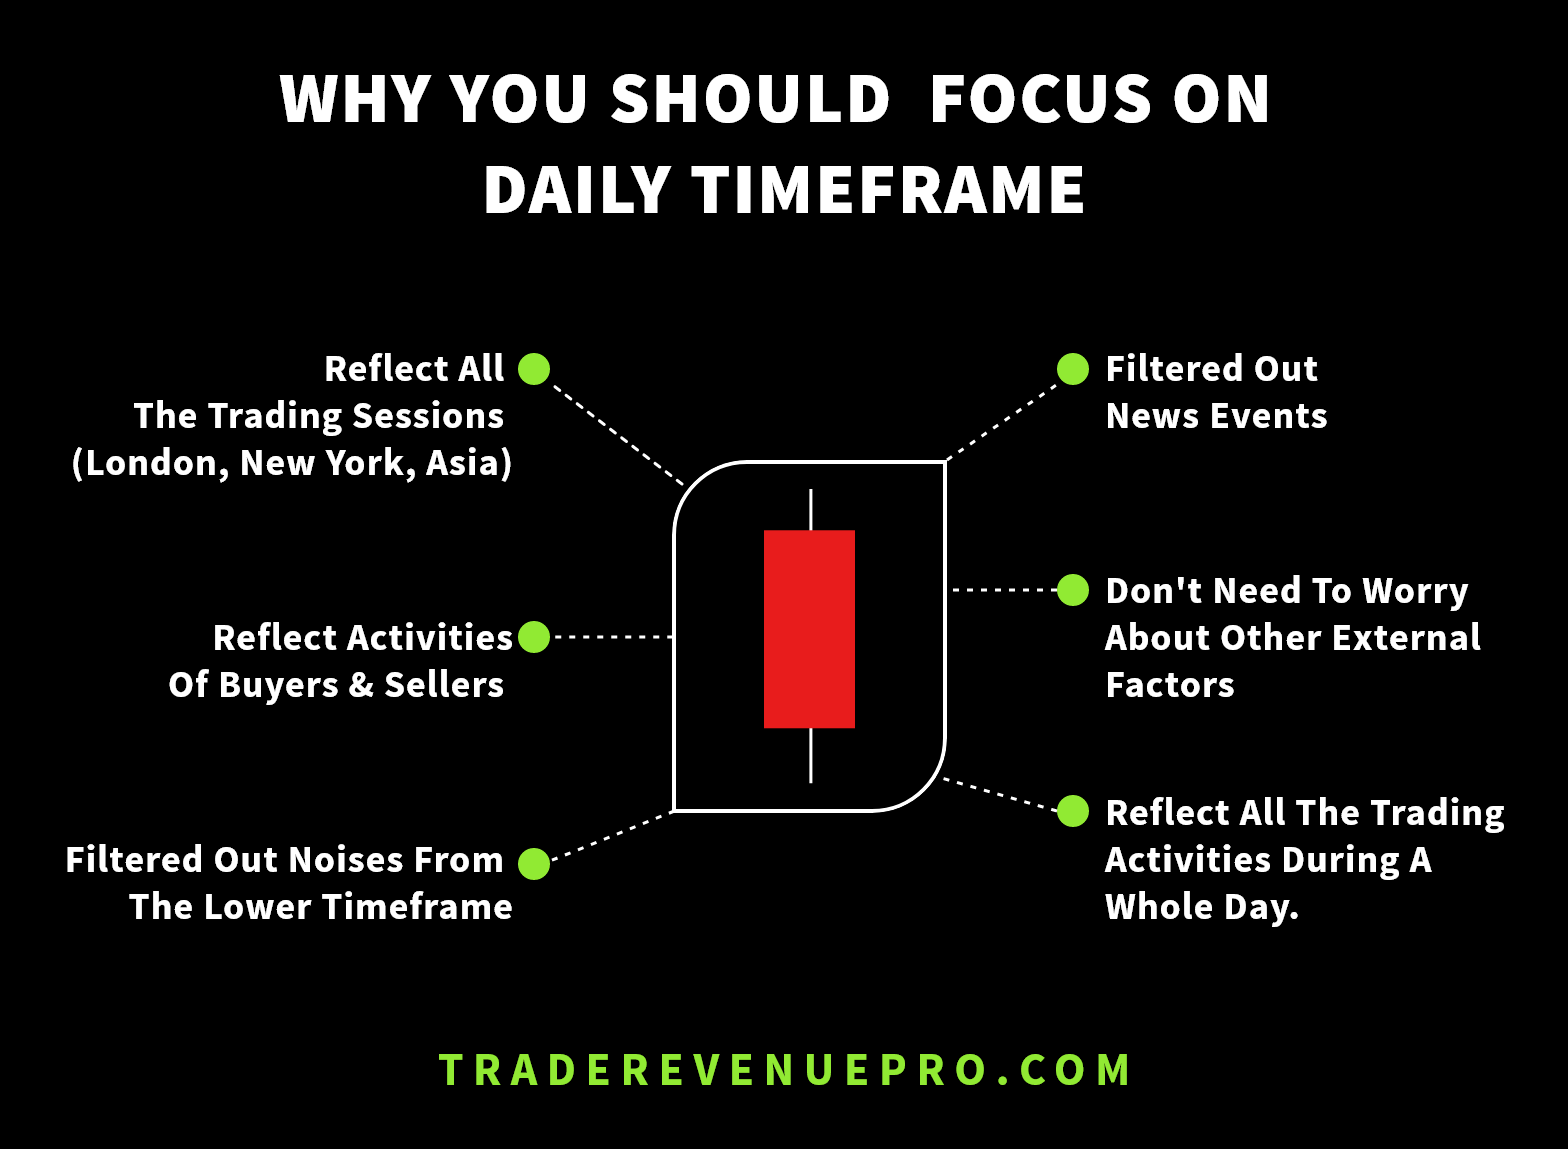
Why You Should Focus on Daily Timeframe When Trading Price Actions?
The purpose we are trading price action is that we need to filter out all the news events, behaviours of big players and other external factors that happened during a single day and visualize them by using candles.
But we cannot achieve this if we choose to trade on lower time frames like 1-Hour or 15-Minutes charts.
1-Hour or 15-Minutes candles didn’t fill with a lot of clues and making trade decisions based on these candles is the quickest way to ruin your trading account.
However, a daily candle consists of all of the behaviours of a big player like an institution and a big bank plus a daily candle reflect on what retail traders like us did the whole day.
Also, a daily candle cover-up all of the trading sessions (New York, London, Asia) means a daily candle summarizes all of the trading activities happened in each session.
These are only a few reasons why I recommend trading price action on the daily timeframe.
Related: How to Effectively Trade Daily Chart in Forex
Let’s talk about the difference between Price Action Analysis and Price Pattern Recognition.
Price Action Analysis and Pattern Recognition are Two Different Things.
Any trader can distinguish bearish engulfing candles from the pin bar candles.
But Only a handful of traders know how to use these candlesticks patterns at the right time and right place and profiting from them.
To trade price actions profitably first you need to understand what is pattern recognition and why it plays a big role in price action trading.
What is Pattern Recognition
In simple meaning, It is the ability to identify different candlestick patterns (Pin Bars, Engulfing Pattern, Doji) and reading the story behind it.
Candlestick patterns alone don’t provide any insight into the market.
But,
By combining these candlestick patterns with other price action factors we can find high probability trades and entry/ exits points as well.
We will talk about candlesticks Patterns lately in this article.
Okay, Let’s see what Price Action Analysis is?
What is Price Action Analysis?
Price Action Analysis is the method of analyzing and predicting (maybe executing trades) the price moves with the help of Trade Location, Price Strength, and with Candlestick Patterns (Pattern Recognition).
So basically Pattern Recognition is a part of Price Action analysis.
Let’s see some of the important candlestick patterns in the world of forex trading.
Candlestick Patterns & What They are Telling
Thanks to Steve Nison, now we can easily understand a price chart with color-coded candles and use them to anticipate future price movements.
Normally candlestick patterns contain one or two candles & there are a lot of candlestick patterns out-there that make it harder to even remember.
Although we had a huge number of candlestick patterns, they all do not work equally.
The infographic below easily explains the most important candlestick patterns and how they affect the forex market.

Refer to this article from Wikipedia if you need to know more about candlestick patterns.
Have a look at the very nice price action trade below, Let’s see how to execute trades like that using price actions.

Finding Higher Profitable Price Action Trade Setups
When it comes to price action trading all of your trading decisions based on “raw” candlesticks and candlestick patterns.
Also, as a price action trader, we do not focus on any MACDs, ATRs or any other indicators except for a moving average which comes handy when trading with trending market conditions.
Have a Look at the graphics below to understand why we should focus on the daily candlestick patterns (daily price action).
Instead of analyzing multiple economics variables every day, you can simply focus on the daily candlestick pattern which also reflects all of the internal and external factors that cause price movements.
Finding a Good price action trade setup comes down to multiple factors. The main and most important one is the price action and if we combined other factors with price action we can come up with a highly profitable trade idea that gives both probability and risk to reward ratio in our favor.
Have a Look at the 3 points below. These are the main factors we focus on when finding price action trades.
- Trade Location
- Candle Strength (Price Action Strength / Imbalance Between Buyers and Sellers)
- Price Action Confirmation
In the Article Forex Trade Entry Techniques, we talk about 3 factors listed above.
Let’s use these factors to find good trade setups.
Trade Location is Very Important
There are hundreds of trader around the globe execute trades every time and everywhere and fall into 95% of losing traders.
But identifying the right trade location in this everchanging market is what makes you fall into 5% of traders who are consistently earning from the market.
Also even if you had the best trade entry or trade strategy out-there you will never make a consistent profit if you execute trades in no man’s lands.
The point here is you have to be very selective when it comes to trade location.
Have look at the higher probability areas explained in the infographic below.
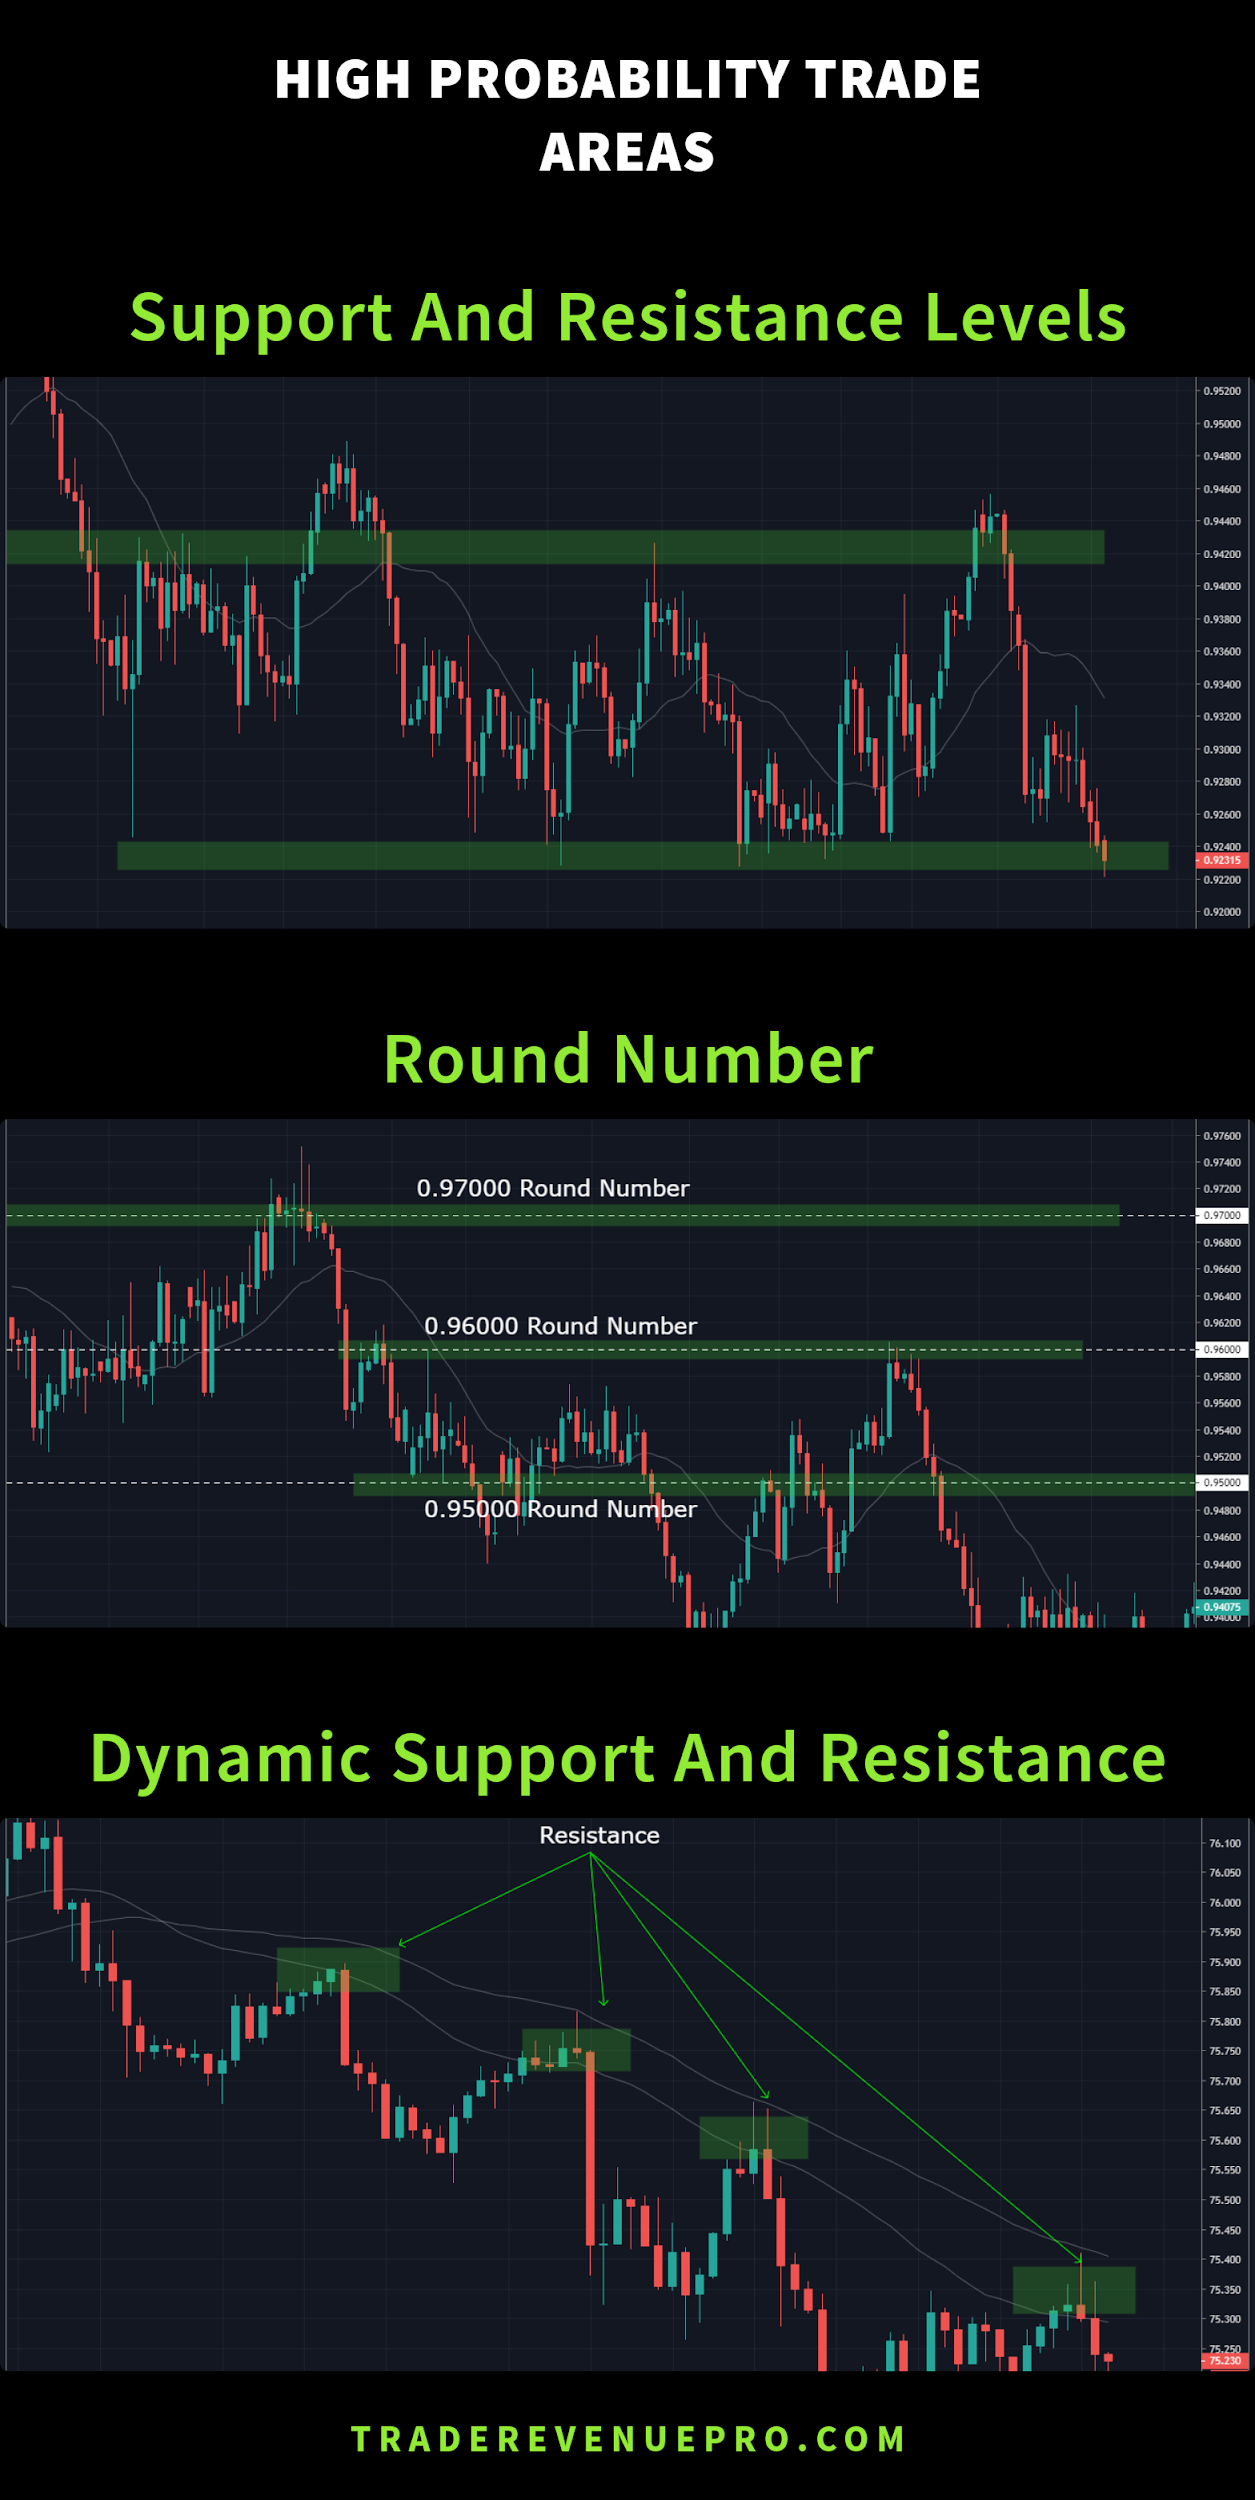
Make sure to execute your trades around these key levels explained in the above picture.
Let’s Talk about the second factor.
The second-factor, candle strength, tell if the trade location we found earlier actually going to hold or not.
Or in another word, we use candle strength to determine whether this level (trade location) is good for trade or not.
Let’s see how to use candle strength.
Price Action Strength Matters
In here price action strength simply refers to the size of candlesticks.
So what is the story behind candle size? Let me explain it.
Have a look at the picture below.
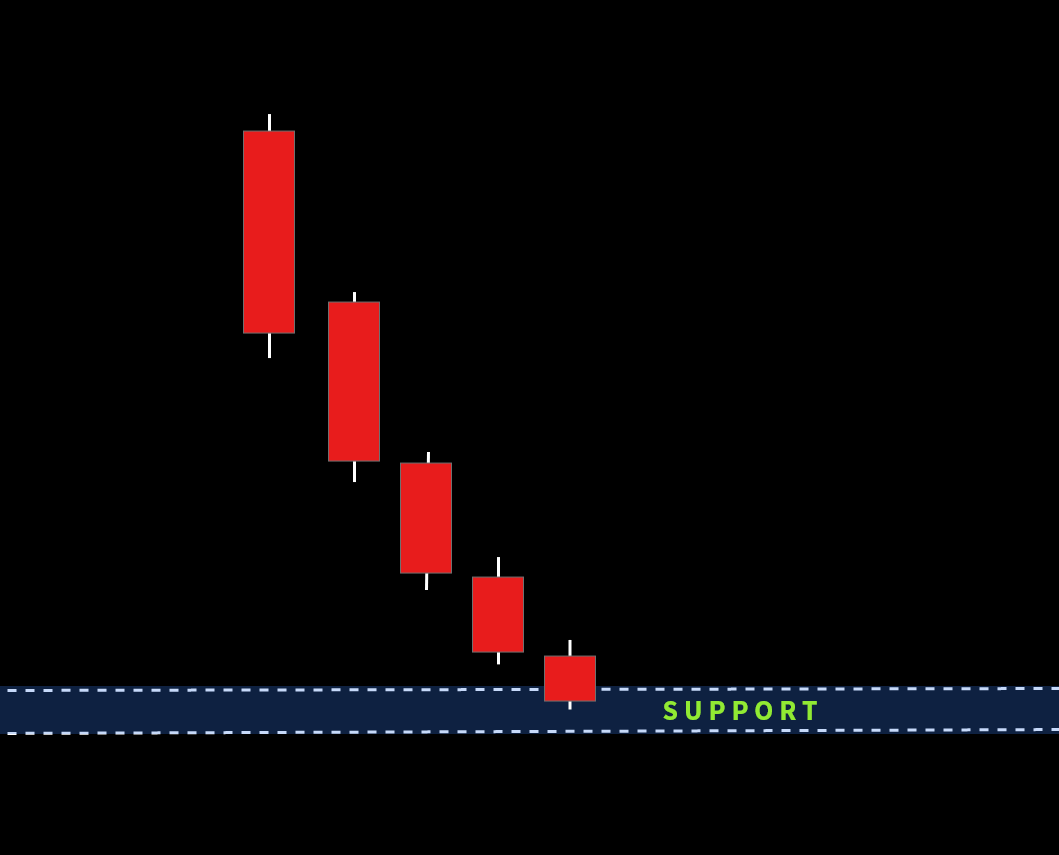
According to picture, The first red candle is a big one comparing to others. And after that, all the other candles are getting smaller and smaller.
So, This is a clear sign that saying sellers are getting weaker and weaker.
Now, have a look at the second picture below,
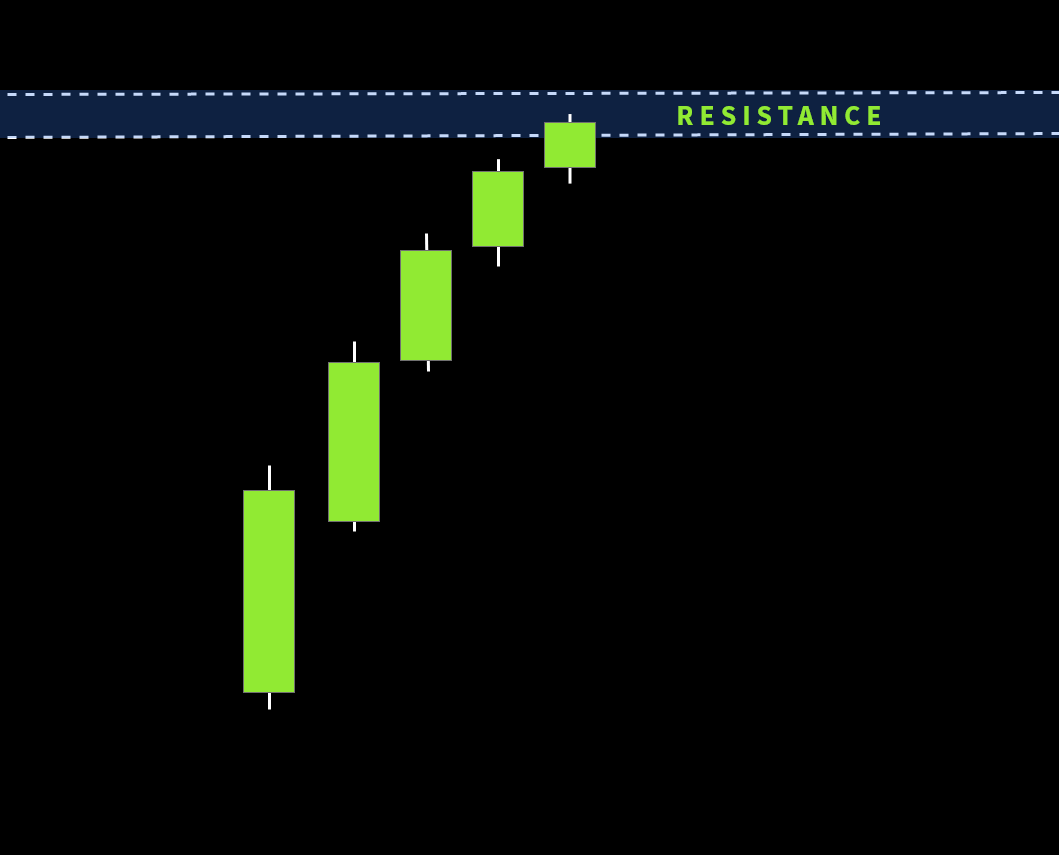
Just like the previous example above, the same thing happened here but oppositely.
In this case, Bullish candles are getting smaller and smaller, this reflects buyers are getting weaker and weaker.
So, what happened if we see this price action phenomenal at support or a resistance level or any other high probability area.
have a look at the charts below.
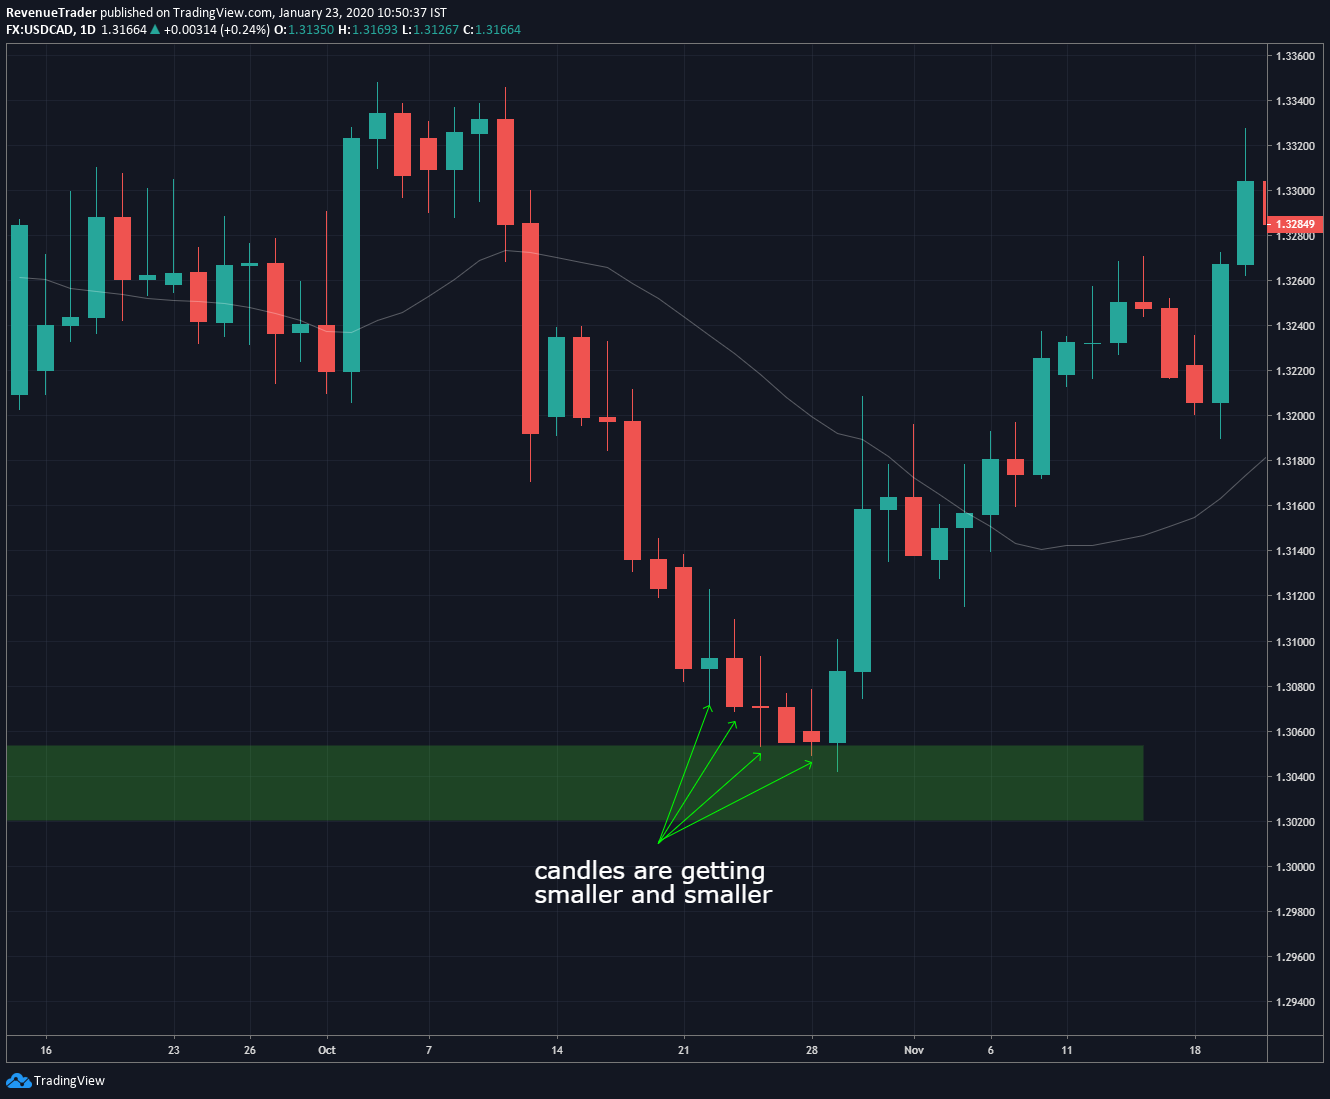
According to the USDCAD chart, you can see that candles are getting smaller and smaller when they come close to the support zone marked in green.
So this is a real example telling that the support (green zone) level marked in the chart is a high probability area that may provides good trading opportunities.
Next, take a look at the USDCAD price chart below,
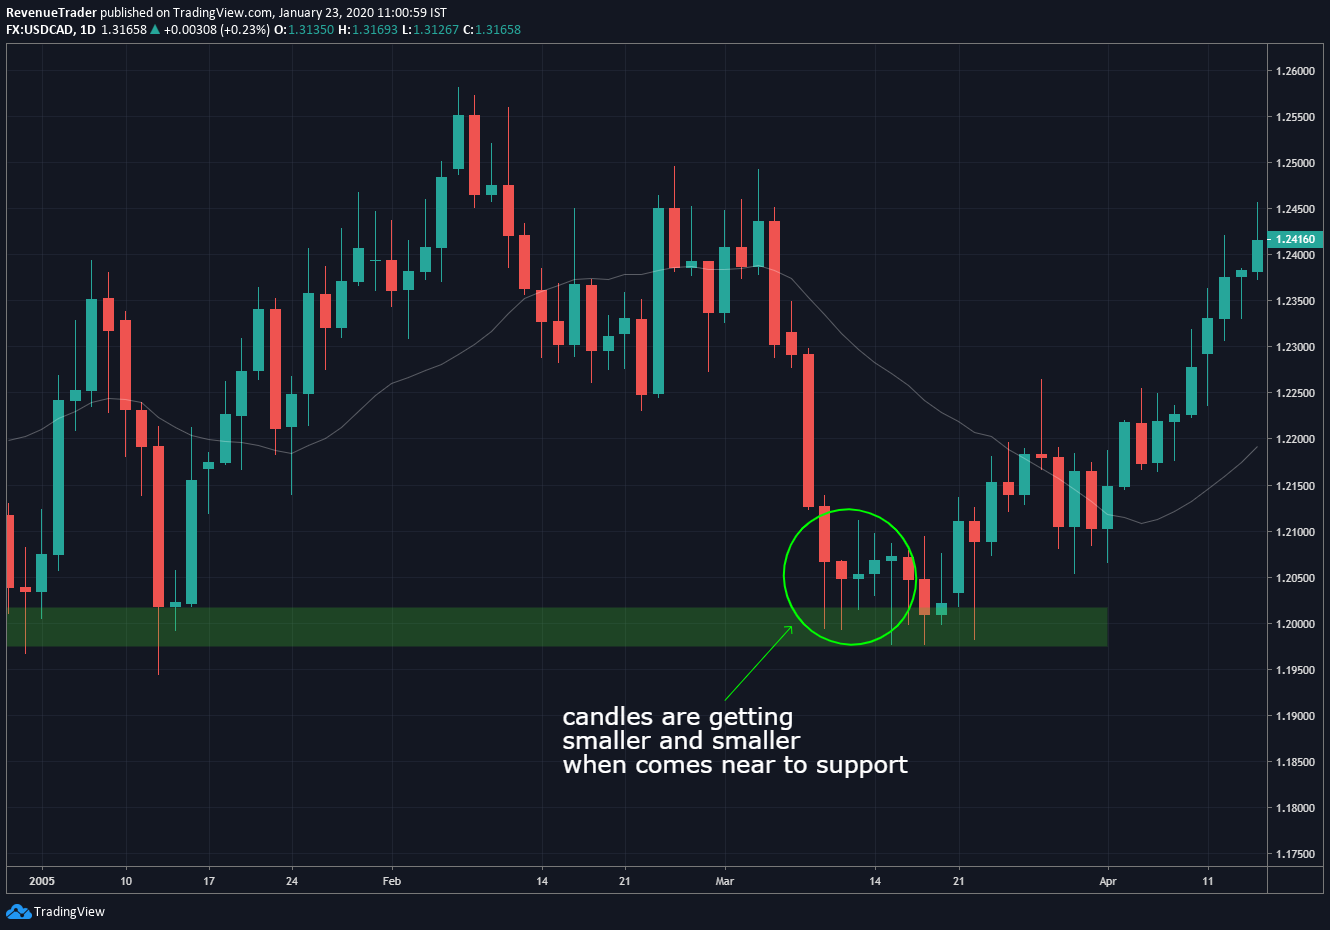
Just like the previous example, candles are getting smaller and smaller when comes to the support zone marked in green plus in this scenario we have some indecision candles as well and this is a sign telling this support is worth looking for a reversal trade.
As you guys saw, Price action strength (Candle size) plays a major role when it comes to finding high probability trade opportunities.
To get this point clear have a look at the pictorial explanation below.
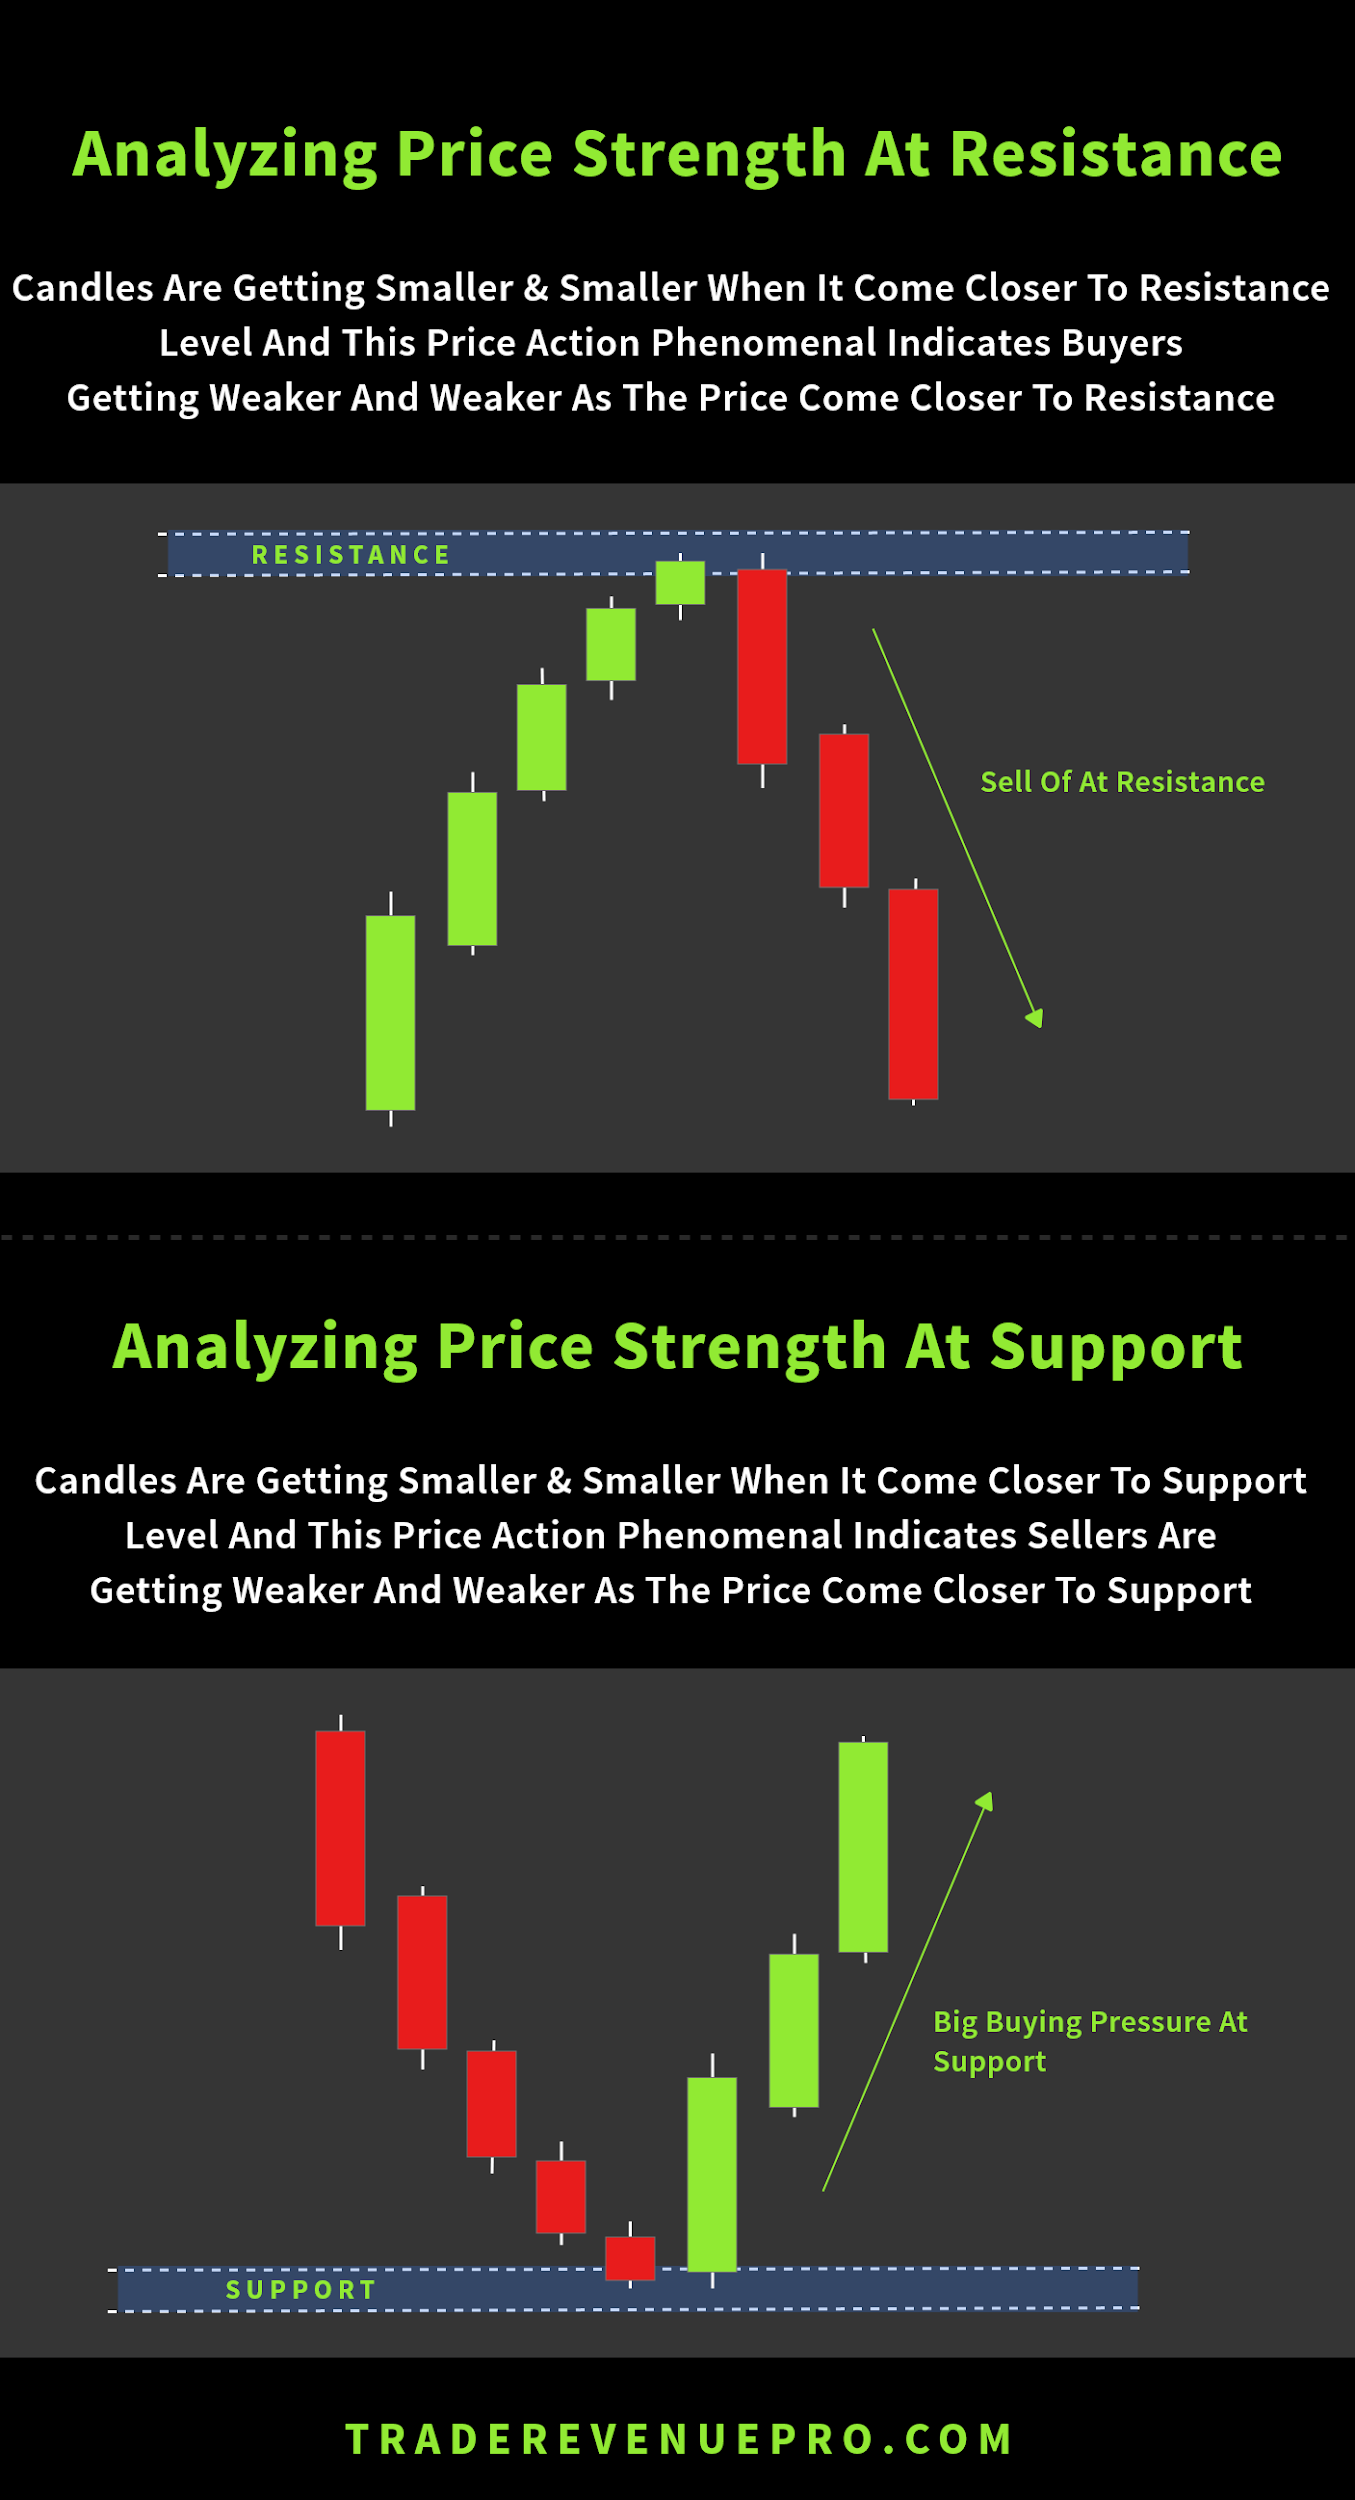
Alright, now you know how to find how probability trade location and check whether that location is worth watching or not by using price action strength.
So, Now you are one step away to execute a high probability price action trade.
Next, Let’s talk about another step which is very important when it comes executing a trade. It’s called Price Action Rejection.
How to Use Price Rejection to Measure Strength Between Buyers and Sellers.
Have you ever heard candlestick formation called bearish or bullish pin bar? Most probably, yes.
So that is what price action rejection means. As traders why this pattern means so much to us.
This pattern indicates rejection between buyers and seller and this candle formation become very informative when formed around support or resistance levels.
Let’s see what clues rejections candles leave for us.
Have a look at the bearish and bullish pin bars in the picture below.
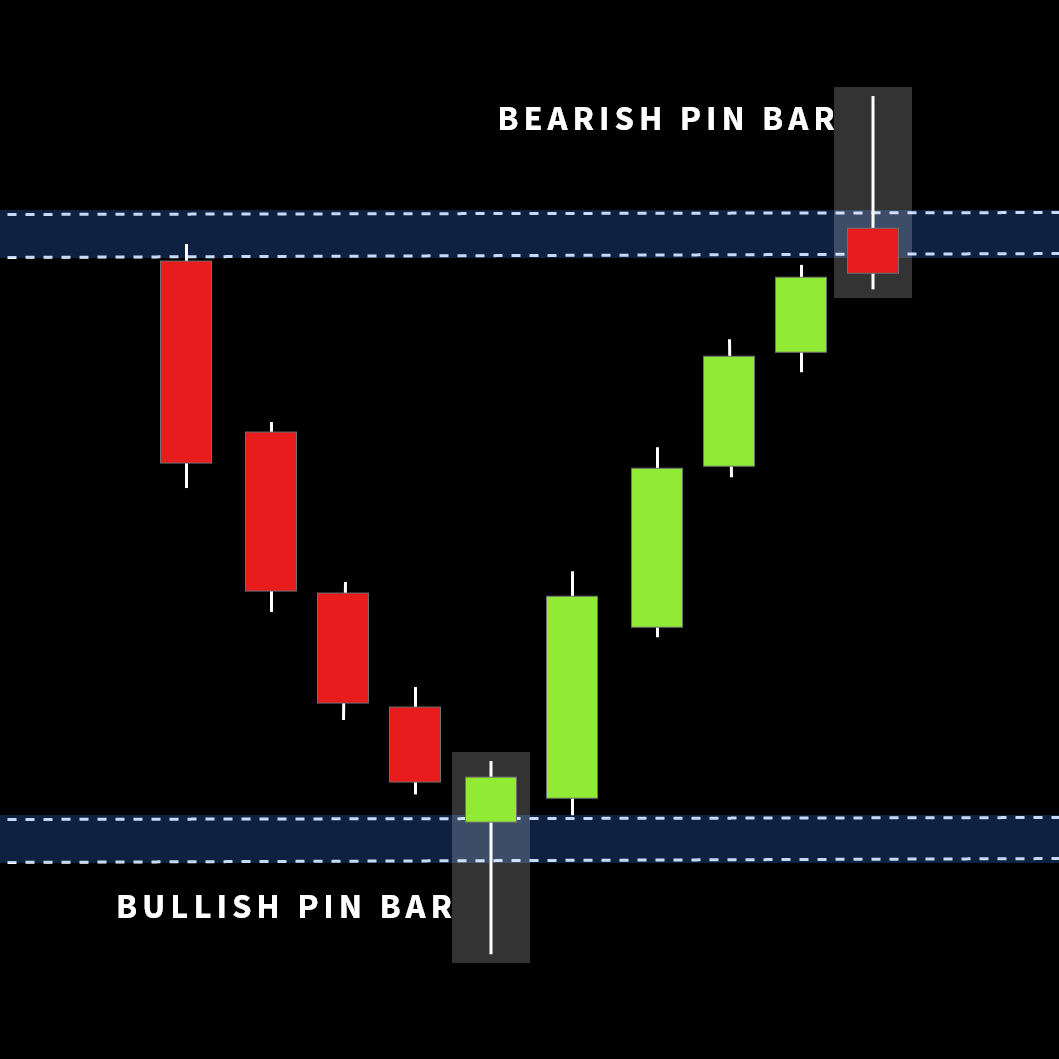
According to the two formations above,
The Long wick to the downside indicates buying pressure and long wick to the upside indicates the selling pressure.
So, When this price action formation occurs at resistance or support level we can get higher probability trade signals.
Have a look at the chart below,
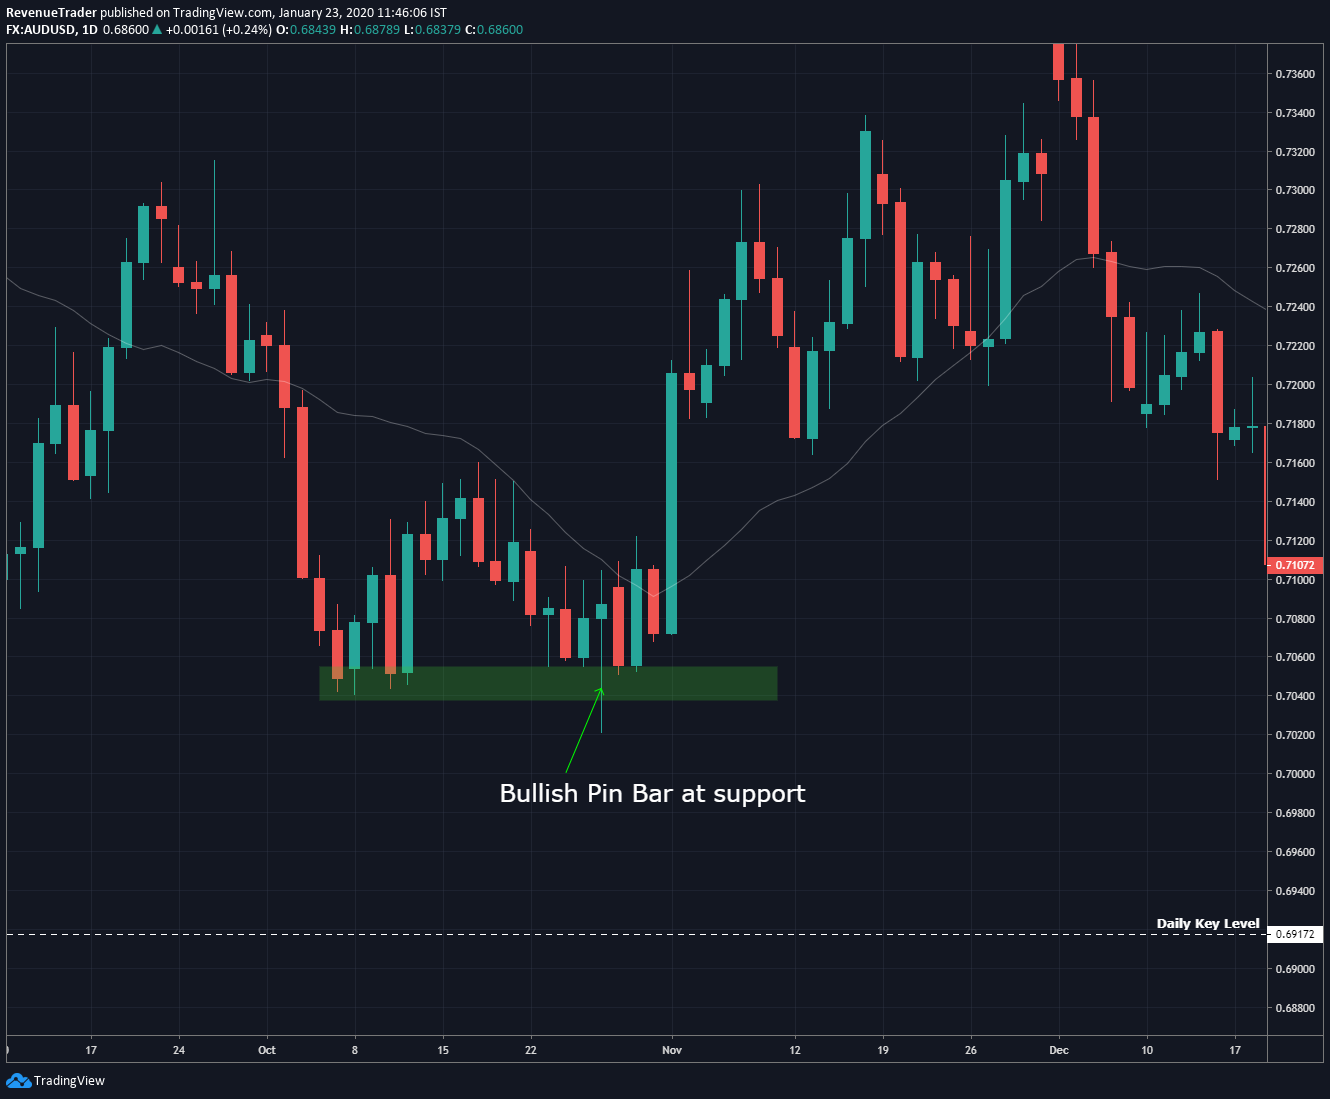
Price clearly rejects the support level with the long-tailed bullish pin bar and this is a clear sign that may provide a reversal at this support level.
I’m not talking more detail about this pattern since the infographic about candlestick pattern alone with the Wikipedia reference said above provides enough detail about this pattern.
All you have to remember is that this price action rejection pattern provides many valuable clues when its use at the right trade location.
Alright, now it is time to combine all the factors (Trade Location, Price Action Strength and Price Rejection) we learned so far to come up with good trading setups.
When combining these factors your first job is to identify the right trade location. This can be done by placing support or resistance levels in forex chart or any other high probability areas (Round Number, Fib levels, Trend lines).
After that, you have to shift your focus on examining the strength of buyers and sellers. This can be done through the help of analyzing candlestick strength (Size) or Candlestick rejections.
Alright,
So far we learned about how to measure the strength of buyers and sellers (strength of the price) using trade location, price strength, and price rejection.
Now it is the time to talk about the last factor and the most important factor which helps us to determine whether the price is going to bounce from a particular level or not.
Price Action Confirmation
So far we learned about how to confirm a key level (Support and Resistance, Round number and dynamic support and resistance) before executing a trade.
Now it is time to talk about how to actually pull the trigger around those levels and ride the momentum.
This is where price action confirmation and pattern recognition (refer to the candlestick infographic) comes in.
Have look at the trade below,
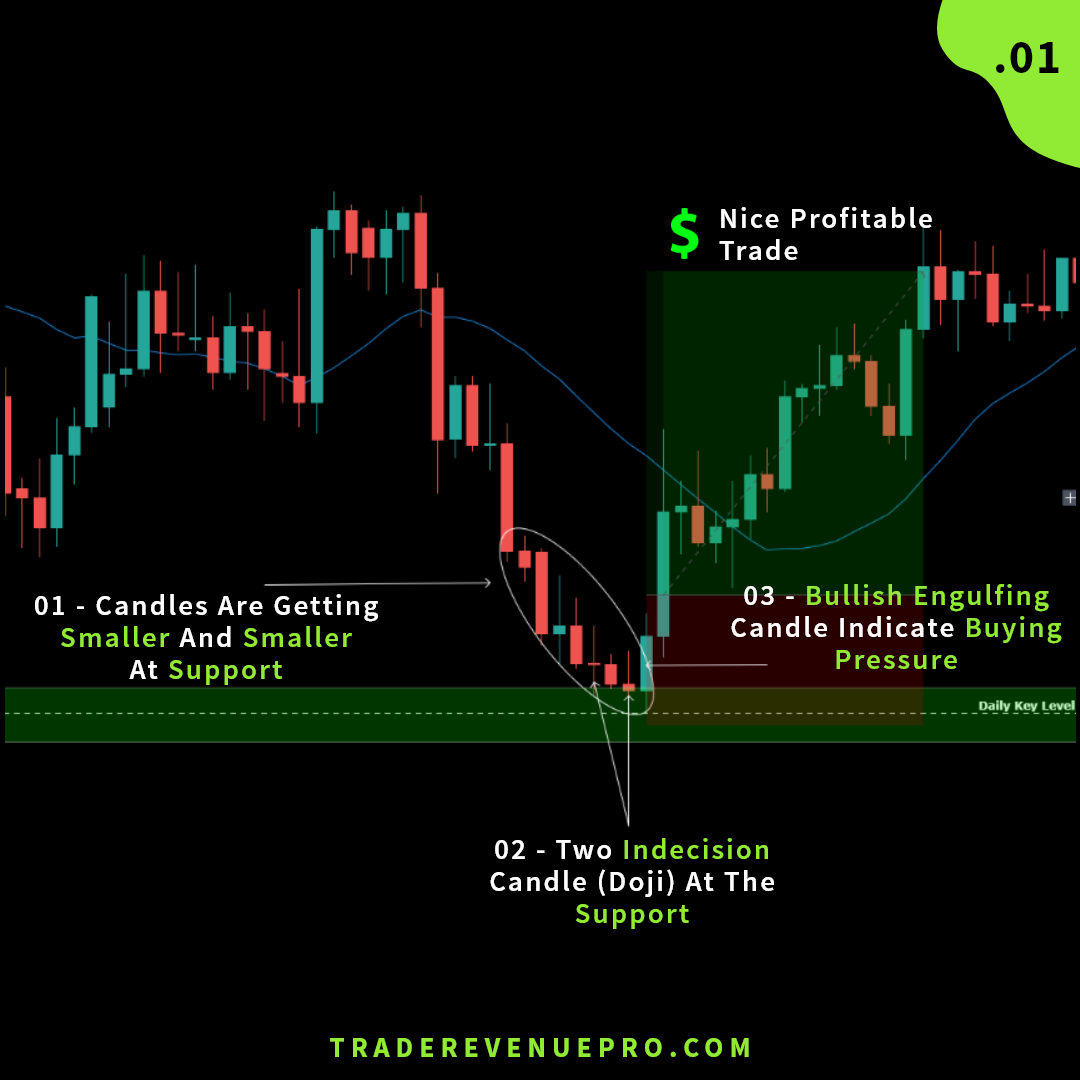
According to the above chart first, we looked at the price strength and then we focus on price rejections in order to confirm whether the support level is going to hold or not.
And finally, we looked at the price action confirmation, in this case, it is a bullish engulfing candlestick pattern which indicates buying pressure at the support level.
Have look at the infographic below,
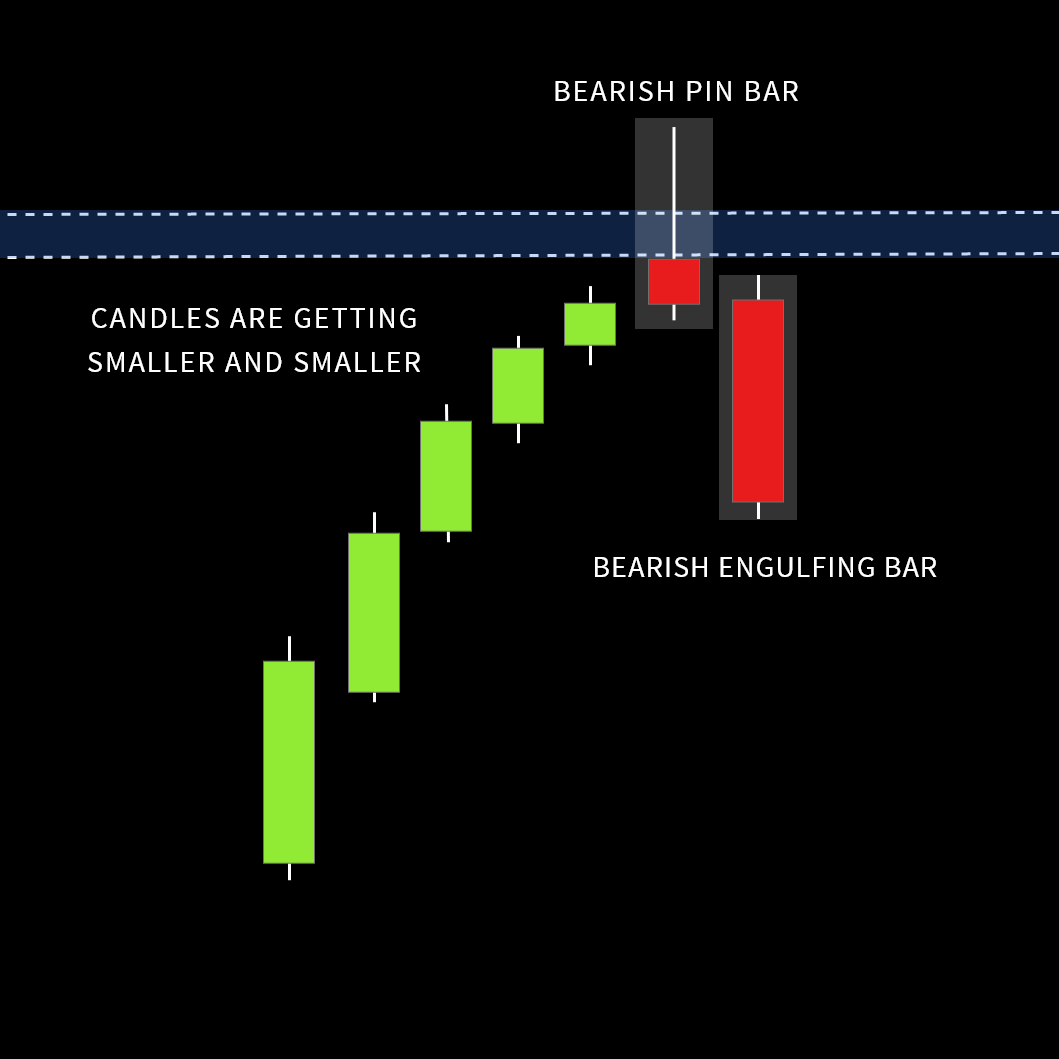
In the above scenario, candles are getting smaller and smaller when they come closer to resistance and then the occur of rejection candle indicates the weaknesses of buyers.
And finally, a bearish Engulfing candlestick pattern which indicates selling pressure at the resistance level.
Considering going short here would be a good idea to ride the momentum and banked some profit.
Let’s talk about real chart examples to grasp what we talked so far.
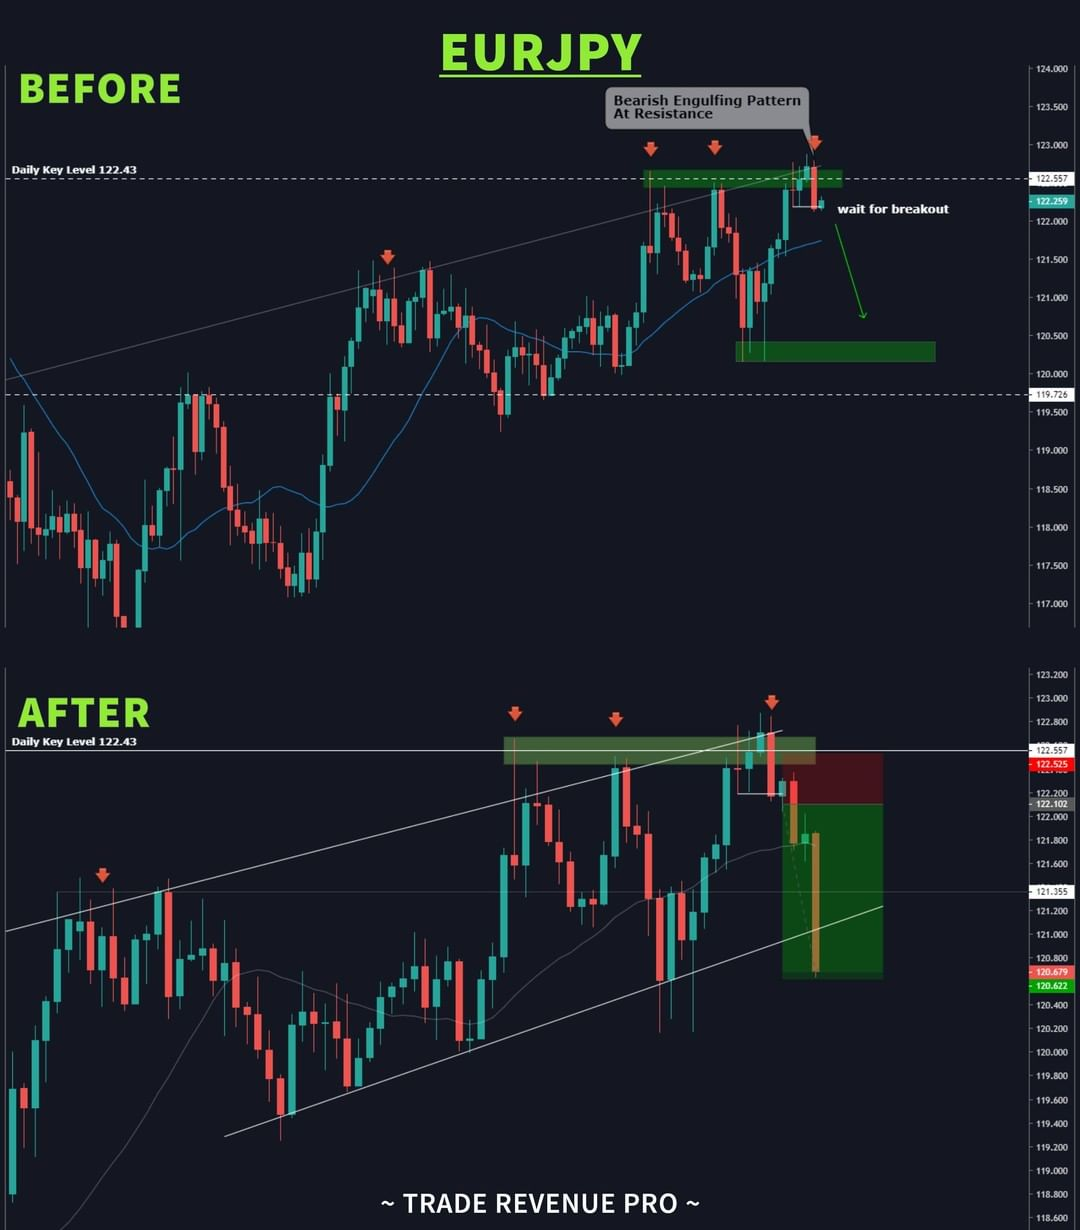
Have a look at the real chart example below.
This is EURJPY daily chart. As you see, right now EURJPY is trading around at a daily resistance level marked in the green circle.
Take a closer look at the green circle. What is happening there?
Candles are getting smaller and smaller around the daily resistance level and we have an indecision candle (Doji). And eventually, we got a bearish engulfing candle that fulfills our entry criteria.
According to the above clues, we can anticipate a sell-off from this level.
At tradereveneupro, we always move down to the 4-Hour timeframe to get a favorable risk to reward ratio for our trades. To learn more about entry techniques we used to get a favorable risk to reward ratio click here.
Next,
Have a look at the EURAUD Daily chart below.
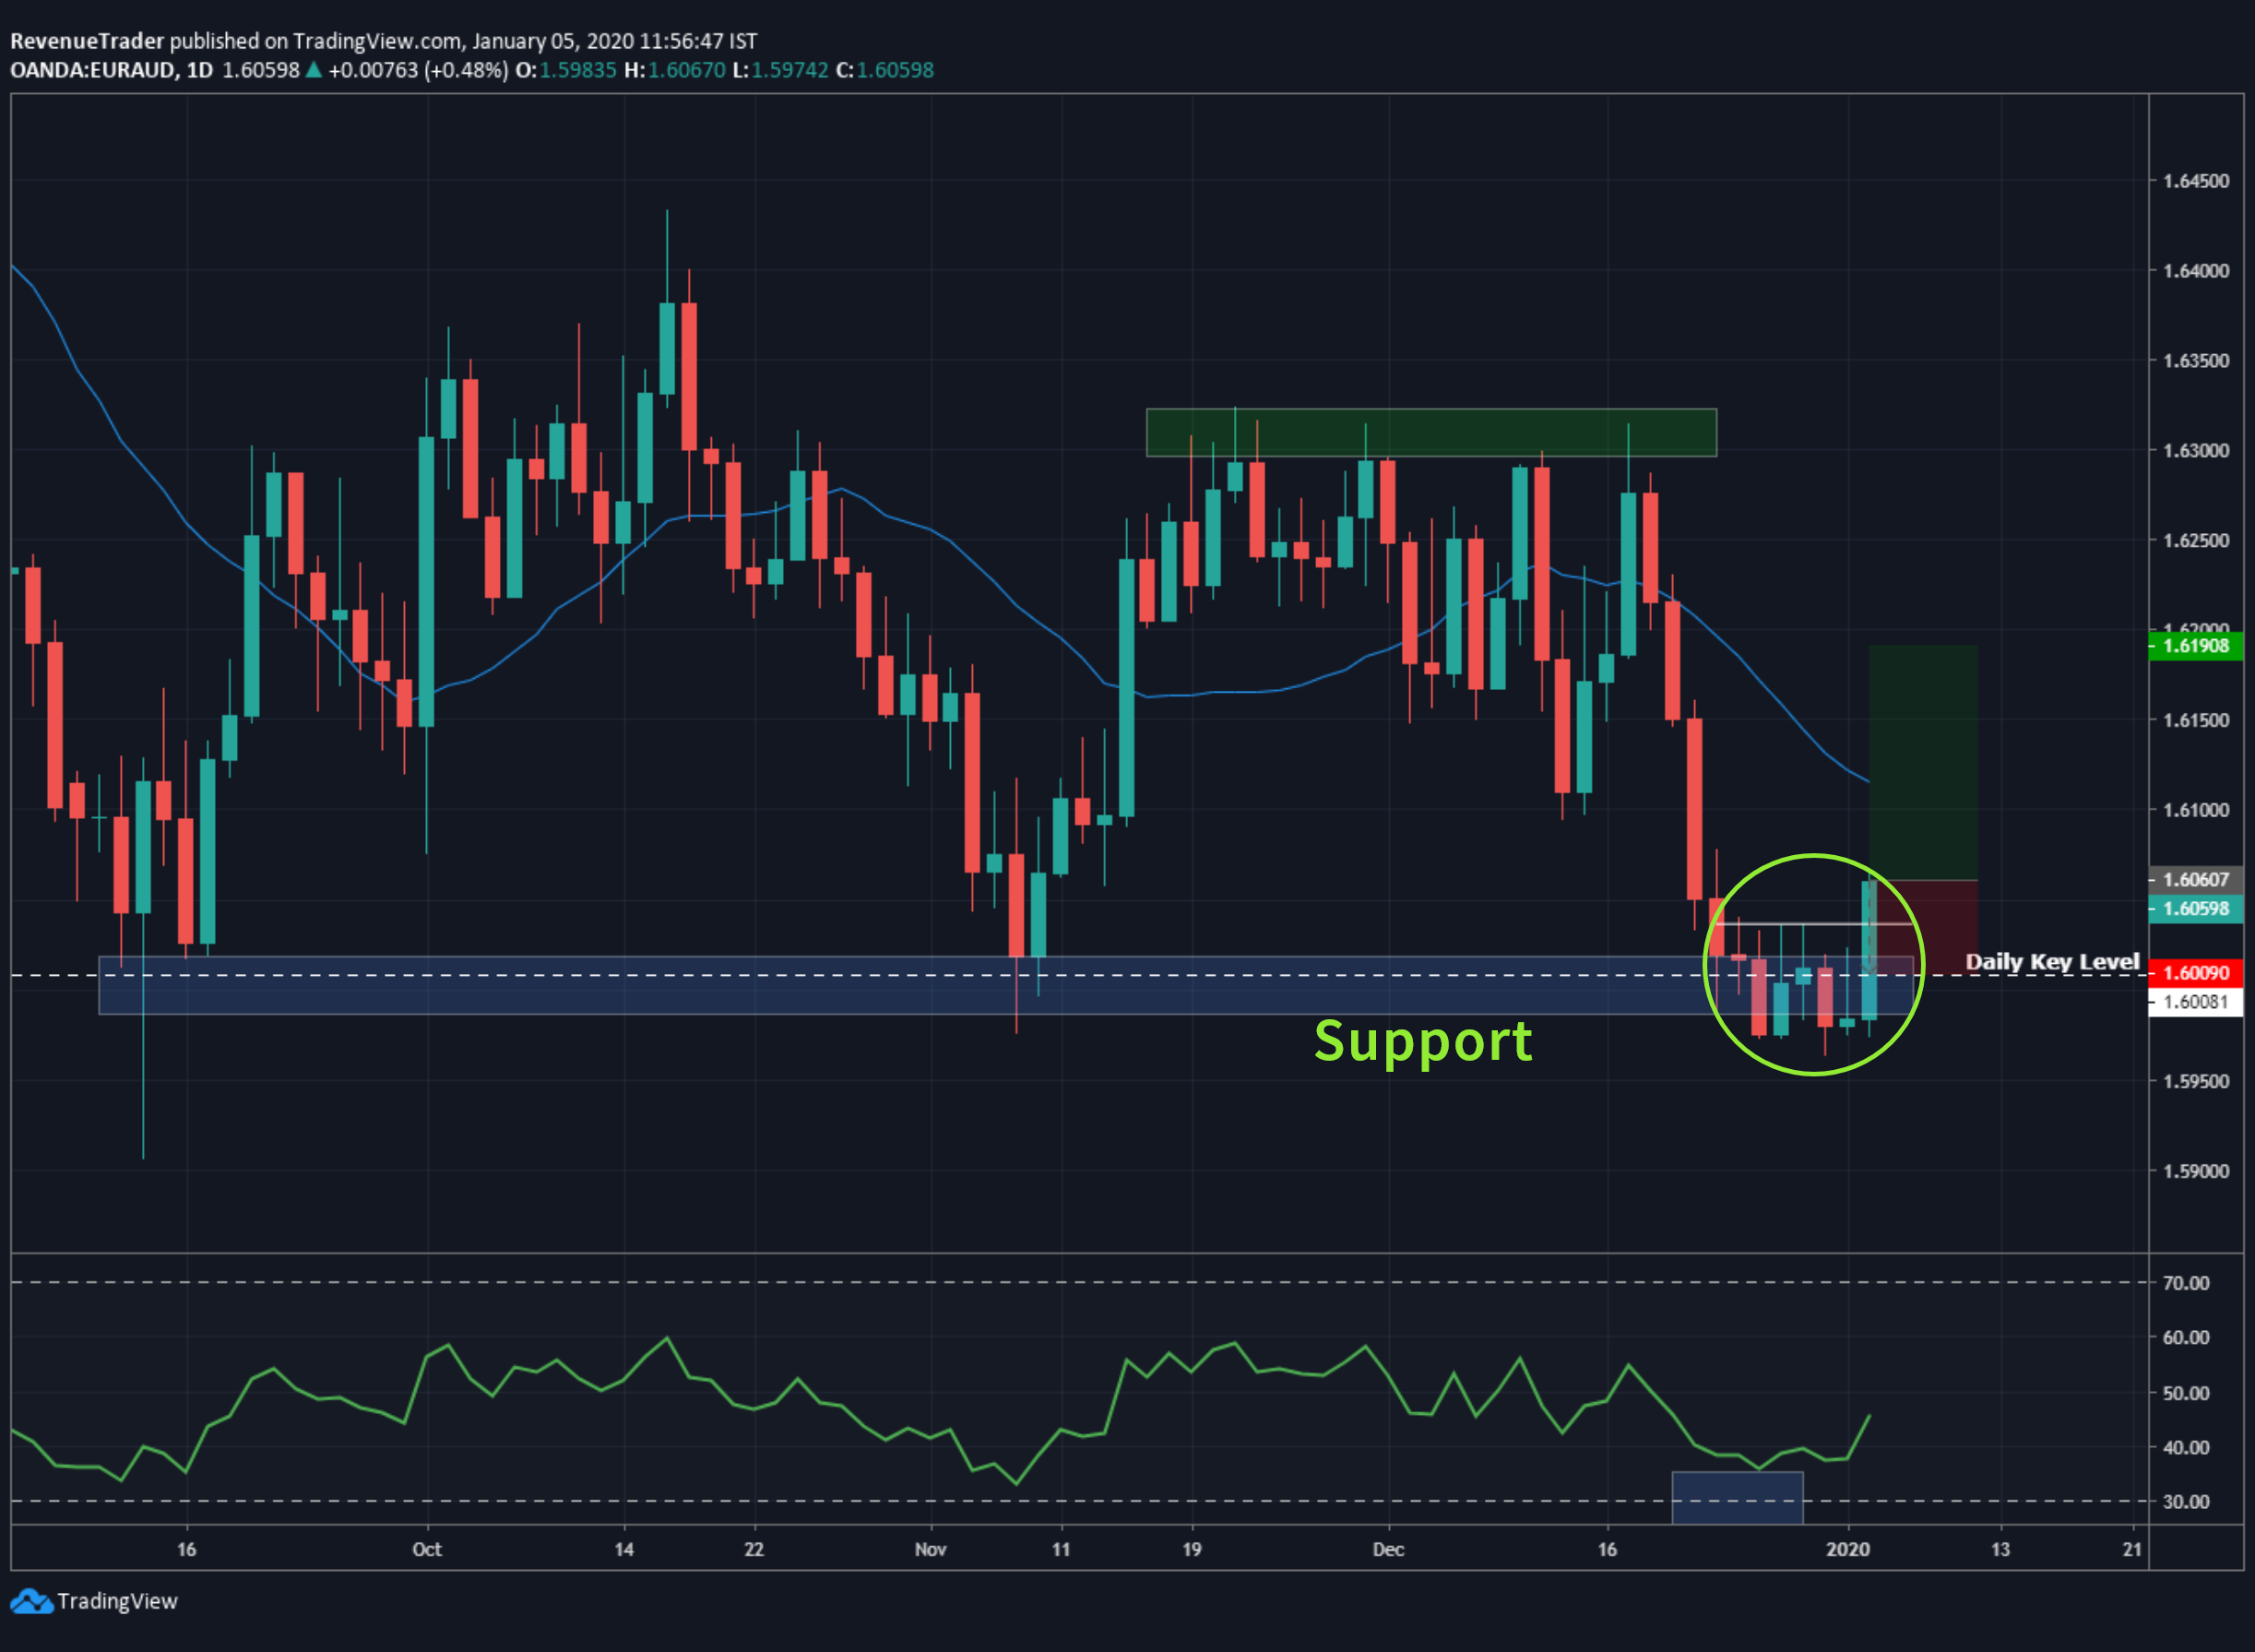
Just like the previous example above instead of resistance, the price is stalling around at a daily support level.
When studying green circle we can spot candles are getting smaller at the support level. Additionally, we have a few Doji candles that indicate an imbalance between buyers and sellers.
Eventually occur of the bullish engulfing candle reflects the buying pressure at the support level.
So when considering all the evidence above we can anticipate a bullish price movement from the support level.
The two examples above describe how to combine Trade Location, Price Action Strength and Price Action Confirmation all together and come up with highly profitable trade setups which helps forex traders to maintain a steadily rising equity curve in the long term.
Lastly Have a look at the EURJPY trade which helps us to banked +3.5R.
Now it is your turn, Head over to Any forex chart and applies these methods to check whether these trading techniques are really going to work or not.
Start with the daily chart, first place support, and resistance level and then move on to analyzing Price action Strength and Finally Wait for a Price Action Confirmations before pulling the trigger.
Listen to the Market and Act Accordingly
No one can predict the forex market but if we listen to the market carefully we get some important clues about price movement.
Here Listen to the market simply refer to the price actions, not the indicators.
So my point here is focused on Pure Price Actions rather than some lagging indicators that may lead to losing trades over and over.
Make trading decisions based on Price Action will help you to make good trade executions every time when you pulling the trigger. This is because you are focused on one clear thing rather than a chart with a lot of indicators.
Final Note
As we learned so far learning how to recognize a candlestick pattern such as engulfing and pin bars is not makes you a profitable price action trader.
But use those patterns at the right time, right location and with the right techniques will undoubtedly make you a consistently profitable forex trader.
If you are a struggling trader, switching to your trading methods to price action trading style will surely make a big difference in your trading career.
I hope you grasp good price action trading techniques in this article. Now don’t blindly apply this method instead backtest these trading strategies and check whether these techniques are matched with your trading personality or not.
If yes, feel free to add these forex trading techniques to your trading plan.
If you have any question ask me in the comment section.


