
If you are new to the world of forex trading, then you are most-probably shifting between different trading systems to different trading indicators until you are finding so-called HOLY-GRAIL forex trading system.
That is a common stage every new forex trader face in the early stage of their forex trading career.
But the universal truth is, Every indicator or trading system follow the price actions, and all the trading signal that your trading system generates is also based on price.
So
My point here is, All the trading system out there follow price actions and not the other way around. So When Trading Forex Prioritize the Price Action First.
In this article, we compelled 6 profitable price action trading tips that help me achieve consistency profit months after months, and the best part is you can apply these price action trading tips right away after you complete this blog post.
Okay, Let’s head over to first price action trading tip,
Combined Price Action With Other Confluences
Identifying a candlestick pattern doesn’t make you a price action trader.
Candlestick pattern identification is only one part of many other price action factors.
Have a look at the forex chart below,
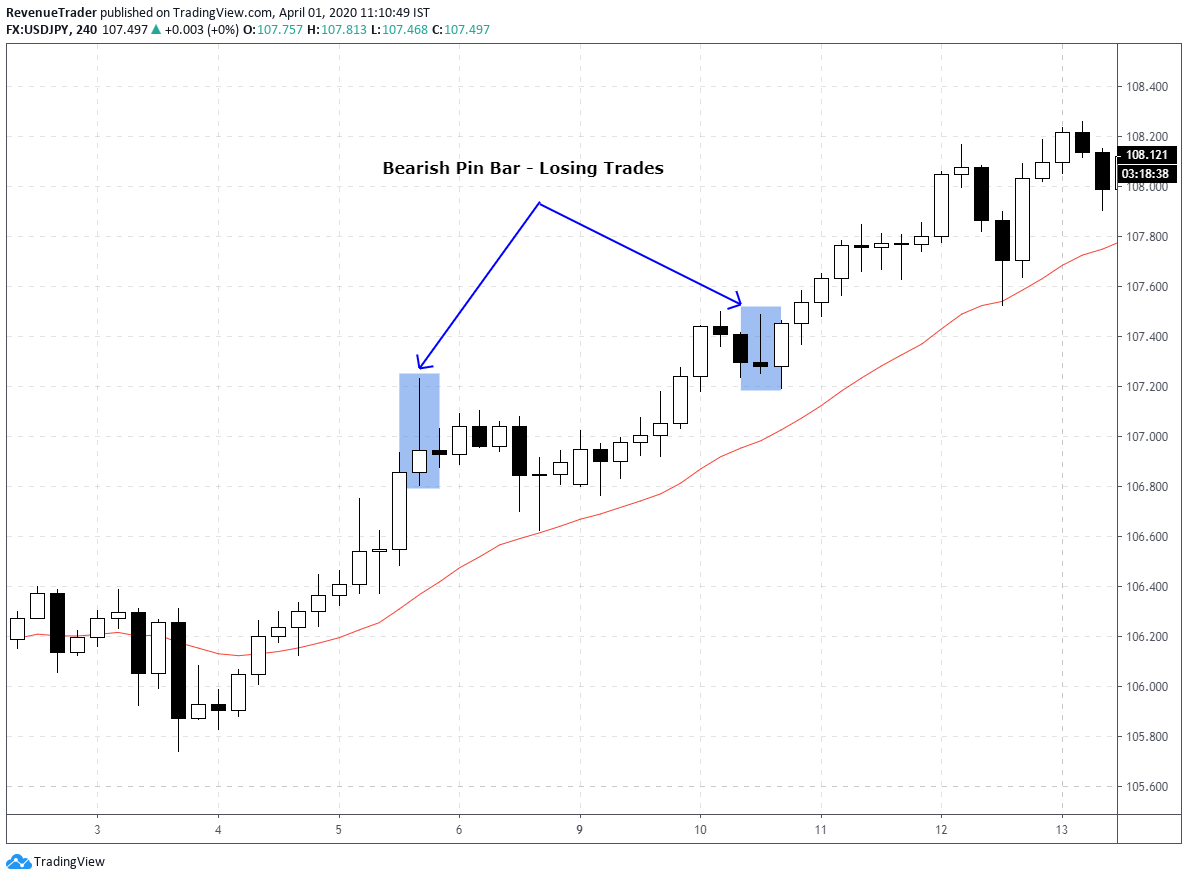
According to the chart above, you can see that the occurrence of two bearish pin bars during an uptrend.
What happens if you placed sell trades after those two pin bars? You ended up losing, right?
The best thing you can do in a situation like this is to look for extra confirmations like support and resistance or chart patterns to support your trade idea.
What do I mean by that?
Imagine having a bearish pin bar at a major resistance level and at the same time, the head and shoulders pattern also occurred in the lower time frame.
Wow, two trading confluences align with price actions at the same time, right?
This kind of trade setups has a higher probability to move in your favour and you can bank nice profit on a consistence basis if you can combine price actions with other trading confluences.
Below forex chart explain this price action trading tips. Study the chart below.
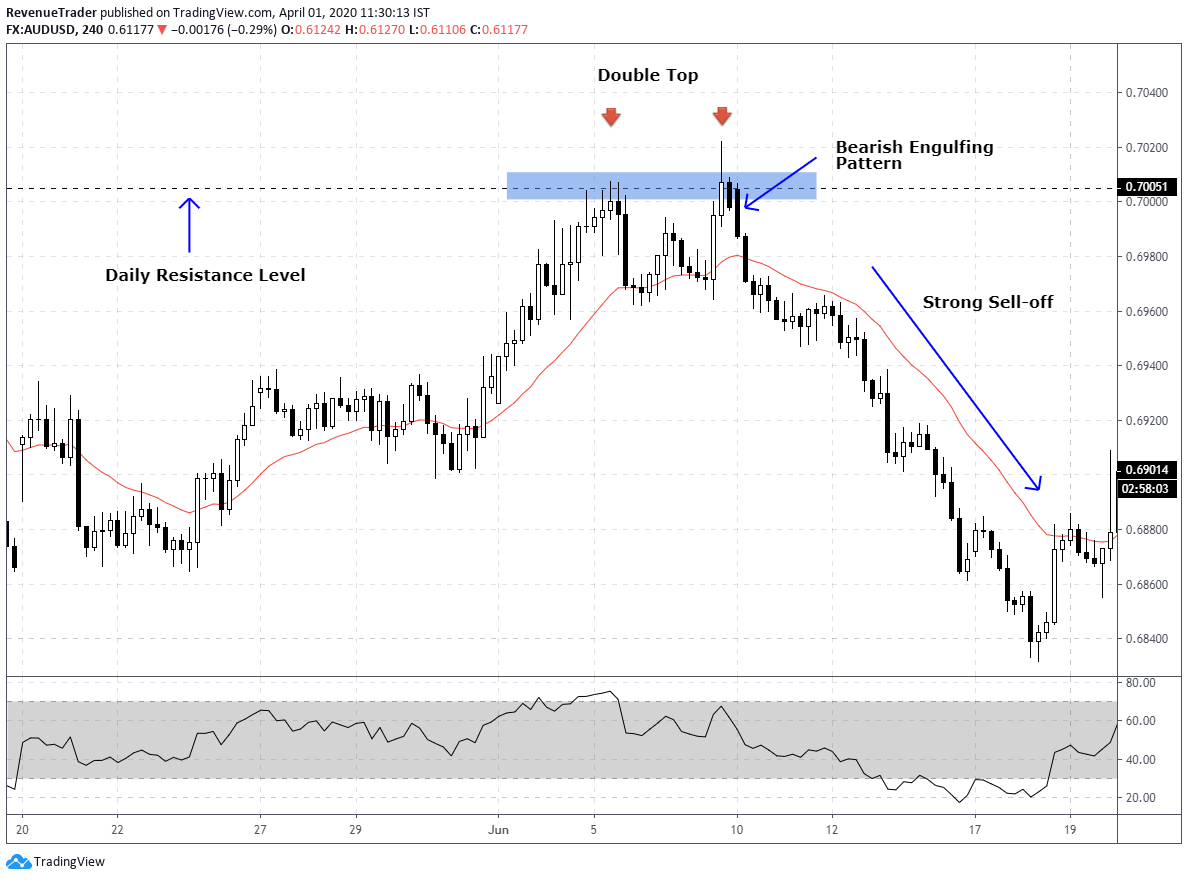
Above is AUDUSD 4-Hour chart, At a glance, you can see that the double top, daily resistance and bearish engulfing pattern align nicely at the same time.
So what happened after that, the price fell from that resistance like a waterfall.
See it is all about finding quality trade setups, that way you can grow your trading account steadily without having bigger drawdowns.
Let’s move on to the second price action trading tip,
Don’t Trade Price Action in No Man’s Lands
What are successful traders says? buy low and sell high, right?
But how do you know what is high and what is low?
To find that, we can use some technical analysis tool like support and resistance or supply and demand or in a trending scenario we can use dynamic support and resistance.
Think about for a moment, what happens if you place your price action trades around only high probability areas and avoid all other price action trading signals that occur in NO MAN’s LANDS?
You take only quality and profitable trades. That what we have to maintain as forex traders, right?
Based on the market condition these high probability areas comes in different forms,
First, we have,
Horizontal Support and Resistance
When the price approaches to support or resistance level price action has a higher chance to move in the opposite direction.
Have look at the charts below,
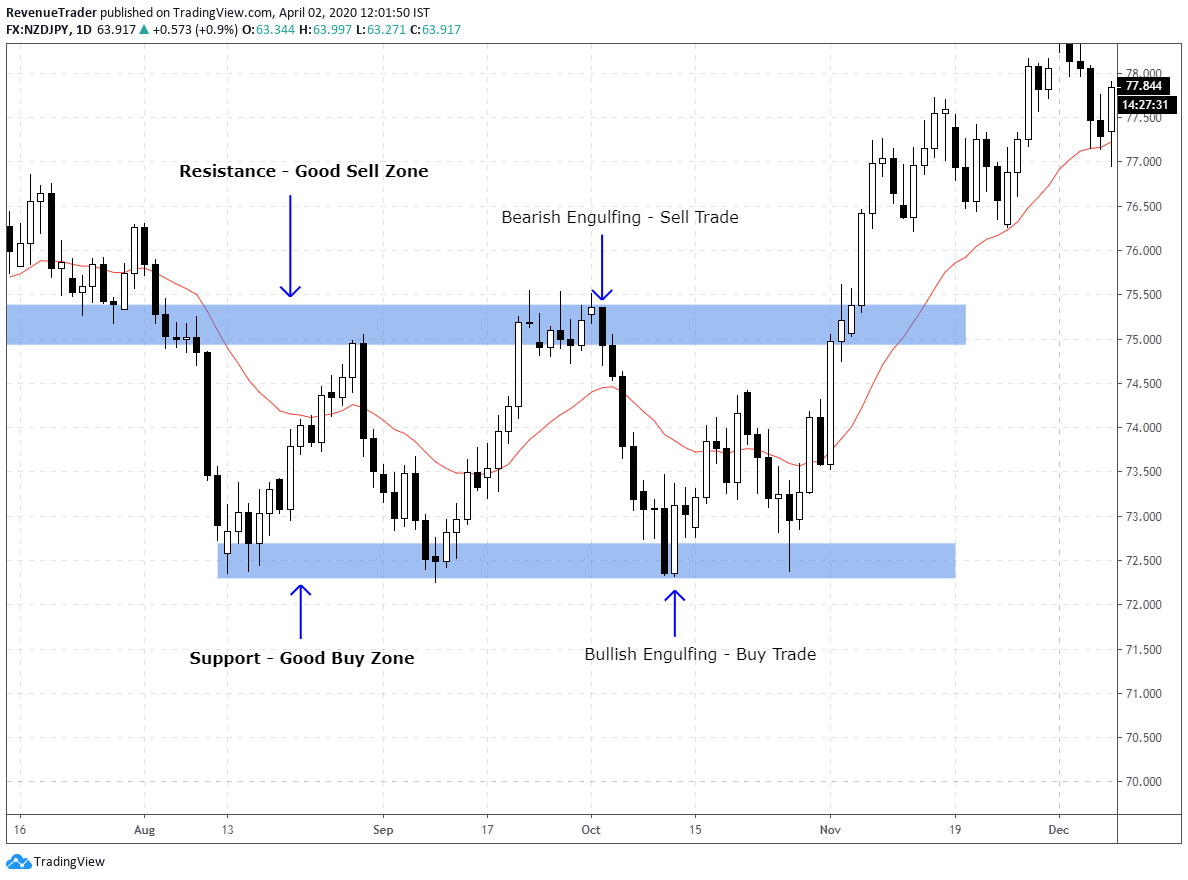
This is good when the market is in a range. But what about when the market is trending.
This is where dynamic support and resistance comes in.
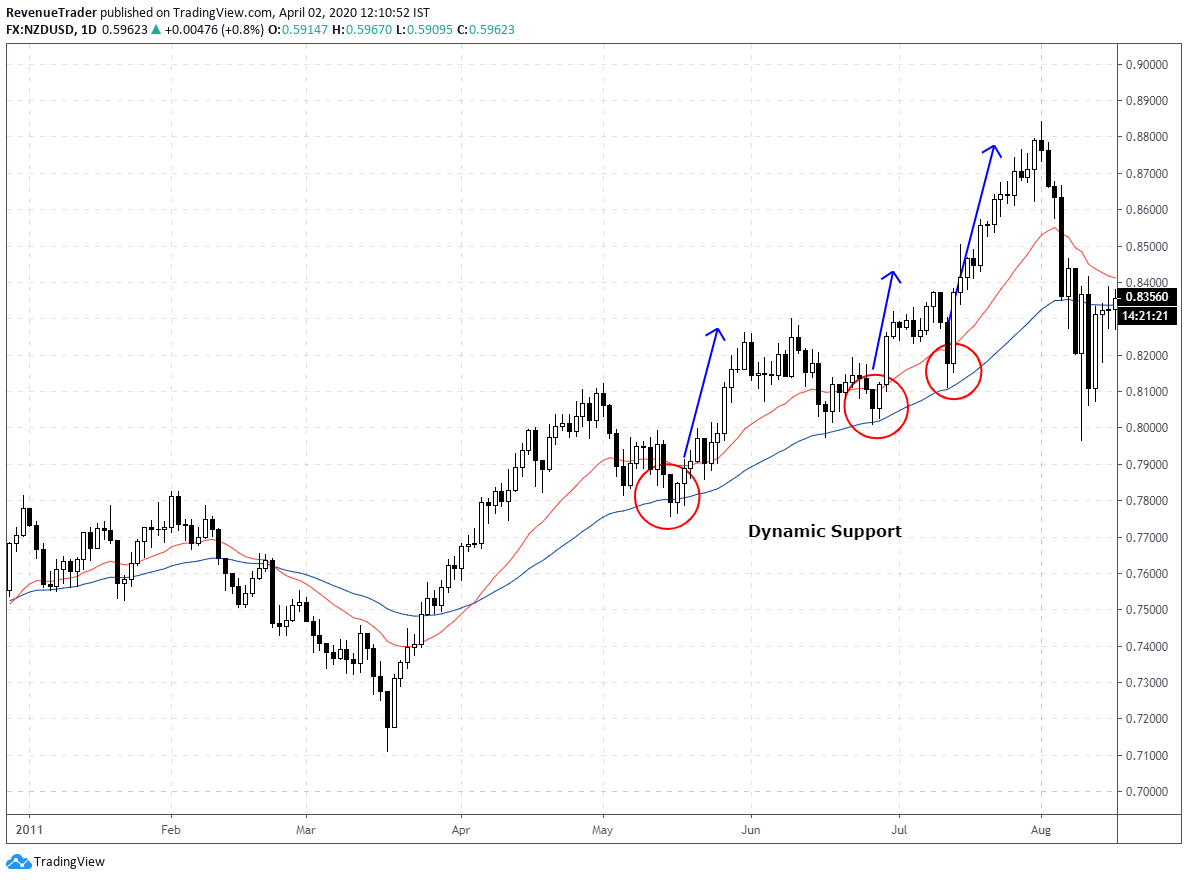
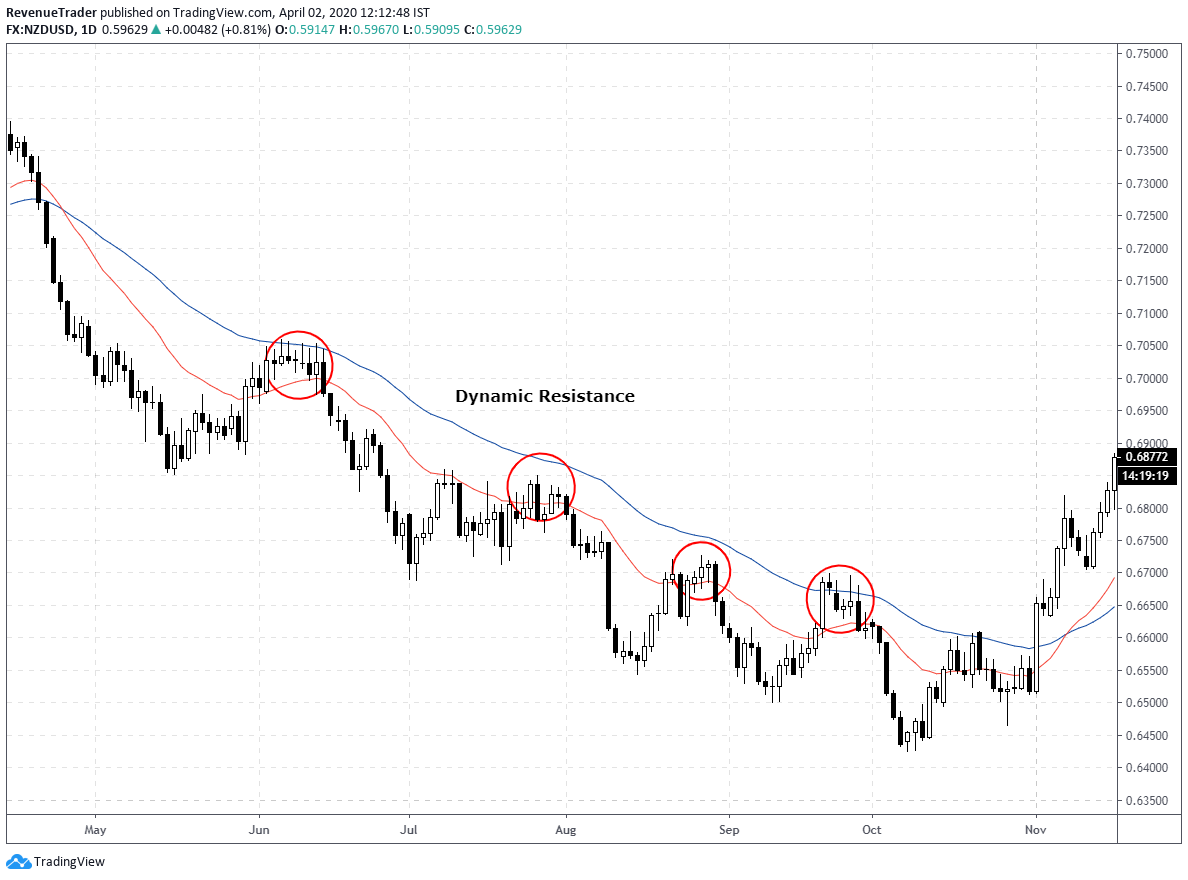
Dynamic Support and Resistance in Trending Market
We use 20 & 50 Exponential Moving Averages to identify these dynamic support and resistance levels.
These levels move with the price that is why they are dynamic. In an uptrend, we are looking to buy from these zones. Look at the chart below,
In a downtrend, We are looking to sell as price pull back to the dynamic support and resistance.
Now let’s move to the third price action trading tip,
Understand the Market Conditions
The forex market is always changing. Sometimes it is trending up or down, sometimes it is ranging and sometimes the market move because of the releases of major news announcements.
When the market switch it conditions we also need to adjust our trading strategy or system accordingly.
For example, when the market is trending up we can use bullish price action signals to buy and in a downtrend, we can use bearish price action signals to sell the market. Have a look at the chart below,
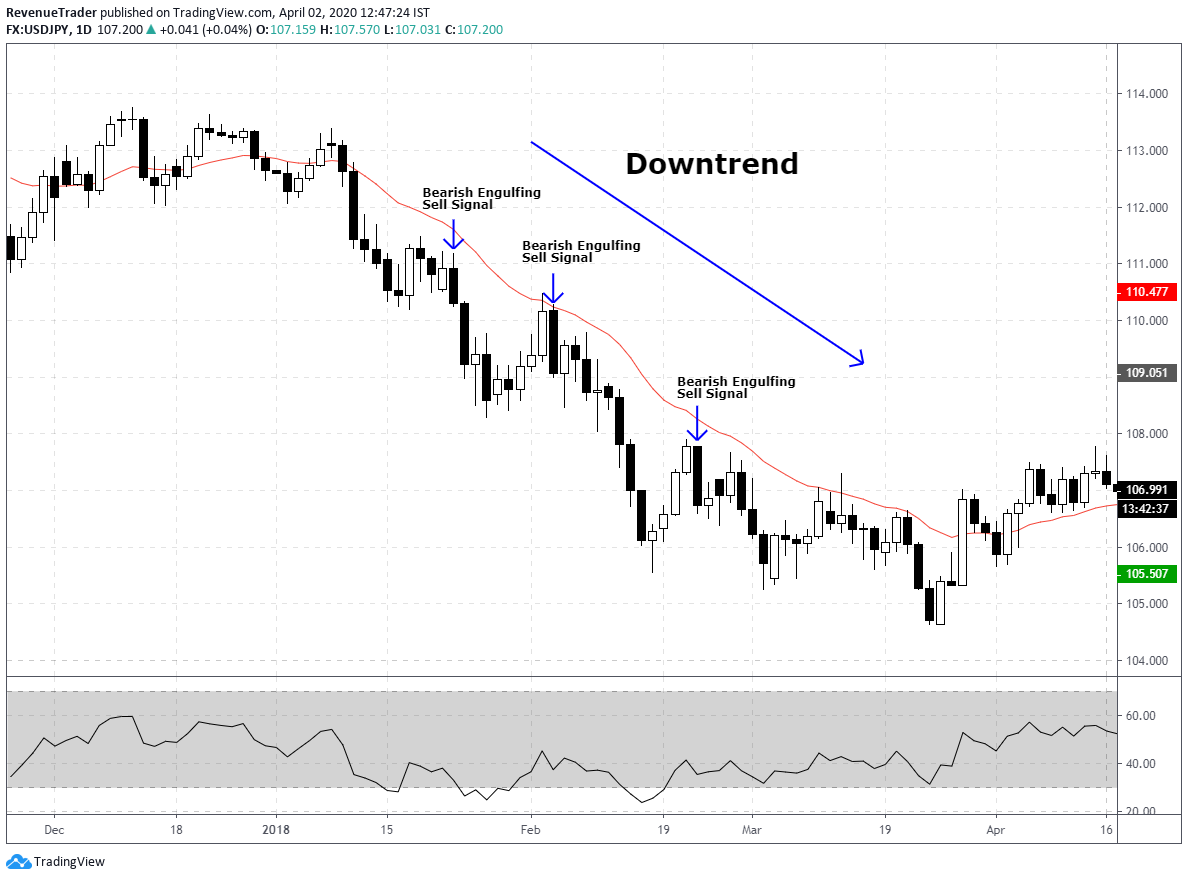
My point here is When the Market is trending, place your trades in the direction of the trend.
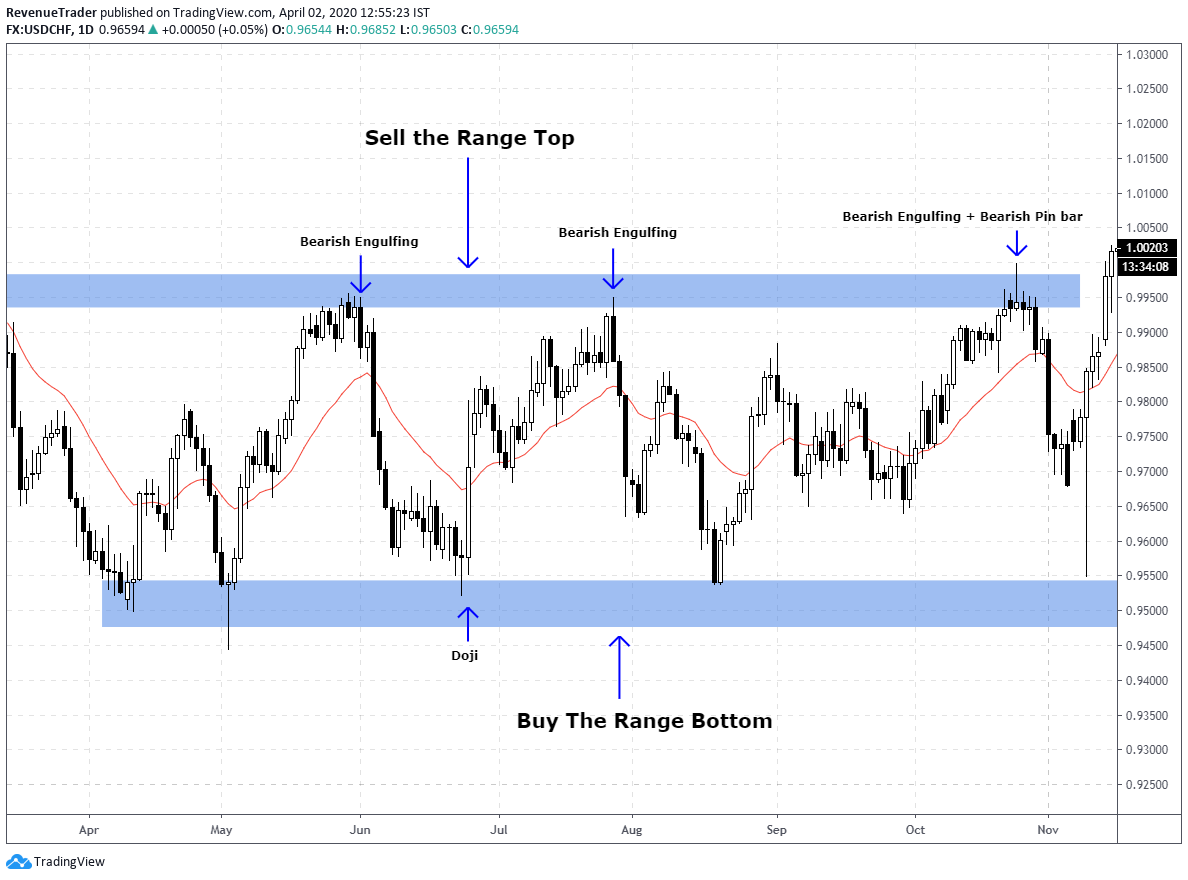
What to do when the market is ranging or consolidating?
The answer is simple. You can use Range top to sell and Range Bottom to Buy. Don’t try to place trade inside the range. That is the worst thing you can do as forex trader.
Have a look at the chart below,
This price action trading tip is the most important one because understanding the market condition and adjust accordingly is what decide your trading system’s performance.
Okay let’s move into the next price action trading tip,
Keep Your Eyes on Price Momentum
Personally, this is one of my favourite price action tip that I learned in my trading career.
This price action techniques work over and over again, not only that, but also when this trading technique comes into play, I always ended up making a good return.
So what is the price momentum and how to analysis it?
Price momentum is the ability to move the price in a particular direction on any assets. The higher the momentum the bigger the move. It can be bearish or bullish.
We can simply measure the momentum by analysing the price waves. The bigger the wave higher the momentum it carries. Have a look at the chart below.
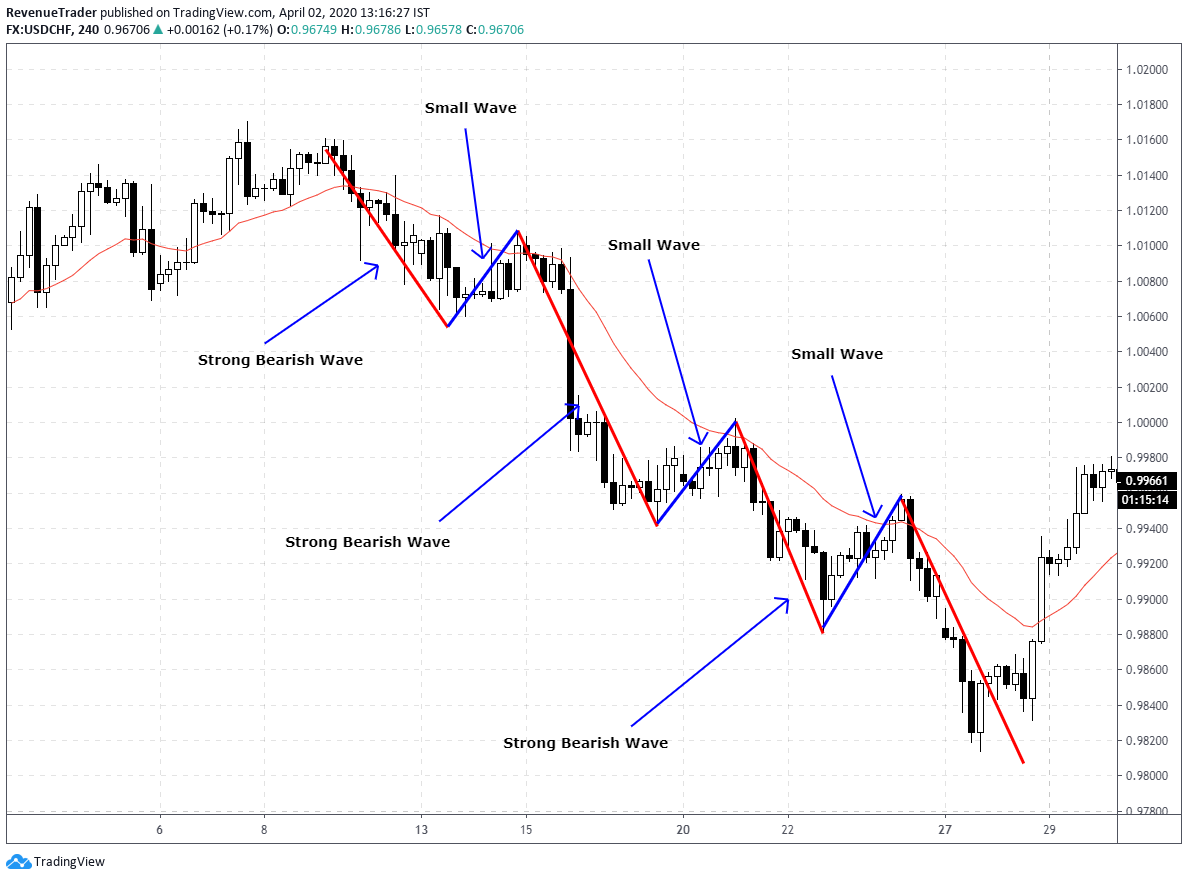
According to the chart above, you can see it is a downtrend. Have a look at the Red Lines, they are stronger and longer than the Blue lines, right?
This indicates the stability of bearish momentum in the downtrend.
See we can use this approach to determine the strength of the trend as above.
We can also use this price action technique to identify reversals as well.
Have a look at the Chart Below,
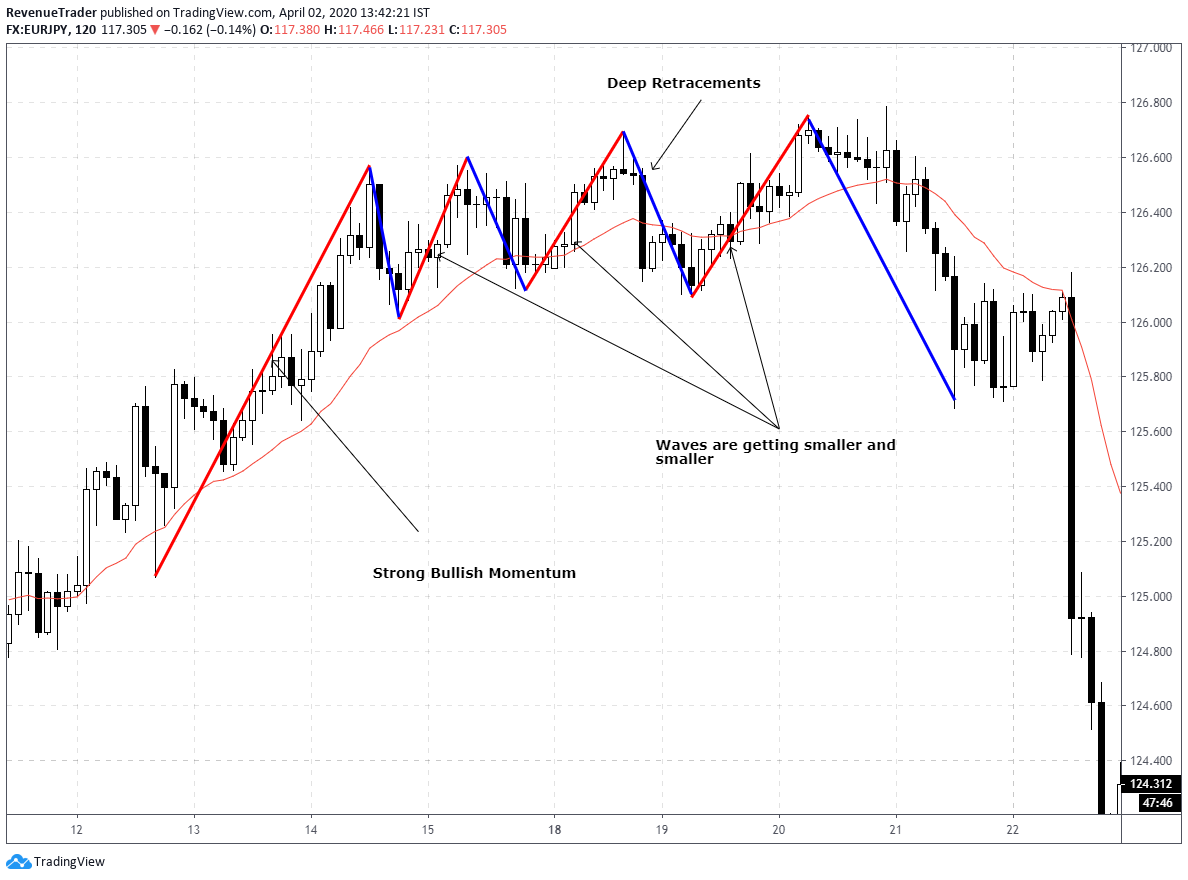
According to the chart above, you can see trend starts strongly and then It starts to lose its momentum.
If you look at the Red Lines, you can see that they are getting smaller and smaller. This indicates the losing momentum of the buyers and at the same time, retracement waves (Blue Lines) are starting to get bigger and bigger. This indicates the selling pressure that builds on this pair.
See what happens after that, A big Reversal, right?
See you can use this simple momentum analysis technique to find trend structure and as well as trend reversals.
Play with this price action trading tip because this trading tip along helps me to earn good profit from the forex market. So why not try.
Okay Let’s Move into the next price action trading tips,
Read Trend Structure Carefully to Identify Trend Reversal
The trend is our friend, that is what big players in this forex business said, right?
Yeah, it is true, we should follow the trend in order to make a good gain.
But, the trend doesn’t go forever. At some point, it has to stop or has to reverse.
So the question is how to identify the trend reversal?
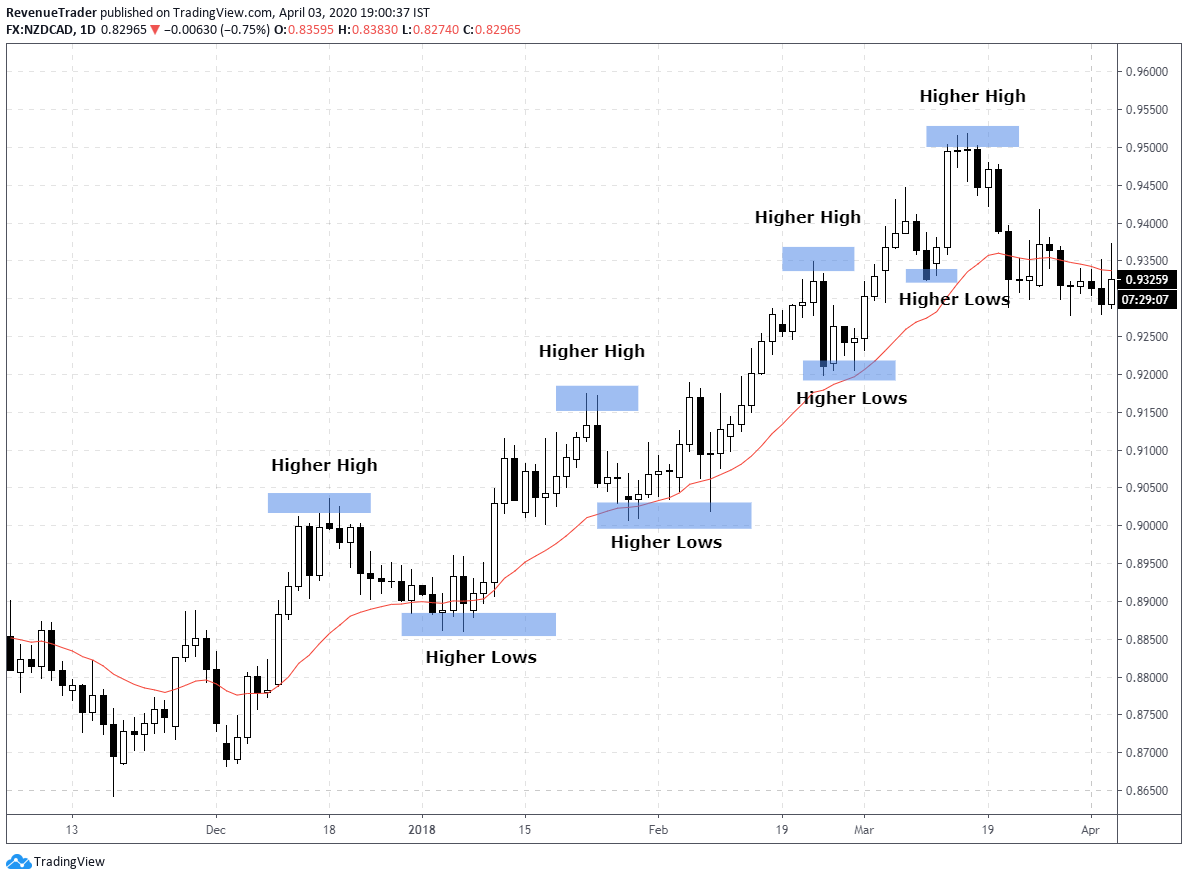
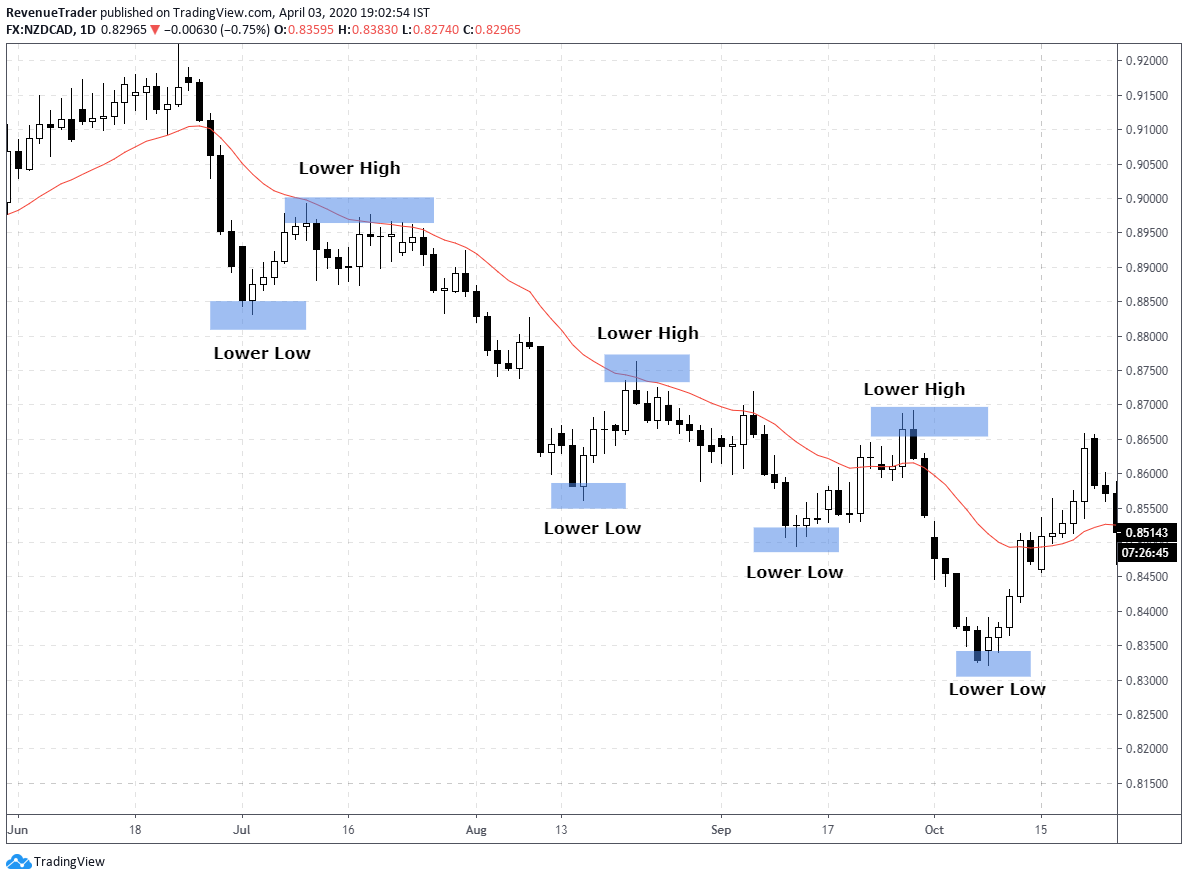
For that, first, you have to identify the trend structure. Have a look at the two charts below.
In an uptrend, the market creates Higher Highs and Higher Lows,
In a Downtrend, the market makes Lower Lows and Lower High,
Next, how do we identify if this trend is going to reverse or not?
According to the first chart above, in an uptrend, the price makes a series of higher highs and higher lows. But, what if the price action starts to makes Lower Lows during an uptrend. It is a Reversal Sign, right?
Have look at the chart below,
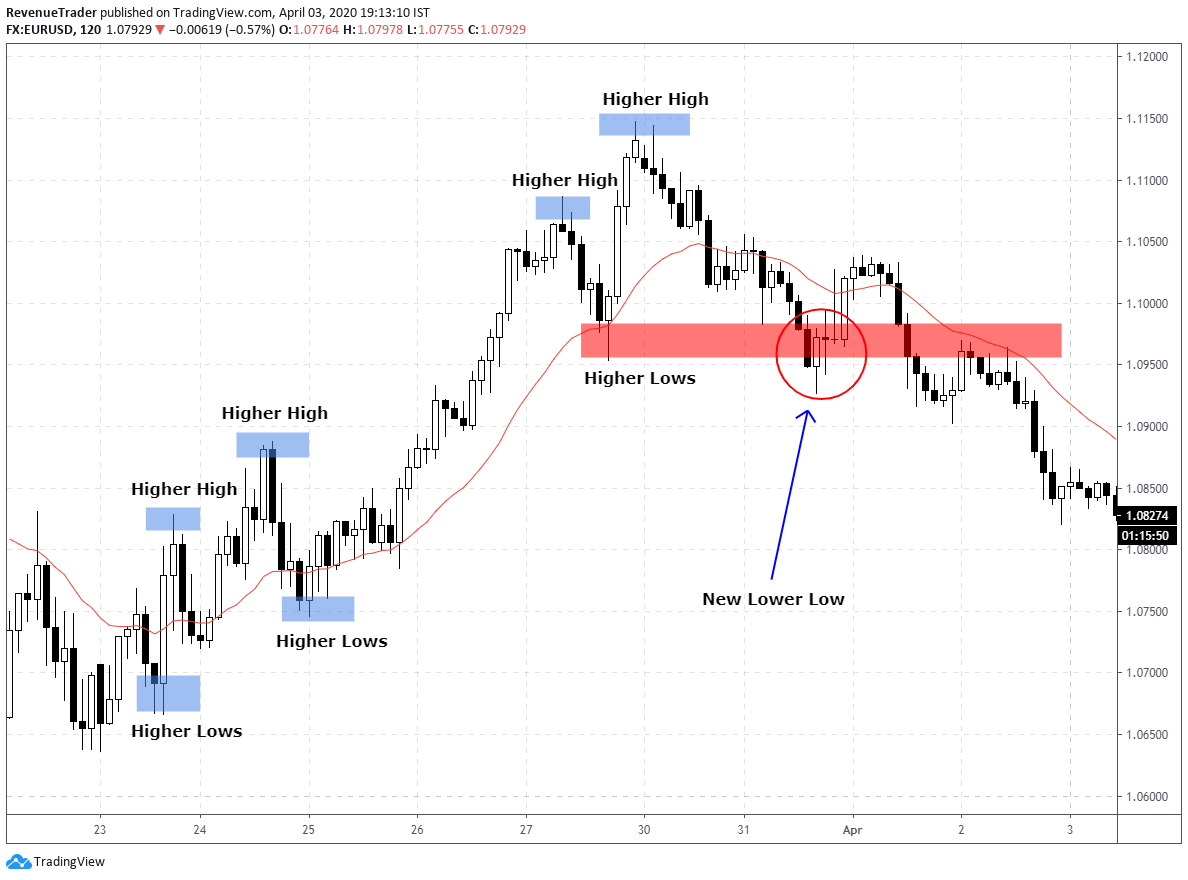
From the left in the above chart, you can see that the price actions makes a series of higher highs and higher lows. But have a look at the last Higher High. From there price pull-back all the way down to the previous Higher Low and broke below that level (Red Zone).
The broke below of that red zone is very crucial. Why is that?
Because price made New Lower Low, which made the previous trend invalidated.
So what happened after that, The whole fundamental has changed and price made a huge reversal, right?
This is a great price action trading technique that helps you catch the trend very early.
Now it is time for the last price action trading tip.
Combined It All Together
It’s time for the last Price action trading tip. This is not a new price action trading tip, but the combination of all the price action trading tips we talked so far.
As forex traders our job is to place the higher profitable trades with the risk in mind, right?
But what is the factor that increases trade profitability?
It is the trading confluences.
Study the two trade scenario below,
- Bearish Engulfing Pattern in an Uptrend
- Bullish Engulfing Pattern in Dynamic Support in an Uptrend
Which trade you are going to place? first one or second one.
If you focus on Quality, then you probably going to choose the second one, right?
But why is that?
The second trade has two trading confluences, Bullish Engulfing Pattern at Dynamic Support Level and above all, These two confluences match with the current market condition as well, in this case, it is an uptrend.
See, rather than focusing on one trading signal that generates all over the forex chart, It is always better to stay patient until you come across with trade opportunities that carry higher momentum and high probability.
Have a look at the forex trade below,
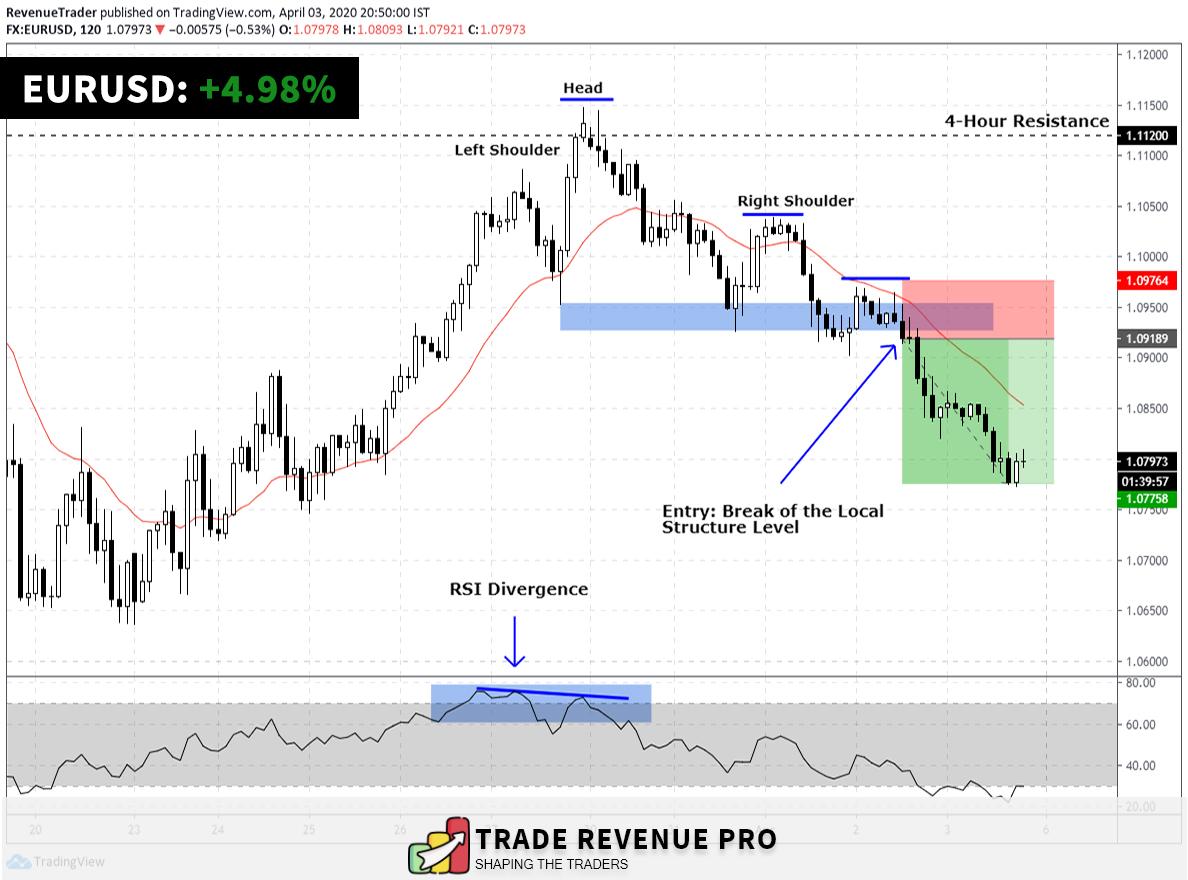
This is the EURUSD 2-Hour chart. First, we can see the price is at a resistance level that comes from the 4-Hour chart.
Next, the price did try to break above the Resistance level but ended up failing. This eventually formed a head and shoulders pattern with the RSI Divergence.
Now we have three trading confluences aligned at the same time and every confluences indicate the weakness of current uptrend.
Now it is a matter of placing sell trade, right?
But we need a logical place for that. What if we place a sell trade after price broke below Previous Higher Low. Now that is logical, why?
Like I said earlier, Break below of the Previous Higher Low makes the structure of the current uptrend invalid hence we can anticipate trend reversal.
Trading is all about executing quality trades while managing your risk and reward.
If you are struggling to make consistence money from the forex market right now, then stop placing trades everywhere when you get trade signals.
Focus on quality trade setups that give you both low risk and probability. Yeah quality trades are not always there and you have to patiently wait for those opportunities, but they are worth waiting.
Remember that,
QUALITY OVER QUANTITY.
Now it is your chance, Go through some forex chart and test these 6 price action trading tips to whether they are actually working or not.
I hope you got some valuable information from this trading article. If you have any doubt feel free to ask the question on the comment section.
Finally, do me a huge favour by answering the question below.
- What kind of topic you will want from us?


2 Responses
Outstanding explanation. You really have put a lot of effort into this works. Thanks very much.
Glad you found it helpful, Rehan.