
As a forex trader, identifying support and resistance is one of the crucial skills to obtain to become a consistently profitable trader.
This is because understanding the basic concept of support and resistance would improve any trading methods out there.
In this article, we will talk about how to identify these keys levels correctly and trade them in a consistent way.
But first…
What is Support & Resistance Levels?
Support and Resistance levels are the previously tested levels in a forex chart, where the currency pairs (or equity, commodity, etc.) will likely find a barrier in the near future. The reason behind this is that these are psychological levels showing the different behaviours of the market players including you.
What happens when price approach to these key levels,
when price approach to such key levels it could lead to a bounce in the opposite direction or lead to consolidation or else the level could be broken and the price could make rapid continuation move.
Support and Resistance levels are like a battle zone between buyers and sellers.
The stronger one always beat the weaker ones, which means if the buyers have more buying pressure at the support, they can bounce the price easily from the support level and sellers will fail to break the support level.
What is the Difference Between Support & Resistance
The answer is, Support are the levels which are under current price and resistance are the levels above the current price. Moreover, when the price goes up through a resistance level and breaks it, this level now becomes new support and vice versa.
Let’s talk above phenomenal in a detailed manner,
When breaking the level in a bullish direction, price relocates above that level and the old resistance levels now serve as an area of support. Have a look at the chart below.
According to the chart above,
The red horizontal line serves as both a support and resistance level.
Also, the black boxes show that price respect this level as a resistance level until the red horizontal line broke – marked in the blue box. And eventually, the price pushed back to the red horizontal line which now acts as support – marked in the red box in the chart.
This is a fine example of how resistance could turn in to support and how they provide a profitable trading opportunity in the near future.
How to Identify & Place Support and Resistance in Forex Chart
Finding and placing support and resistance levels in the forex chart is easy. We can take every swing high as potential resistance and every swing low as potential support in the future.
Please notice that these all are not actual levels these are placed based on the probability and, as forex traders, we need to have extra confirmations to called these levels as actual levels.
Let’s See how to place support and resistance levels,
First of all, Support and resistance levels vary from time frame to time frame. You can find more reliable levels of support and resistance in higher times comparing to the lower time frames.
For the sake of this guild, I will use the Daily timeframe.
Okay, now switch to a daily time frame.
Then turn your classical candlestick chart into the line chart. Because, in the line chart, we can spot major swing points easily.
Then start to place support and resistance levels using major swing points. Have a look at the example below.
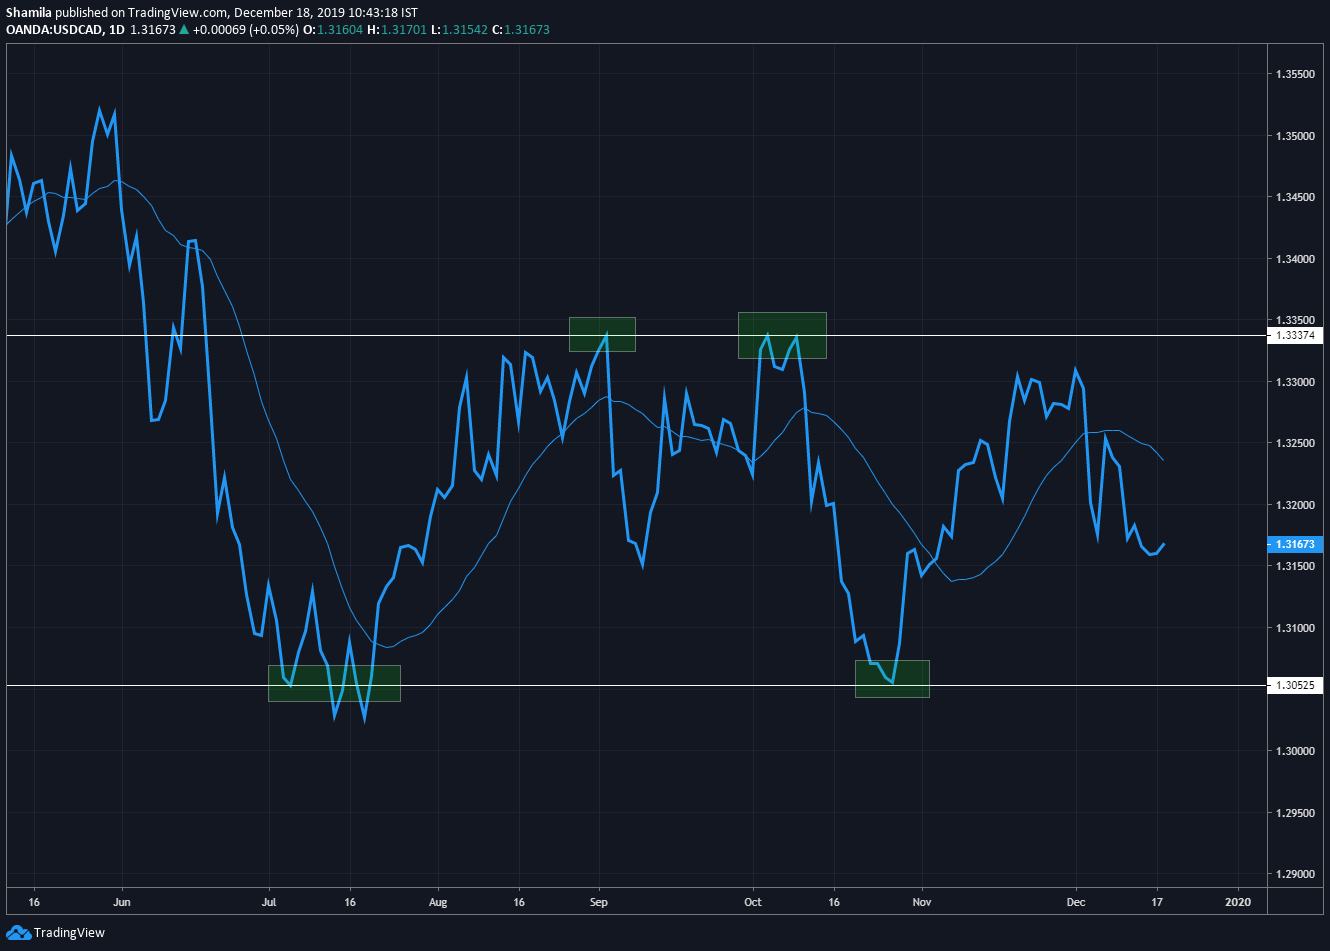
According to the above chart, we placed our support and resistance using swing points (Green box).
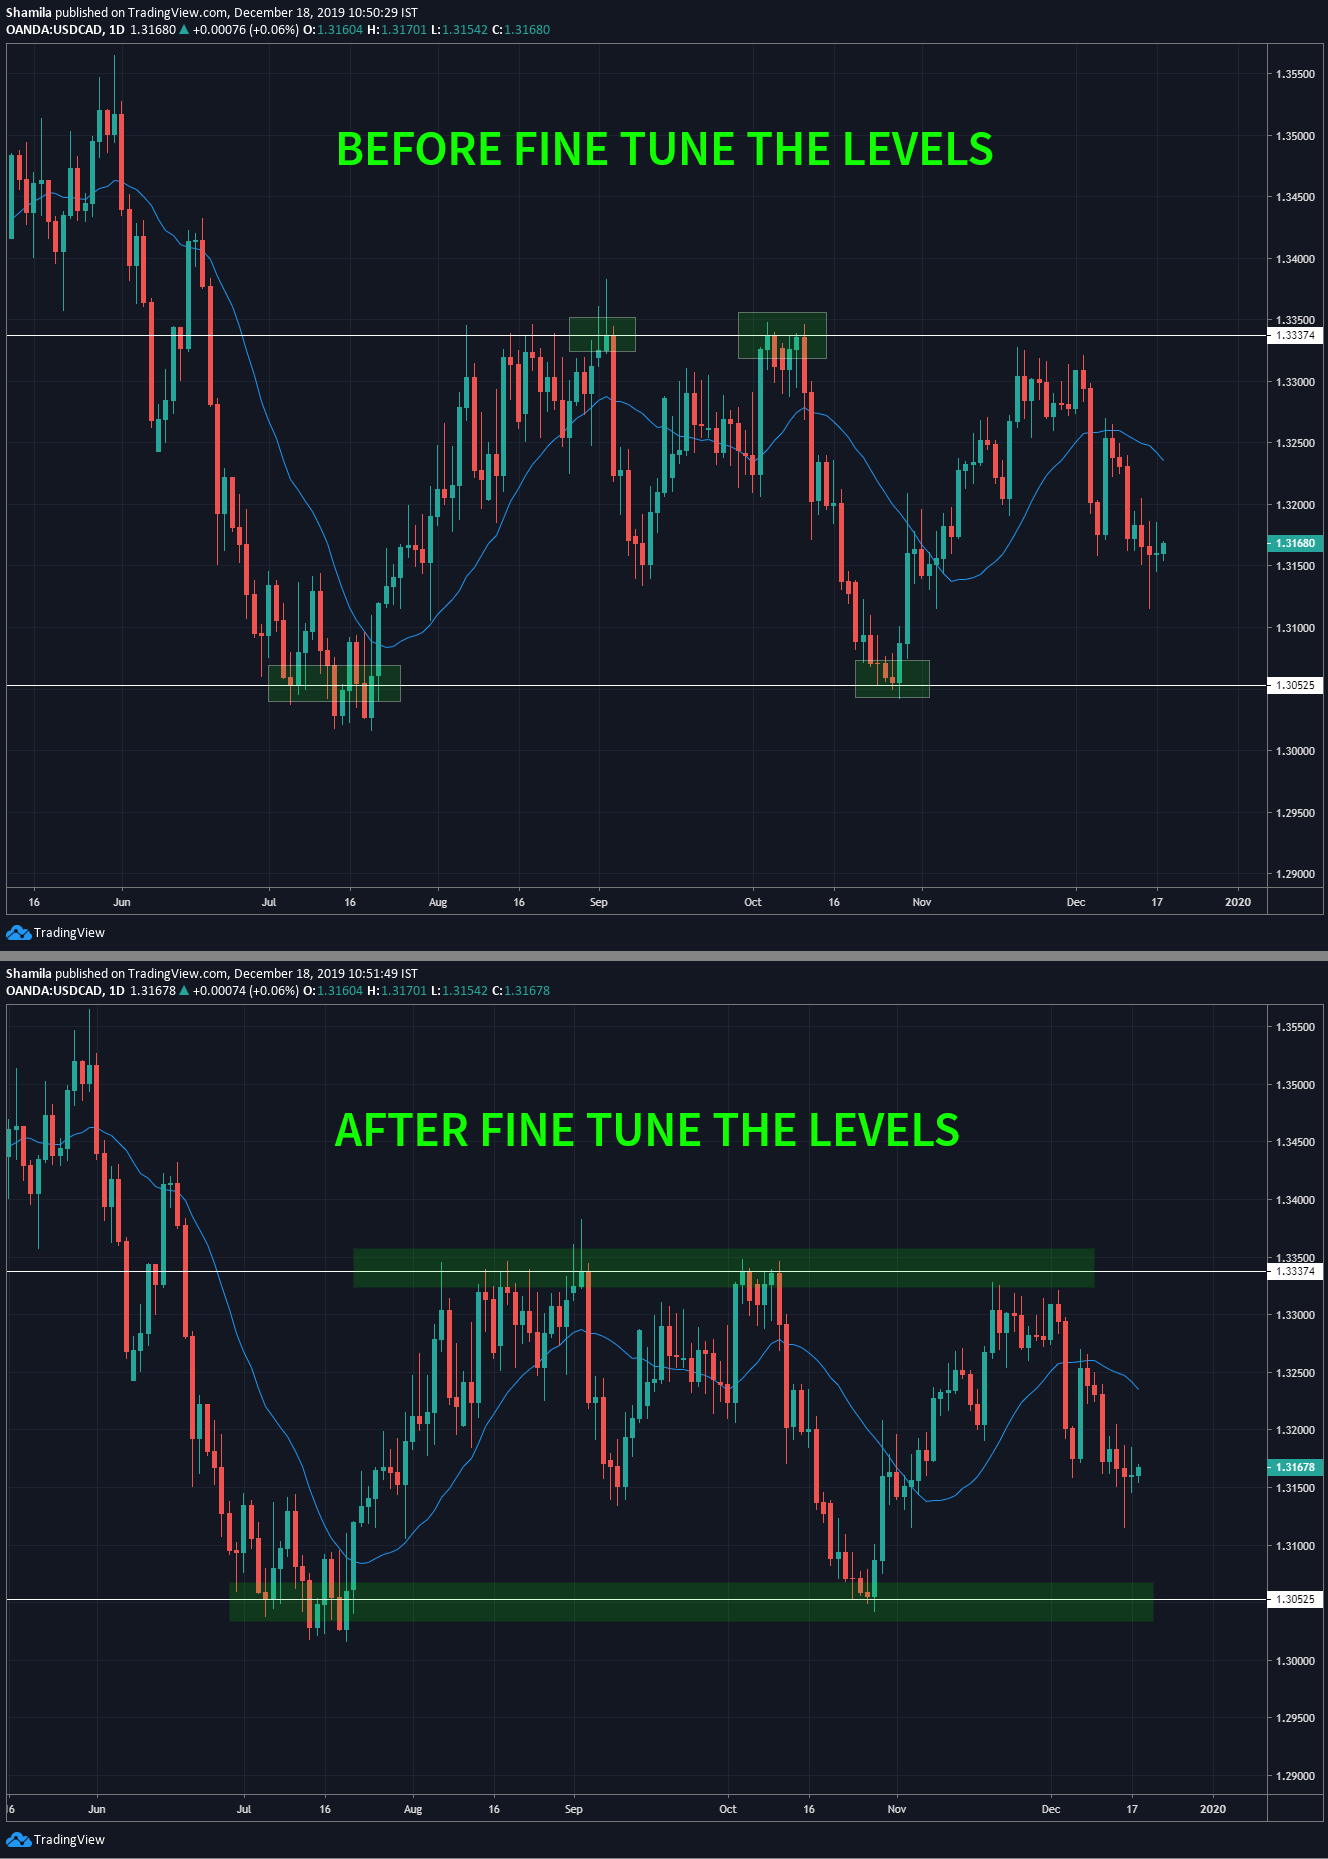
Now it is time to fine-tune our levels. For that switch back to the candlestick chart and turn your levels into zones. To understand this have a look at the two charts below.
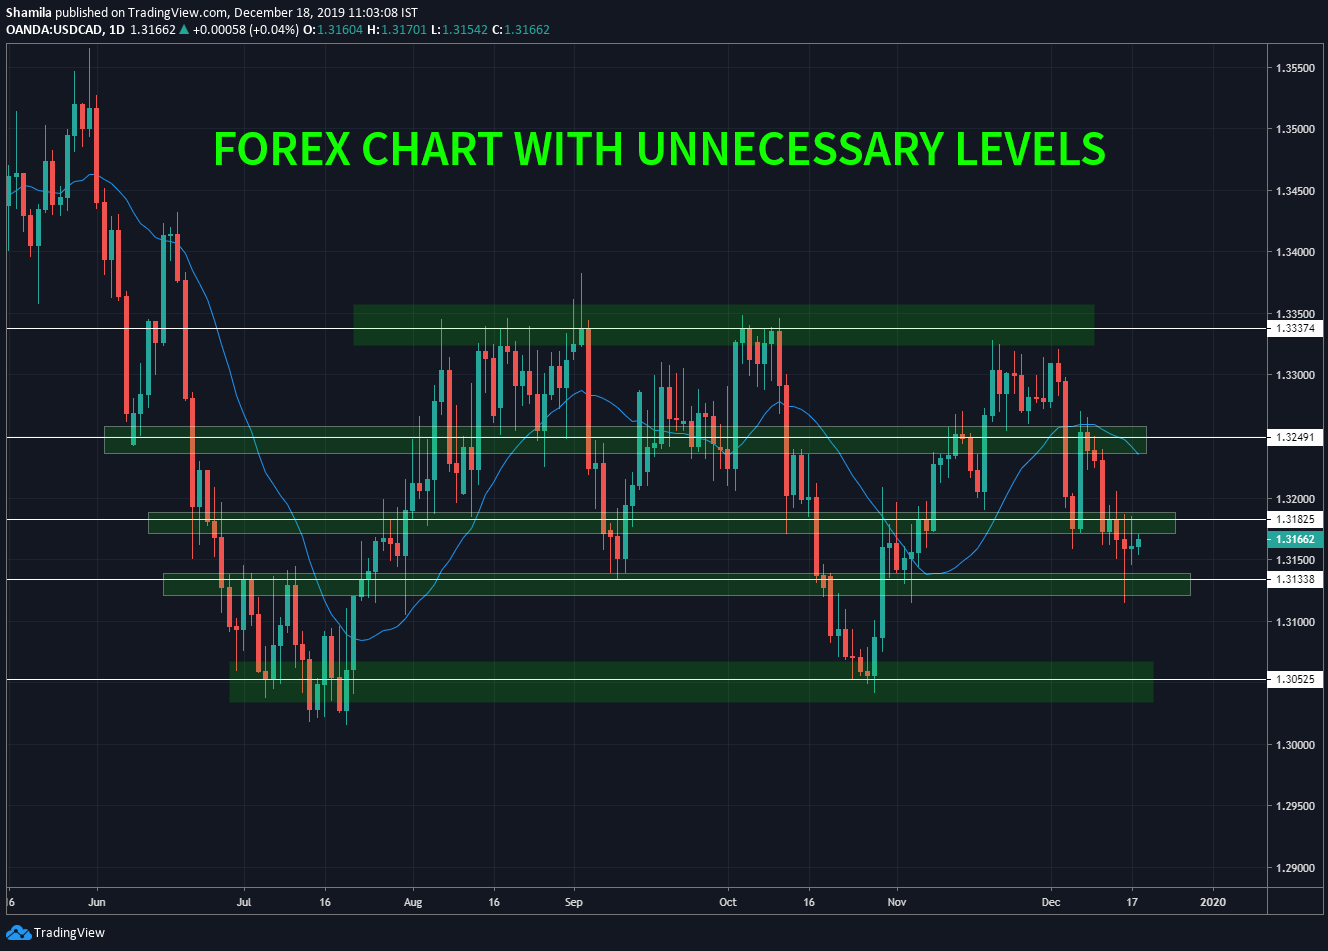
Special Note for beginner traders: Don’t overcomplicate your forex charts by placing unnecessary support and resistance. Make sure place major levels only. ’cause these are the most reliable and most profitable levels.
The chart below is an example of overcomplicated forex chart.
How to Trade Support and Resistance Levels
Before diving into this topic, Keep this in mind – You cannot trade support and resistance alone. It will lead to unprofitable trading.
But if you combined support and resistance with other technical clues, then you may have a chance!
Notice that I said a chance, But why is that?
Because you can have the best strategy in the world but without proper risk and money management method this strategy ended up losing money over time.
Here is the simple profitable formula,
Profitable Trading = Rule-based strategy + Sound technical analysis + Risk and Money Management + Good Psychology Management
Okay, let’s talk about how to trade these support and resistance in a profitable way.
What happened when the price hit a support level. Maybe the support level will break or it will hold. But as a forex trader how to approach this situation.
Let’s talk about this.
First, let’s say we are trading reversal from these levels, which means we are looking to sell at the resistance and looking to buy at the support.
So the problem is how to get into a trade when price approach to such a key level. This is where the entry technique comes in.
For the sake of this tutorial, I’m using RSI and M/W pattern.
Have a look at the chart below,
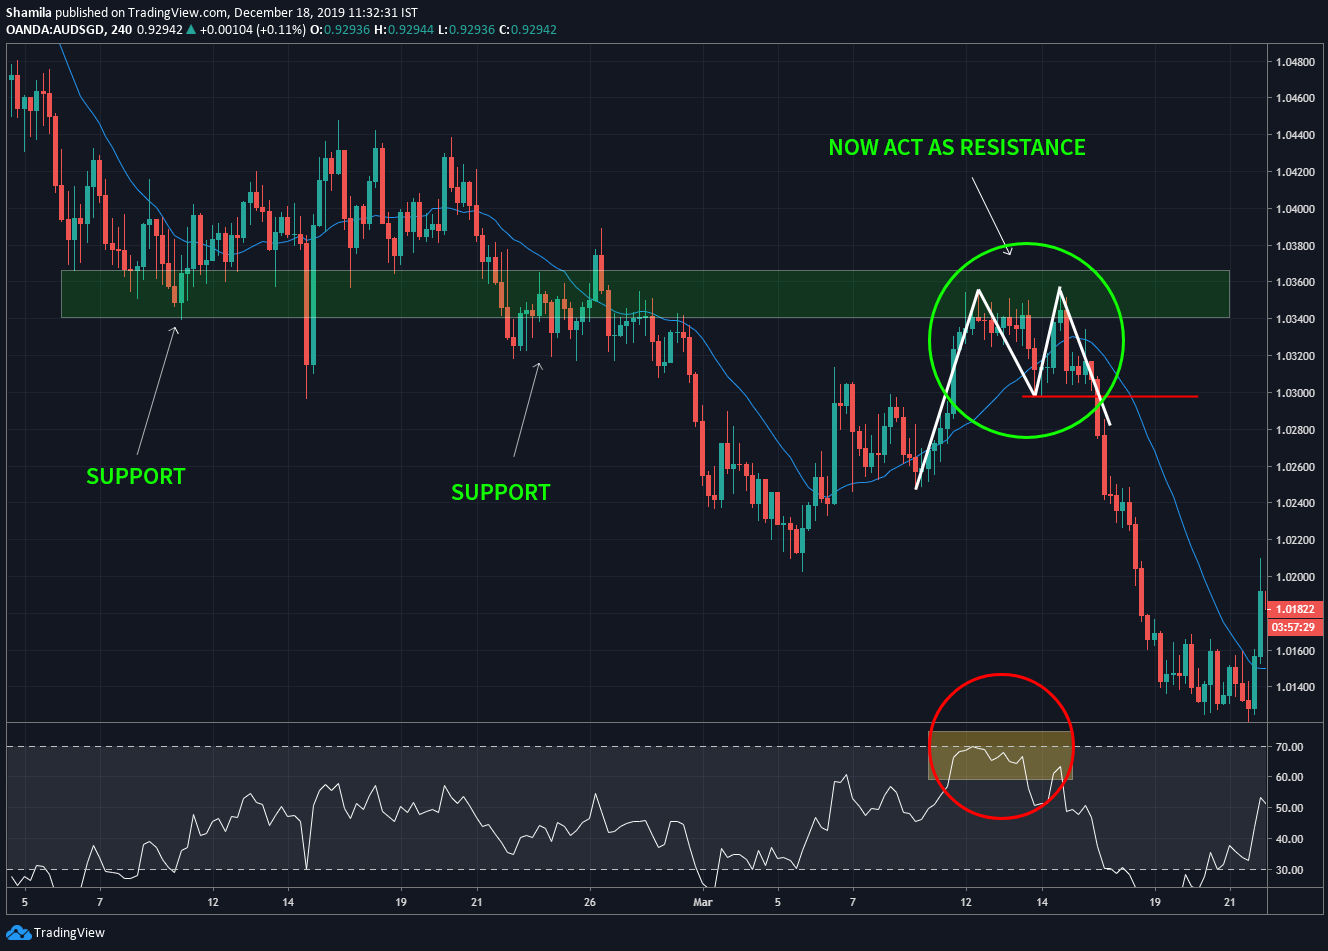
First, you can see the green zone, which acts as both support and resistance.
Then you spot M pattern marked in Green circle and at the same price is at the level of resistance. Also, RSI is in the overbought condition, which is an additional confirmation for our trade idea.
Now, can you spot the red horizontal line at the bottom of the M pattern? This is called the trigger line. we execute our trade if price broke this trigger line. In this case, we will execute a sell order if the price breaks the trigger line to the downside.
So, What happened after the break of the trigger line, the price fell like a waterfall right.
So keep in mind that this is my very own strategy to trade support and resistance levels. Also, you can use it to earn consistent profit from the forex market.
But hold on,
Don’t take my words and trade this strategy right away. Do your own backtest and apply a sound money management technique to see whether it work or not.
Back to the topic,
There are a number of ways to trade support and resistance in the forex market. You can use head and shoulders, price actions and breakouts as entry techniques.
But what matters most?
Whether the strategy is matched with your personality of not.
Maybe you are a busy man mean you have less time to focus on the market, then you should focus on higher time frames rather than lower time frames.
These all are up to you.
But please don’t waste your time on useless indicators and useless trading courses that cost you +$500.
Now it is your turn,
Final Word
Go through all 24 forex pairs and try to place support and resistance until it becomes second nature to you. Also, make sure to apply different chart patterns to see which one is suited for you.
Conclusion
Support and Resistance levels reflect the behaviours of forex market players.
Higher time frames support and resistance levels are more reliable than lower time frame levels.
you can get a much profitable trade entry by combining these levels with other technical clues.
All good strategy out the use at least some form of support and resistance as a technical clue.


