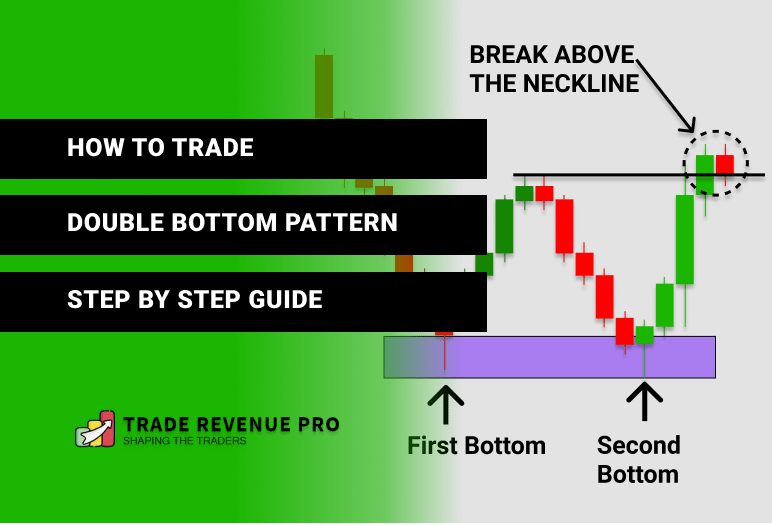
This is the most complete and step by step guide on how to trade the double bottom pattern in forex.
So if you want to:
- Learn how to identify higher probability double bottom patterns
- Learn how to trade the double bottom patterns profitably
- Get access to proven double bottom reversal trading strategy
Then you will love the detailed trading strategies and techniques we are going to talk in this article.
In fact, at the end of this article, you’ll learn exactly how to place trades like these,
Let’s dive right in.
What is Double Bottom Pattern?
Just like the head and shoulders pattern, Double bottom pattern is also a reversal chart pattern that used widely in technical analysis. This chart pattern describes the reversal of on-going bearish trends.
The opposite of this pattern is the double top pattern which indicates the reversal of bullish trends.
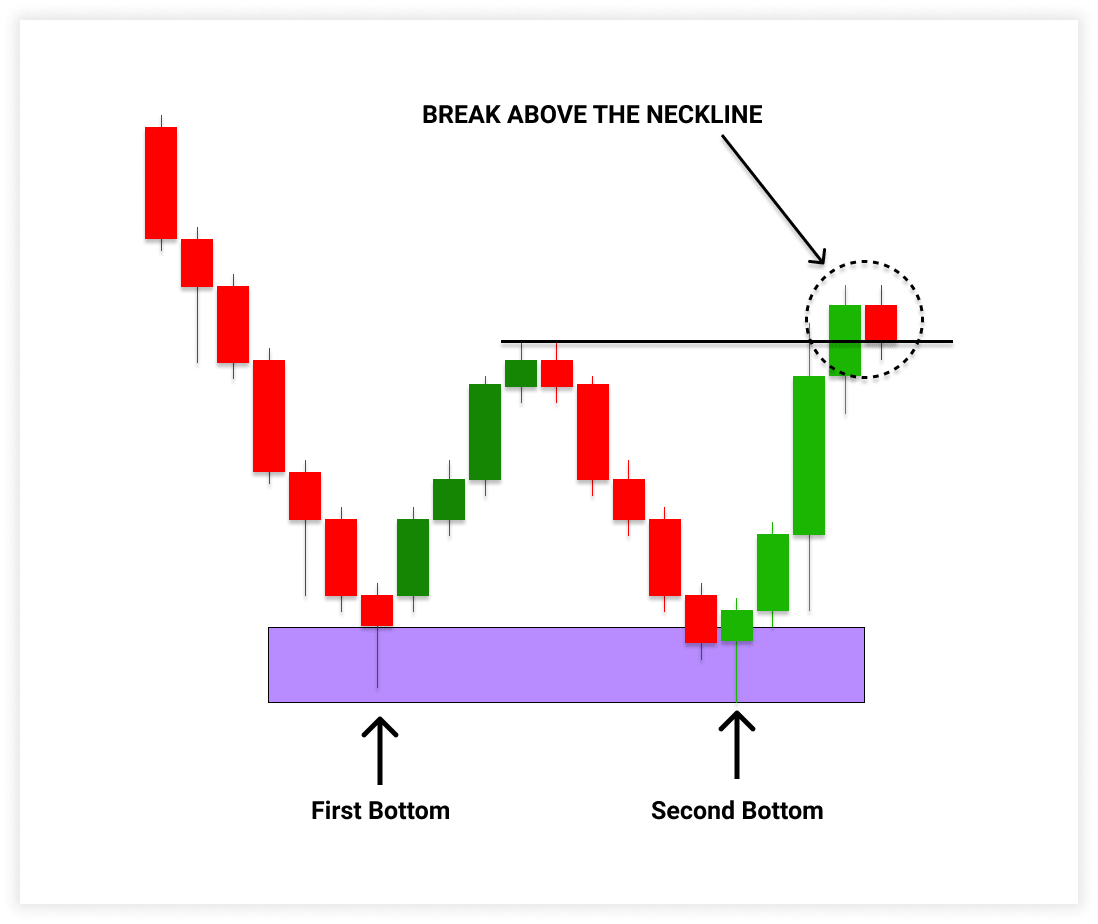
The double bottom pattern looks like the letter “W” and this pattern is also called a “W pattern.” Have a look at the double bottom pattern below.
Since the double bottom pattern has reversal characteristic, it always starts with a bearish trend, then at some point price struggle move further down (Those points can be – Support/Resistance, Round Number or Structure level) and start to retrace up and this formed the first bottom.
The price action then again tried to move down (Or trend try to continue) but when the price meets the first bottom, It again struggles to move down and as a result of that price ended up reversing into the other direction.
No need to explain this much. Have a look at the sketch above, It’ll explain it all.
Although the identification of the double bottom is easy, it doesn’t mean you cannot simply jump into trades whenever you see two bottoms form.
Rather, you need to confirm the validity of the double pattern before deciding on placing any trades.
Now, the question is how to confirm double bottom pattern? Easy.
By waiting for a break above the neckline of the double bottom pattern. Let me explain…
Have a look at the sketch below,
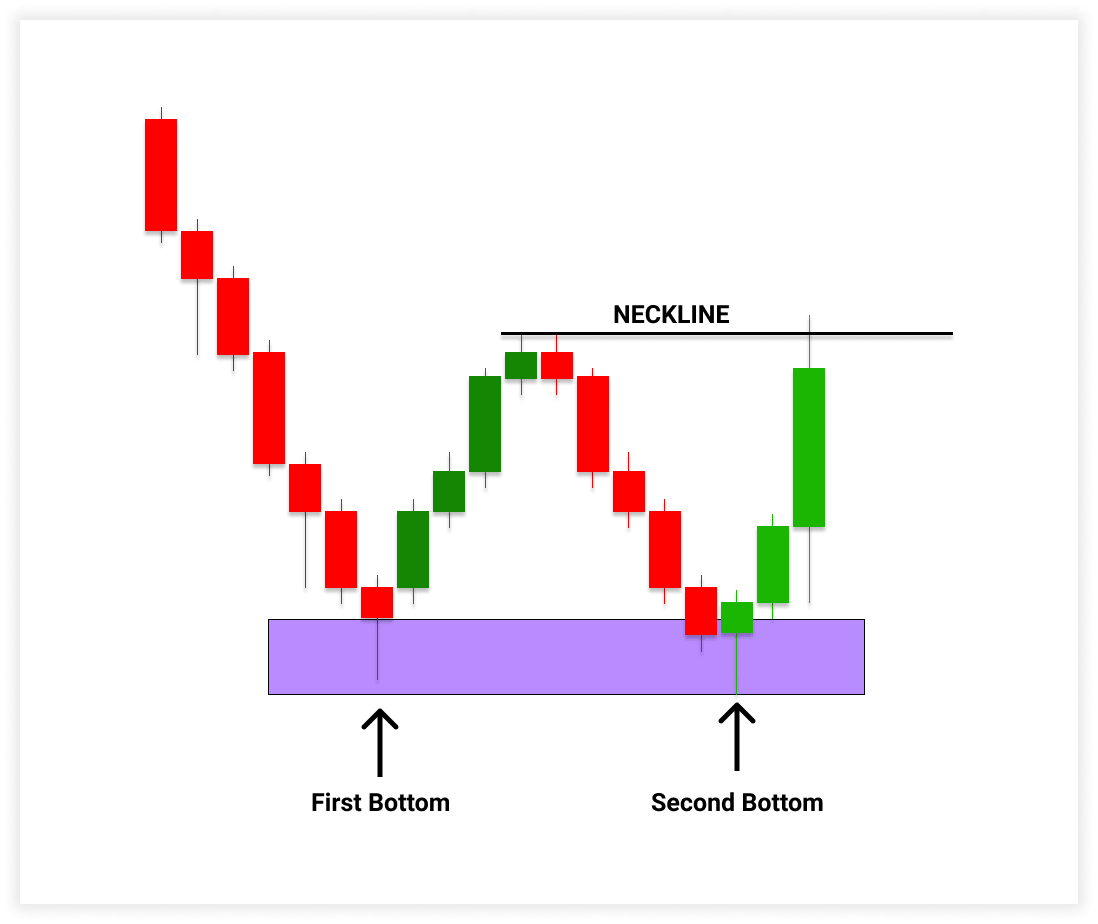
At a glance, you can see that it is a double bottom, but the pattern is not confirmed yet. For that price need to closed above the neckline.
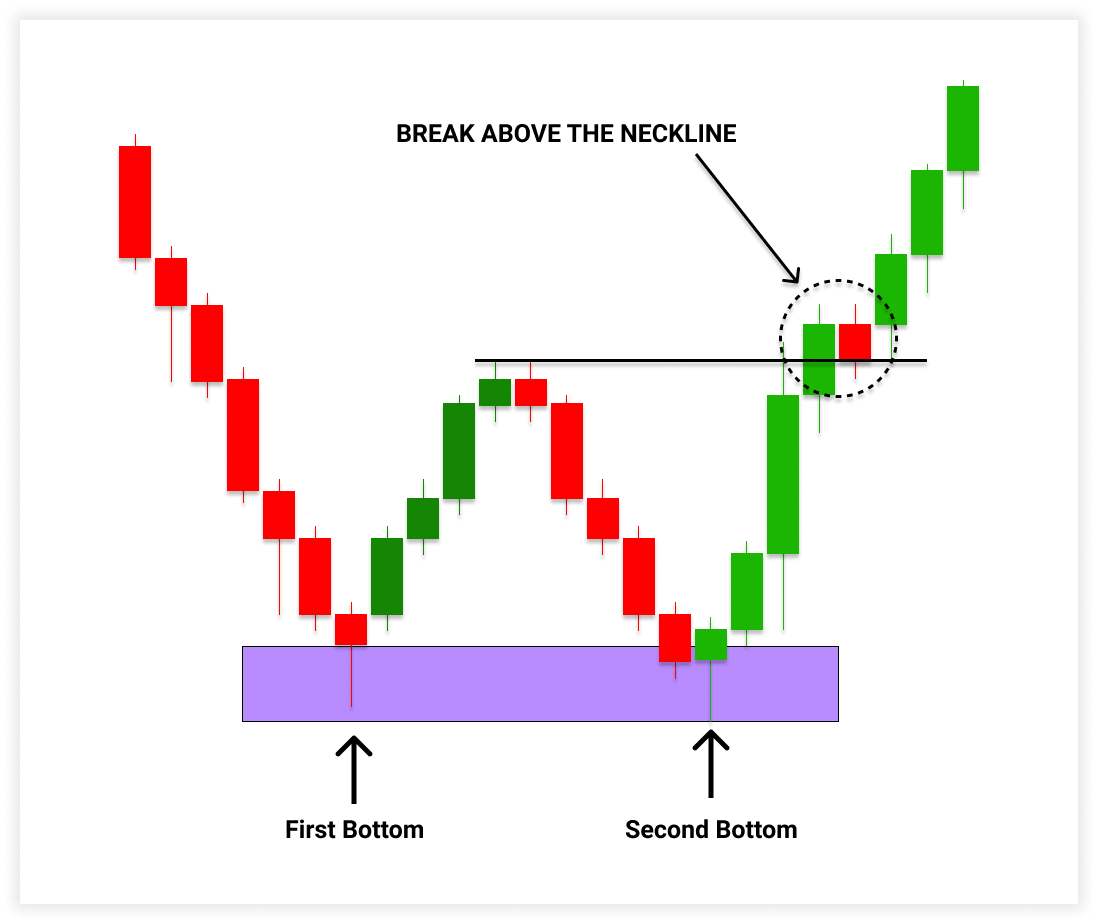
Next. have a look at the sketch below.
In the sketch above we can clearly see that price broke and closed above the neckline. This confirms the validity of the double bottom pattern.
Now we have a confirmed double bottom pattern in place, right?
But the question is, Just because we had a confirmed double bottom, Is that mean can we just jump into trades right away?
No, You cannot do that way. This will end up blowing your trading account for surely.
Keep in mind that, Just because you had a confirmed double bottom, that doesn’t mean you can trade them all.
Then How do we identify profit-driven double bottom patterns?
It is also easy as you identified the double bottom pattern. Let’s discuss 3 key areas to identify highly profitable double bottom patterns.
How to Identify High Probability Double Bottom Patterns?
If you go through historical data of any currency pair you will come across with lots of double bottom patterns. Some of them are profitable and some of them are losers.
Truth is, you’ll end up finding lots of losing double bottom patterns rather than profitable ones. So, the question is, how do we pinpoint only profitable patterns?
Easy, By combining double bottom pattern with other trading confluences…
Double Bottom Pattern at Key Level
Key levels can be Support level, Round numbers or Market Structures. Price has a tendency to reverse around these levels.
Hence, if we can combine Double bottom pattern with these key levels, we can find a higher probability trade setup.
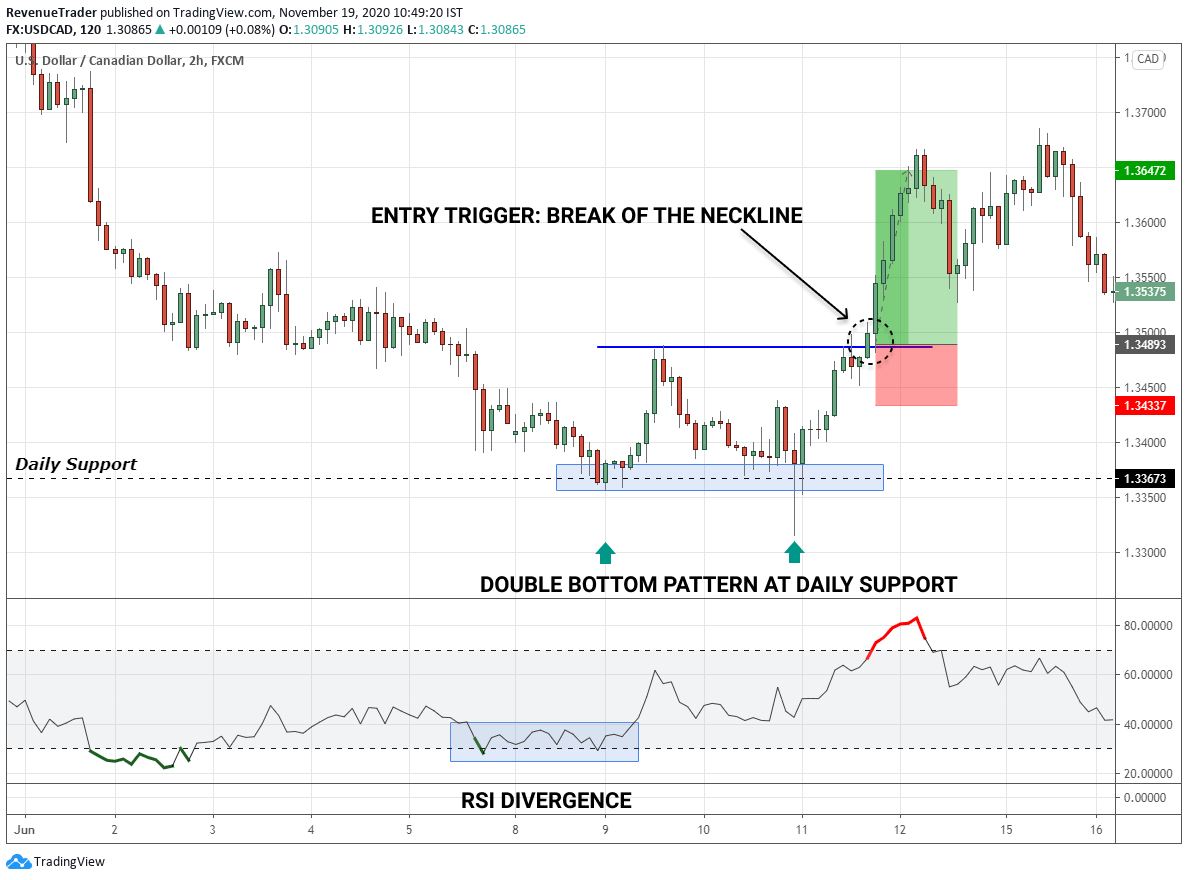
Let’s take an example. Have a look at the chart below,
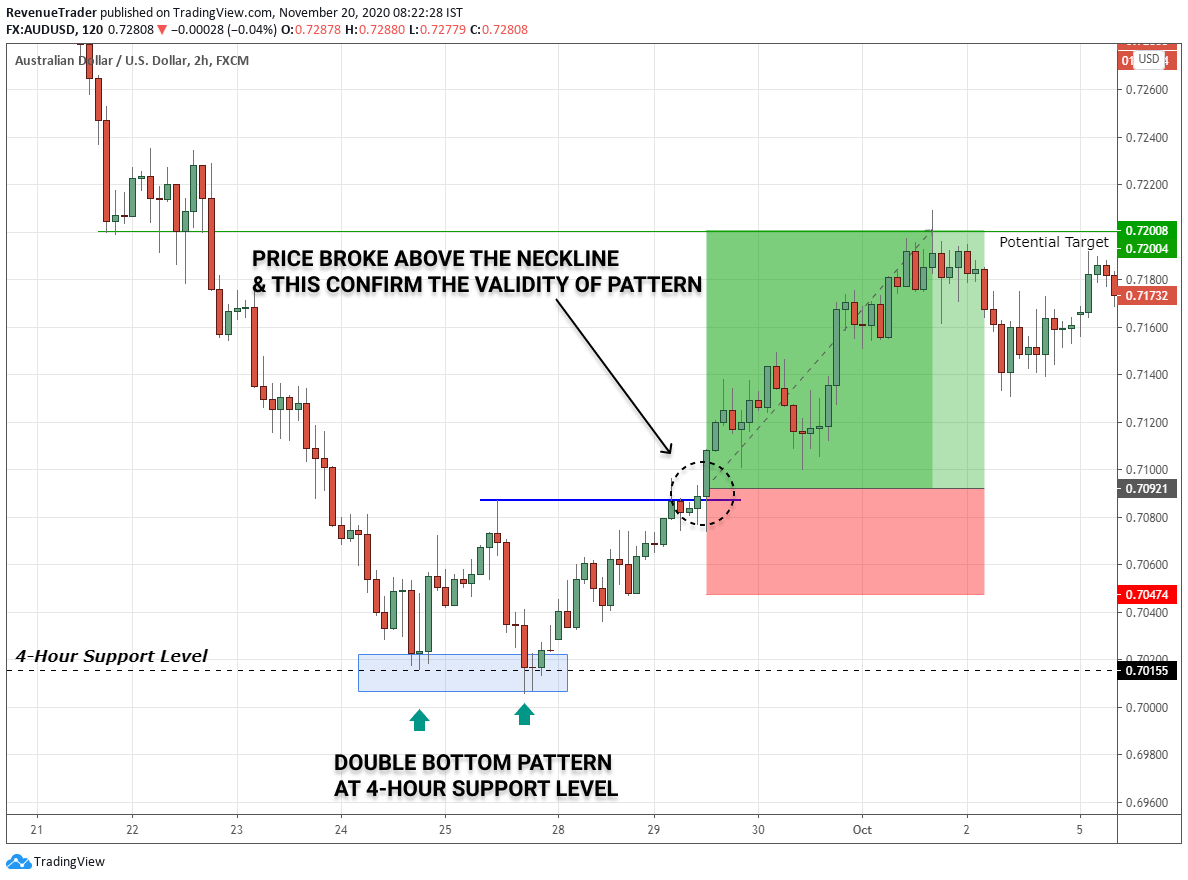
Notice how the double bottom pattern aligns with the support level comes from the 4-hour chart. It is perfectly aligned, right? Just like this, by combining double bottom pattern with support levels can help us to improve the probability of this pattern.
Remember that trade location is an important trading factor. So always try your best to avoid trade this pattern at NO MAN’S LANDS.
Next…
Double Bottom Pattern with RSI Divergence
In a downtrend, an RSI divergence is when price makes lower lows and the RSI indicator makes higher high. Basically when RSI divergence occurs It means the RSI indicator and the price actions are out of the sync.
Learn How to Trade RSI Divergence in Forex – 4 Practical Entry Techniques
In a downtrend, the occurrence of the RSI divergence indicates the lack of selling pressure. So think about for a moment, what could be the result if we combine RSI divergence with the double bottom pattern?
A highly profitable reversal trading opportunity, right?
Okay, Let’s take an example:
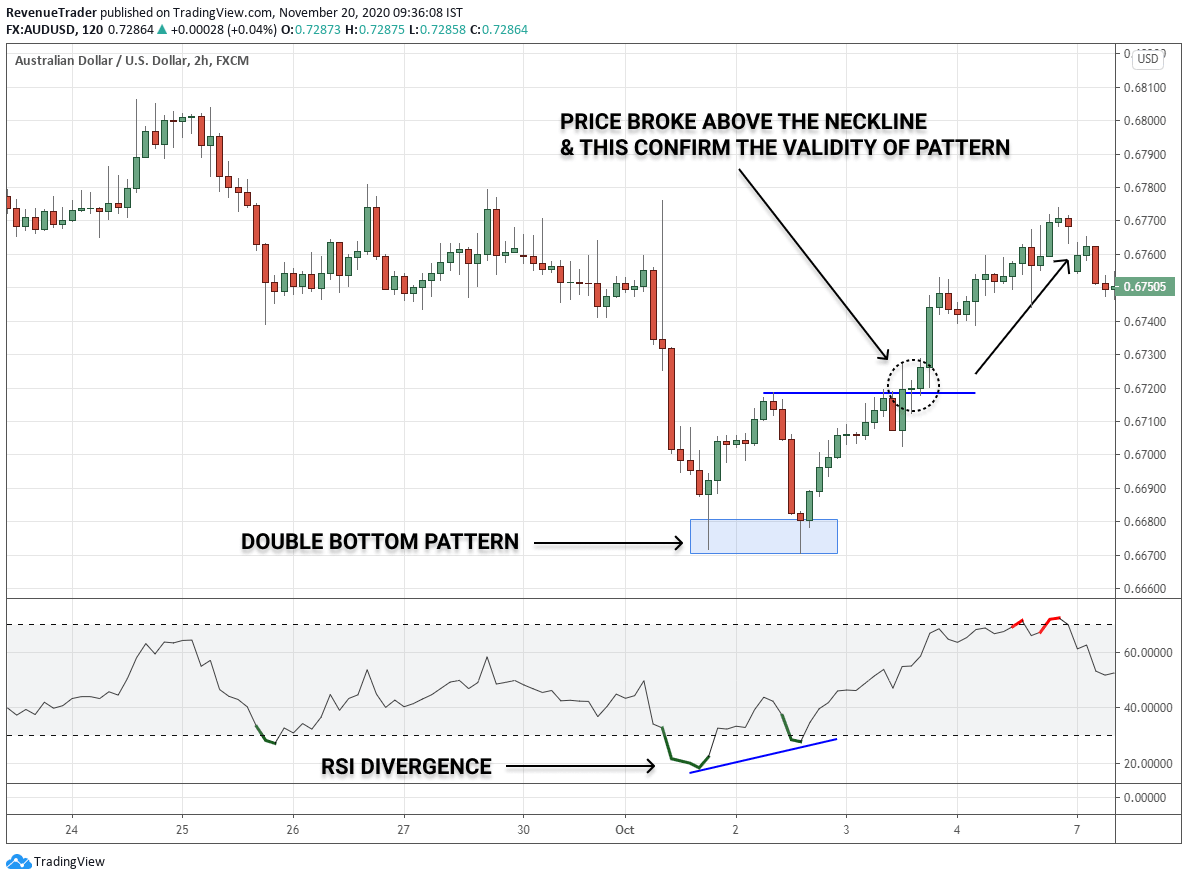
According to the above chart, you can see that Double bottom pattern and RSI Divergence occurred at the same time. This increase the probability of the double bottom pattern. Next, have a look at what happened after the breakout of the neckline. Profit, right?
Next, let’s have a look at the last one which is my favourite way to identify higher probability double bottom pattern.
Keep in mind that this involves multi-timeframe analysis.
Rolf, owner of Tradeciety has a must read article about Multi Time Frame Analysis.
Combine Double Bottom With 4-Hour RSI Oversold and Overbought signals
Did you know that 4-Hour RSI oversold and overbought signals are profit goldmines?
In fact, my whole trading strategy is based on this trading signal.
Let me explain, Have a look at the chart below,
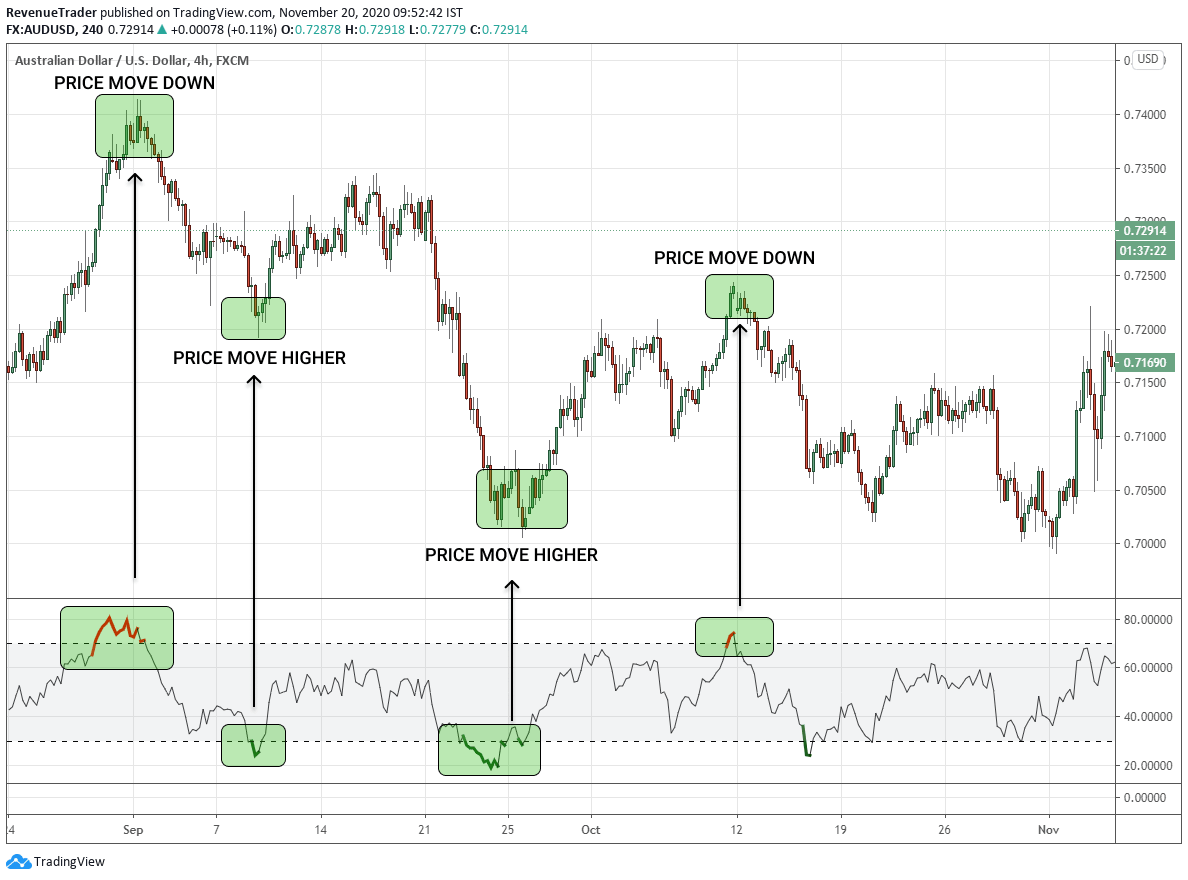
According to the above chart, you can see that, every time RSI generate an overbought signal, the price ended up moving down and whenever RSI generate an oversold signal, the price ended up moving upward. That’s the power of RSI signals in 4-Hour chart.
But you cannot execute trades every time RSI generate overbought or oversold signals. This will ruin your trading account.
Then how do we use these powerful signals? Simple. By combining multi-timeframe analysis with the double bottom pattern.
Note – You can combine these signals with any other reversal pattern as well.
Okay, let’s do this step by step:
First, you have to need to identify an RSI oversold signal just like the chart below.
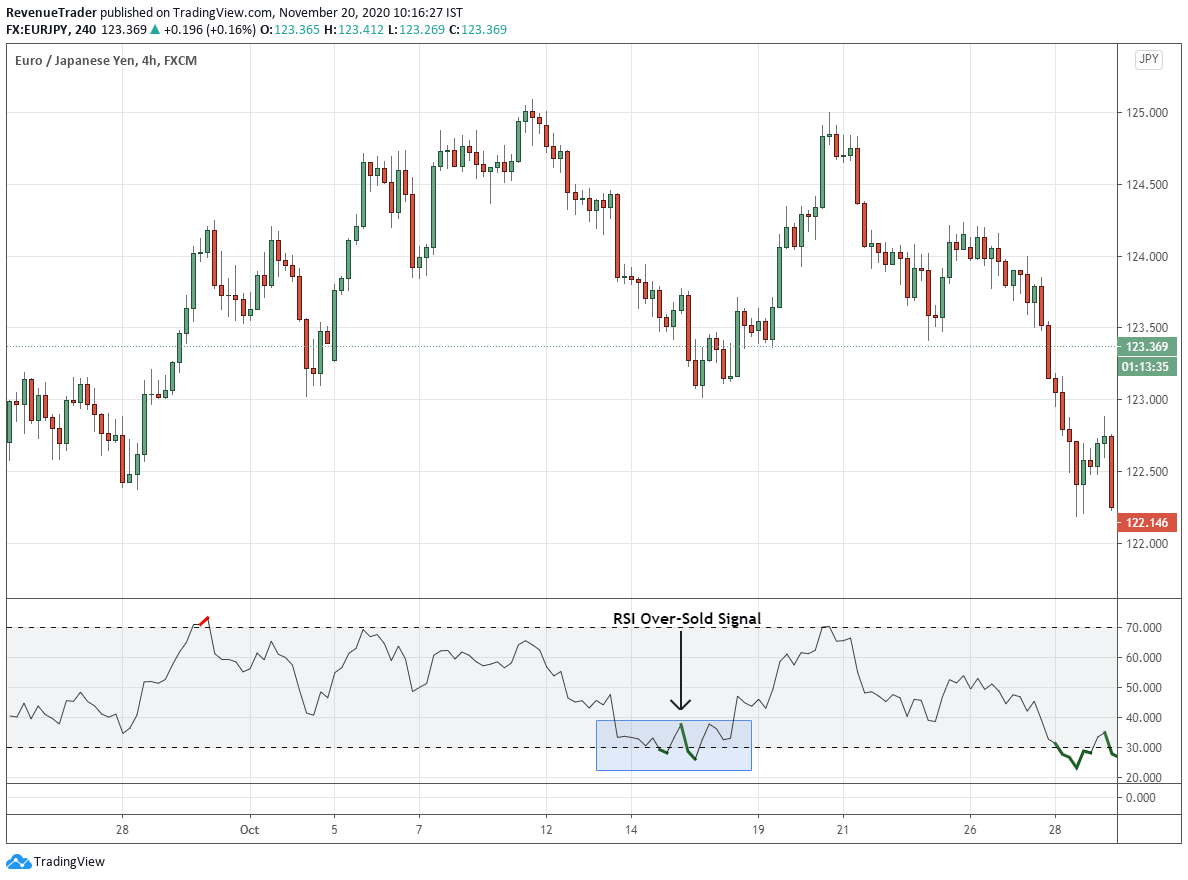
According to the above chart span, It is hard to identify any double bottom pattern, right? So we need to switch down to the 1-Hour chart to get more price action context.
On the 1-Hour chart, we can clearly spot a double bottom pattern. Have a look at the chart below.
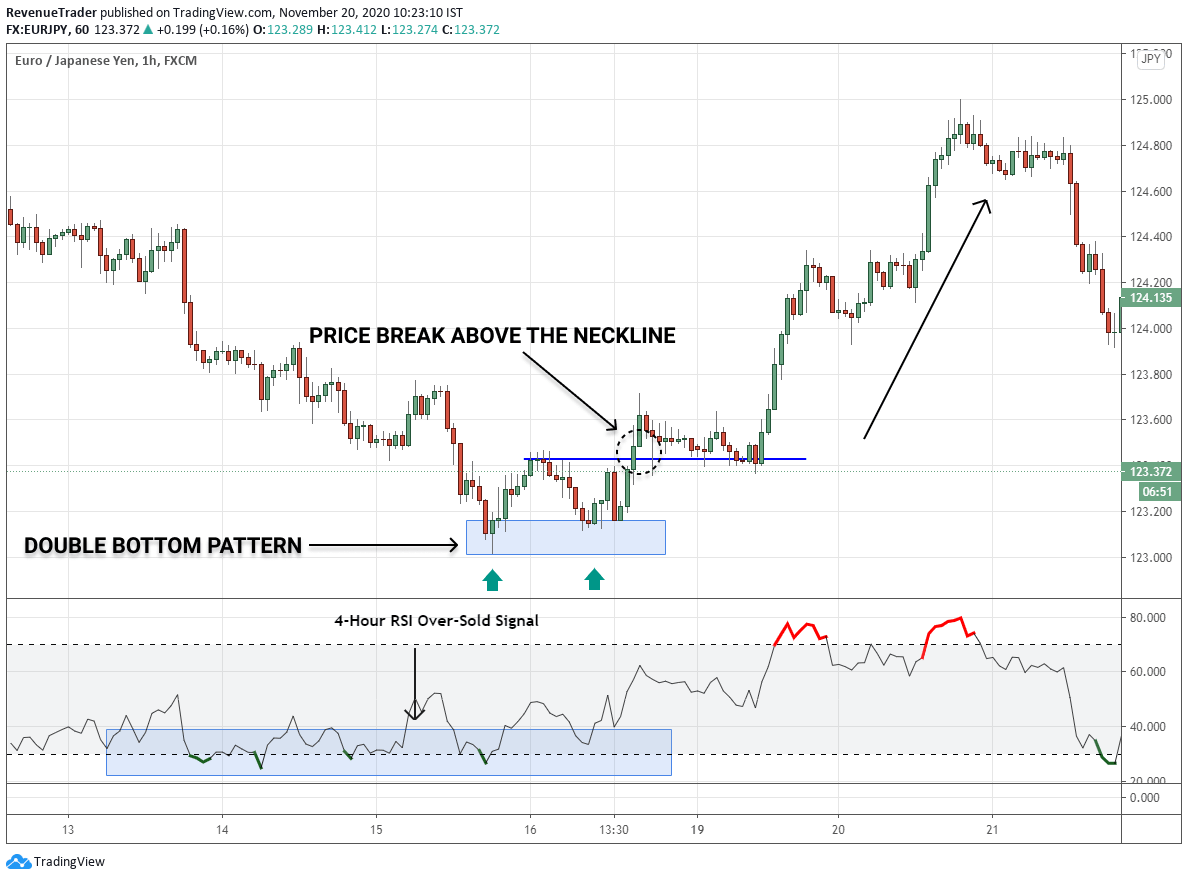
Note: this is the same area we got RSI oversold signal on 4-Hour.
Just like the previous example, price break above the neckline and move higher quickly.
Yeah, this is somewhat advanced but the results are enjoyable.
That’s it: These are the 3 Higher Probability Ways to Identify Profit-Driven Double Bottom Patterns.
Now you are familiar with – What is a double bottom?, how to identify a double bottom and more importantly you can scan higher probability double bottom patterns as well.
Next, the question is:
How to Trade the Double Bottom Pattern? This is the main topic of this article, right?
Let’s dive right in.
How to Trade Double Bottom Pattern – A Reversal Trading Strategy
In Trade Revenue Pro, we focus only on the trend reversals. Our reversal trading strategy helps us to catch the trend from the beginning that allows us to have more room for greater risk to reward ratios.
The same objective can be achieved by using the double bottom pattern as well. In fact, the way we trade bottom pattern always allow us to get more than 1:2 Risk to Reward Ratio.
Let’s see how:
Note – We use 1-Hour and 4-Hour for this trading strategy. The 4-Hour timeframe is to identify RSI signals (RSI Oversold in this case) and the 1-Hour timeframe work as trading timeframe where we identify the double bottom and place the trades.
The below trading confluences Must be full-filled in order to go for a reversal trade.
- An Established Bearish Trend
- RSI Over-Sold Signal on the 4-Hour Chart
The two trading confluences above always help you to identify the right market condition to trade on.
With that in mind let’s move to the first step:
#Step 1 – Identify a Valid Double Bottom Pattern.
Have a look at the AUDUSD 1-Hour chart below,
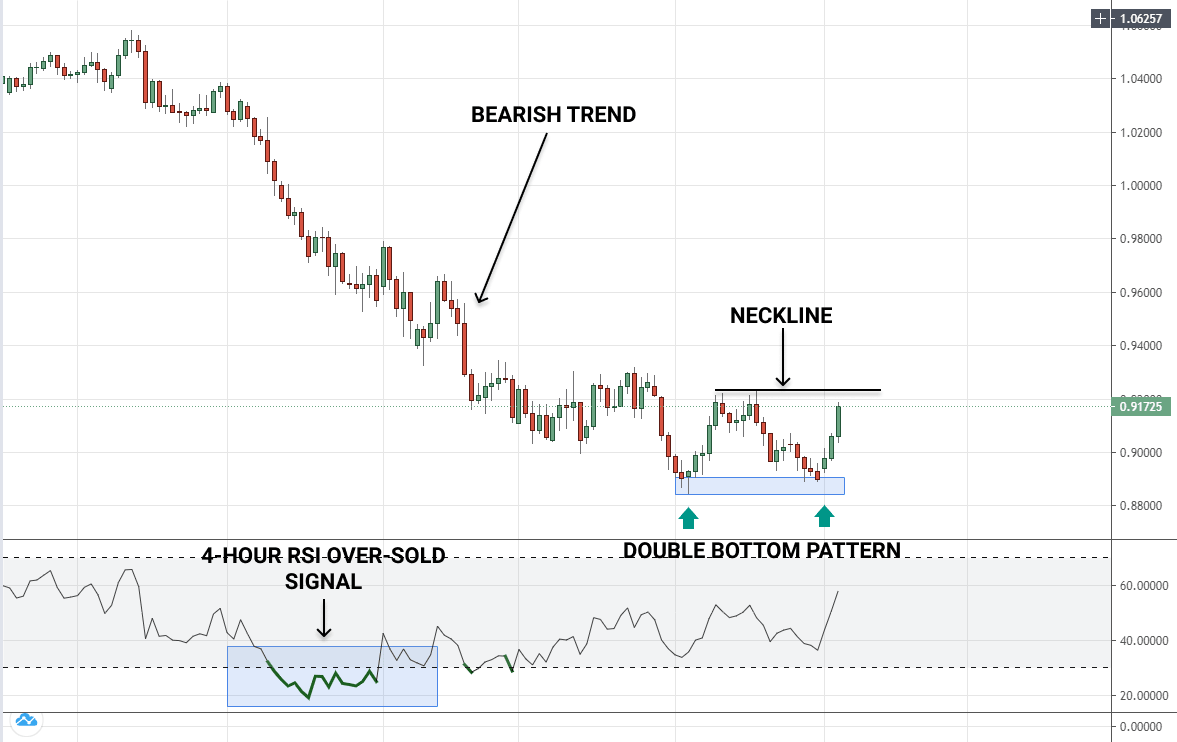
First, AUDUSD was in a strong bearish trend and the RSI indicator showed Over-Sold signal on the 4-Hour timeframe that fulfils both trading confluence we need, next…
Have a look at the double bottom pattern, which is not confirmed yet, for that price need to close above the neckline.
Let’s move forward and see what happened next.
#Step 2 – Wait for a Breakout
Now we have a perfect trading setup align with the other technical confluences (Double bottom + RSI Oversold). Now we have to wait for a break above the neckline because that is what confirms the validity of the double bottom pattern.
Have a look at the chart below, At a glance, you can see that price broke above the neckline which confirms the validity of the pattern.
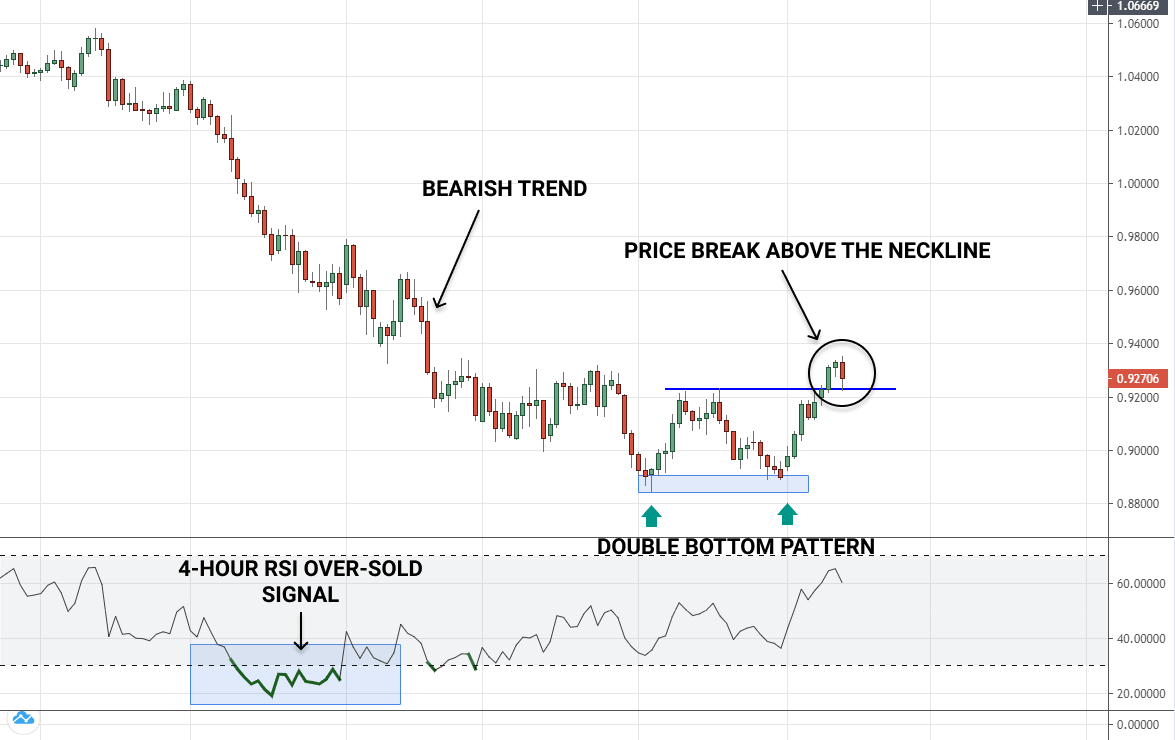
Now we have a valid double bottom pattern in place.
Next, we have to place Stop-loss and Take-profit, right?
#Step 3 – Placing Stop Loss
When placing the stop loss, you have to consider two factors:
- Stop loss must be in a safe place. (Especially to avoid stop hunts)
- You must place the stop loss where you can get a higher Risk to Reward Ratio.
How can we achieve this? This is where 20 period Simple Moving Average comes into place.
What is the purpose of using 20-Period SMA? 20-Period SMA helps us to define minor uptrend and downtrends.
Related : What is Moving Average in Forex & How to Use It (4 Practical Ways)
So in this case, after breaking above the neck, Price need to remain above the moving average if it is willing to go higher. Logical enough, right?
Hence placing our stop few pips below the 20-Period SMA is a great place when considering the above two factors.
Have look at the chart below,
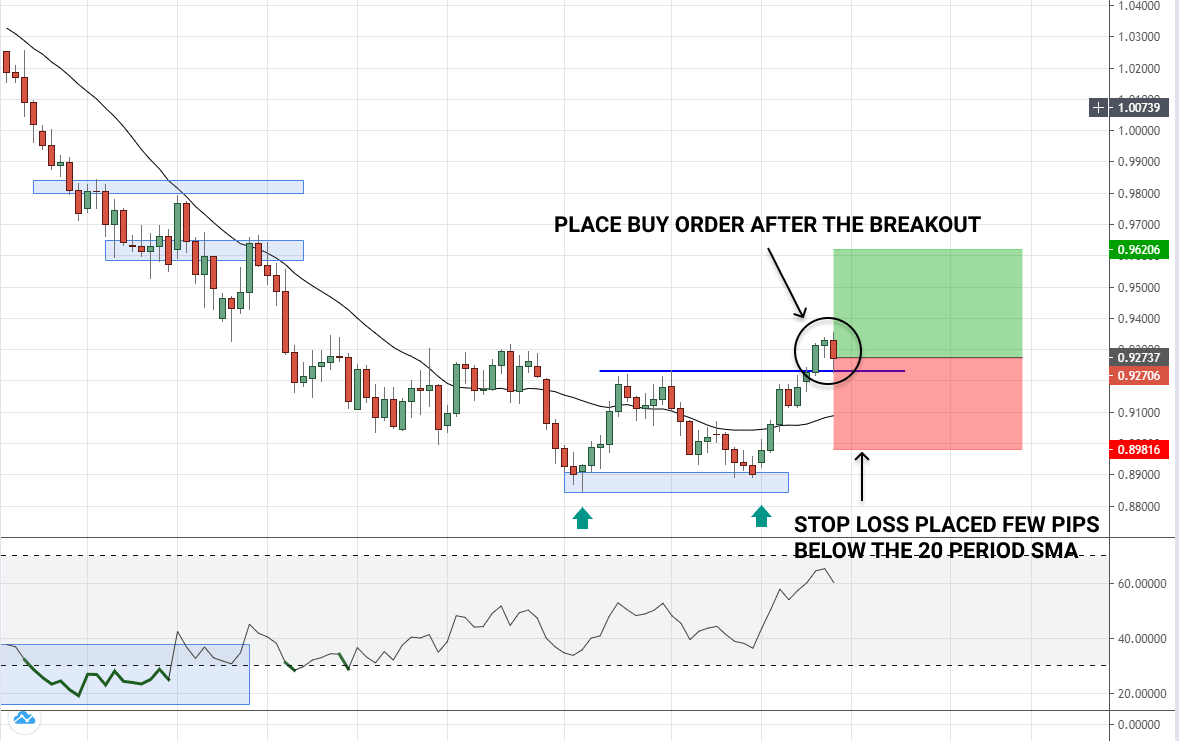
Okay, now, a buy trade and stop loss is also placed.
Next…
#Step 4 – Placing Take Profit
Here we need to place our take profit where we can get at least 1:2 Risk: Reward ratio. This is the main objective when placing profit target.
With that in mind, where we place the take profit?
At a market structure level. Have a look at the chart below.
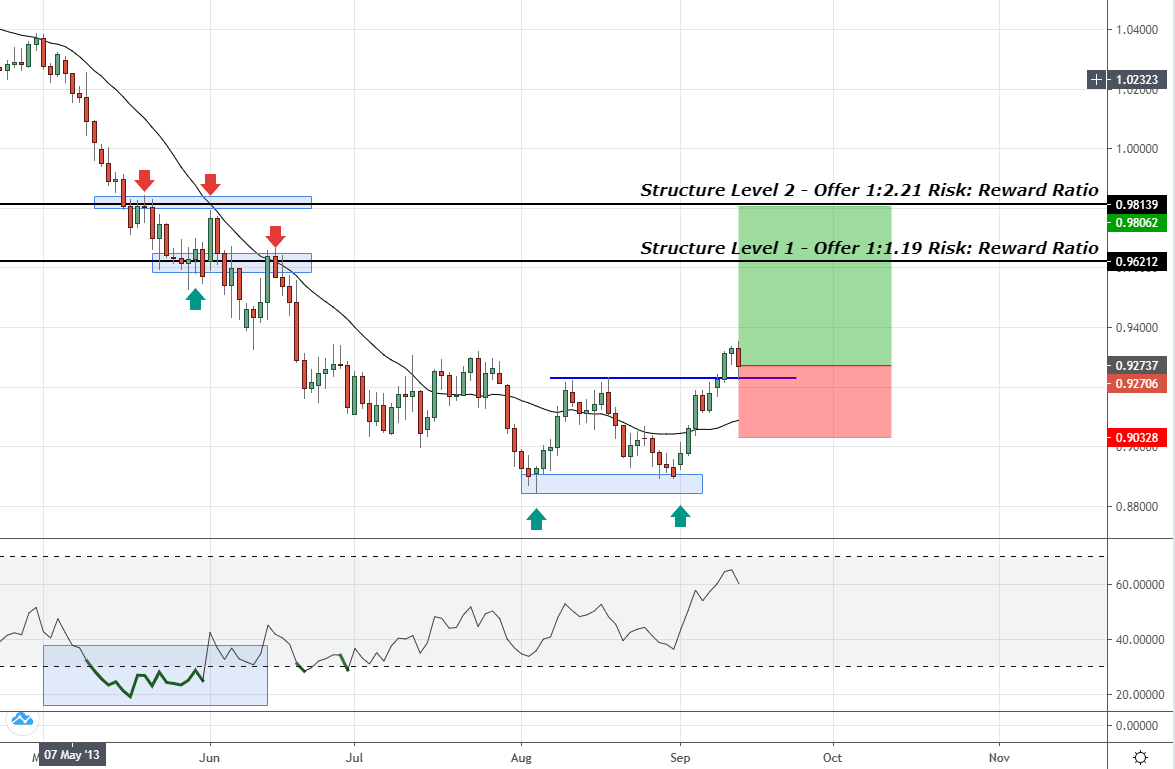
According to the above chart, you can see there are two structure levels along the way.
Structure level 1 which offer 1:1.19 Risk to Reward Ratio.
Structure level 2 which offer 1:2.21 Risk to Reward Ratio.
When considering the objective, we have to place our take profit at the structure level 2 where we can get more than 1:2 risk to reward ratio.
Now you have a trade in place.
Here are a few tips to manage your trade.
Tips to Manage Trade When Trading Double Bottom Pattern
- You can move the stop loss to breakeven after price hit the 1R profit level.
- If you don’t see momentum to the upside you can cut your losses immediately.
- When the price met structure level before hitting the take profit, you can use those level to lock in some profits. In this case, we can use Structure Level 1 to lock in some profits.
- Be flexible about profit target. Which mean if you see a strong moment to the upside, aim for 2.5R or 3R profit targets.
Now before we wrap this article, Let’s take a look at some of few examples to polish what you have learned so far.
Trade Example 1 – Double Bottom Pattern on USDCAD
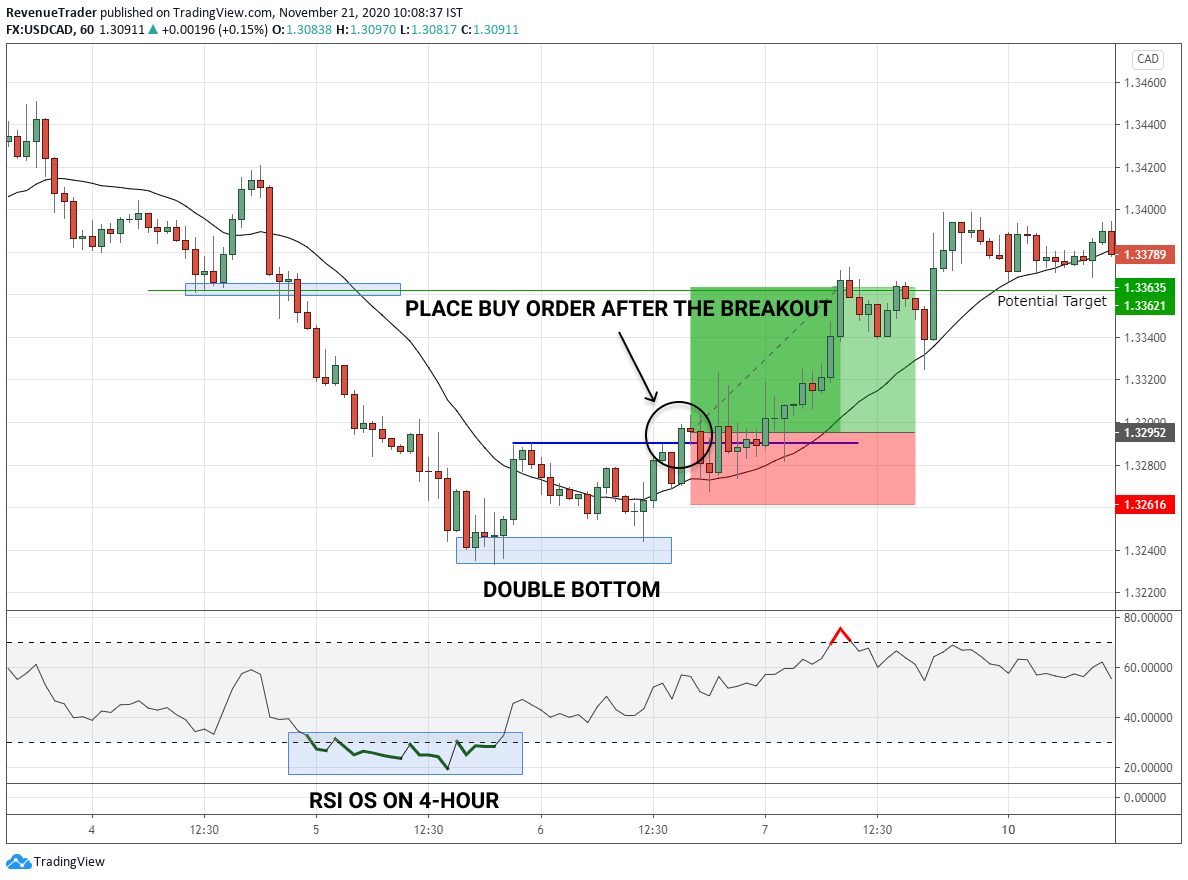
Market Analysis – Before double bottom pattern occurred, USDCAD was in a strong downtrend but eventually sellers struggle to move price further down and as a result of that, a double bottom pattern occurred which indicate the lack of selling pressure. At the same time, RSI OS (oversold) signal on the 4-Hour chart confirms that the bearish momentum is also fading.
Trade Entry – As soon as the price break above the neckline, we placed a long trade.
Stop Loss – Stop loss placed a few pips below the moving average which is a safe place.
Take Profit – We used recent market structure level to place the take profit which allows us to banked 2R.
Next, we had another trade on…
Trade Example 2 – A Rough Double Bottom Trade on GBPUSD
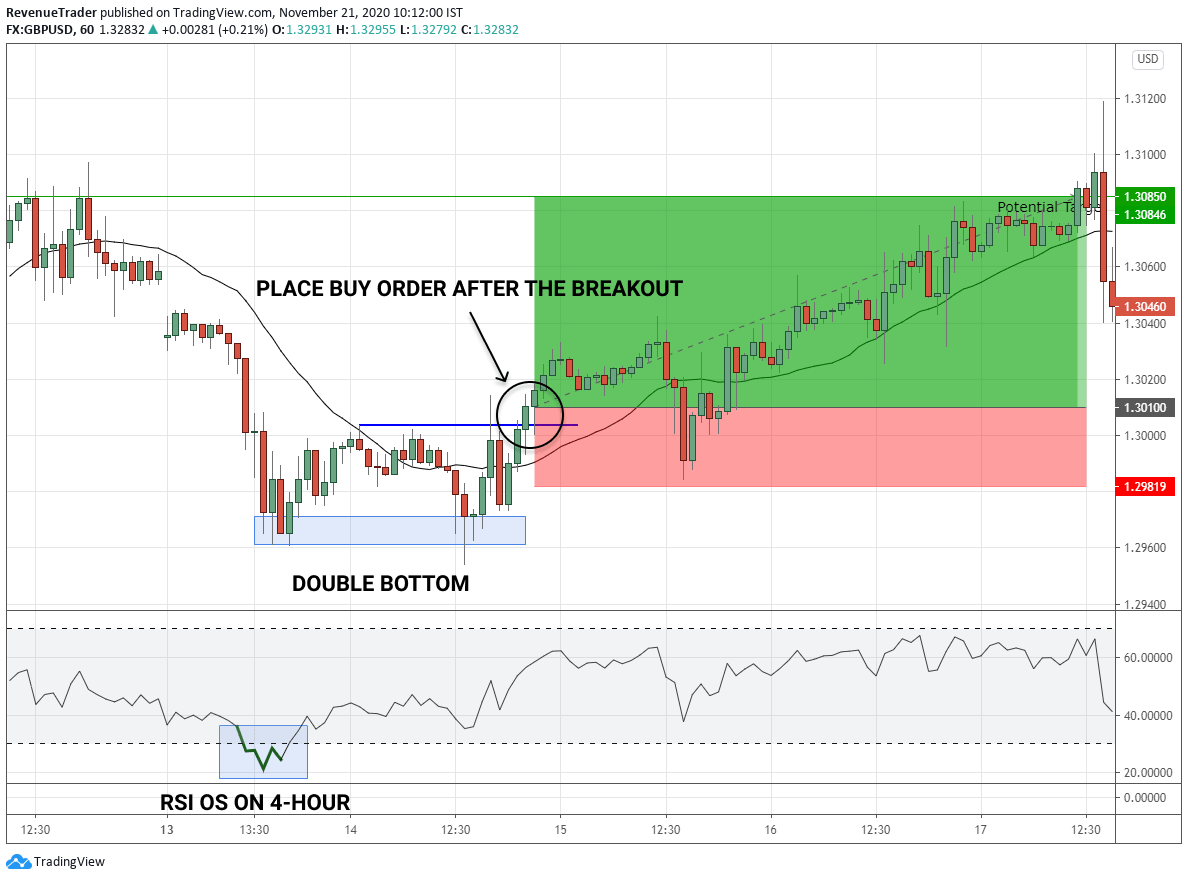
Market Analysis – Just like the previous trade, the occurrence of the double bottom indicate the lack of selling pressure. Also at the same time, the RSI indicator confirms the lack of momentum as well. With these confirmations in mind, we place a long trade.
Trade Entry – Simply we place a long trade as soon as price break above the neckline.
Stop Loss – Same as usual, we place the stop loss few pips below the moving average.
Take Profit – We used previous swing high for placing out take-profit which allow us to gain massive 2.65R in profit.
Finally, we had a trade on,
Trade Example 3 – A Quick Profit on EURJPY Trade
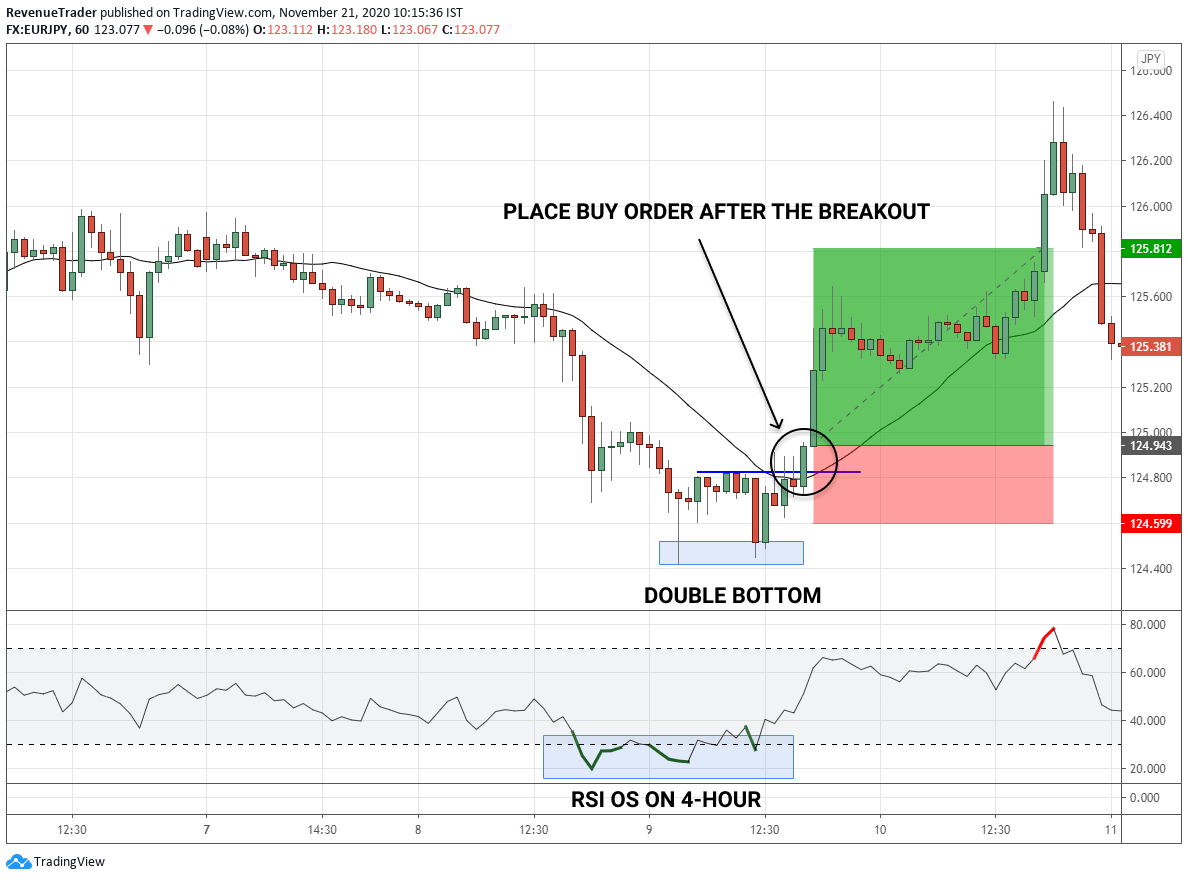
Market Analysis – Again the double bottom pattern and RSI divergence confirm the lack of bearish momentum.
Trade Entry – Place a buy order after the break above the neckline.
Stop Loss – In here we cannot place stop loss few pips below the moving average. It very tight and the price could easily hit our stop loss. Hence we place the stop loss few pips below the neckline.
Take Profit – Once again we used structure level for our take profit and this one is quick double bottom trade.
Finally, keep in mind that, Just like any other strategies out there this trading strategy is also suffering from losing trades, So be wise when managing your risk.
Last Piece of Trading Advice
Having well outlined and well-tested trading strategy does not make you a profitable forex trader. The truth is, yeah you need a trading strategy, but the trading strategy is not the defining factor to be a profitable trader.
Then what?
- A Well-Cultivated Mindset
- Unwavering Discipline and Patience
- Tight Risk and Money Management Plan
- A Proven Trading Strategy
- Continuous Learning
These all contribute to being a profitable forex trader. Hence shift your focus on learning – not only the trading strategy – other sides of trading stuff as well.
If you want to learn more about Forex trading strategies and techniques head over to our Trading Blog.
We put an article about chart analysis every weekend. Find those in the Trade Idea section.
Finally, I hope you learned something valuable in this ultimate guide on how to trade double bottom pattern. If so, help us grow by sharing this article.
What do you think about this trading strategy? Let me know in the comment section.


