Reversal Trading is where big money is made.
With higher Risk to Reward Ratio, achieving a smooth rising equity curve is highly possible with reversal trading.
In fact, Intraday Reversal Trading Strategy helps Trade Revenue Pro to earn 2R to 5R per month consistently which brings around 5% to 10% profit each month.
Need Proofs..?
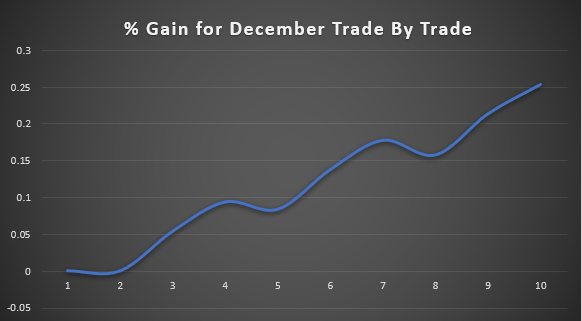
Here’s our December return so far (Below is a screenshot of Trade Outcome tab from our trading journal),
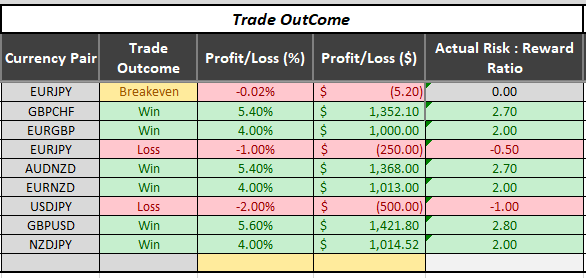
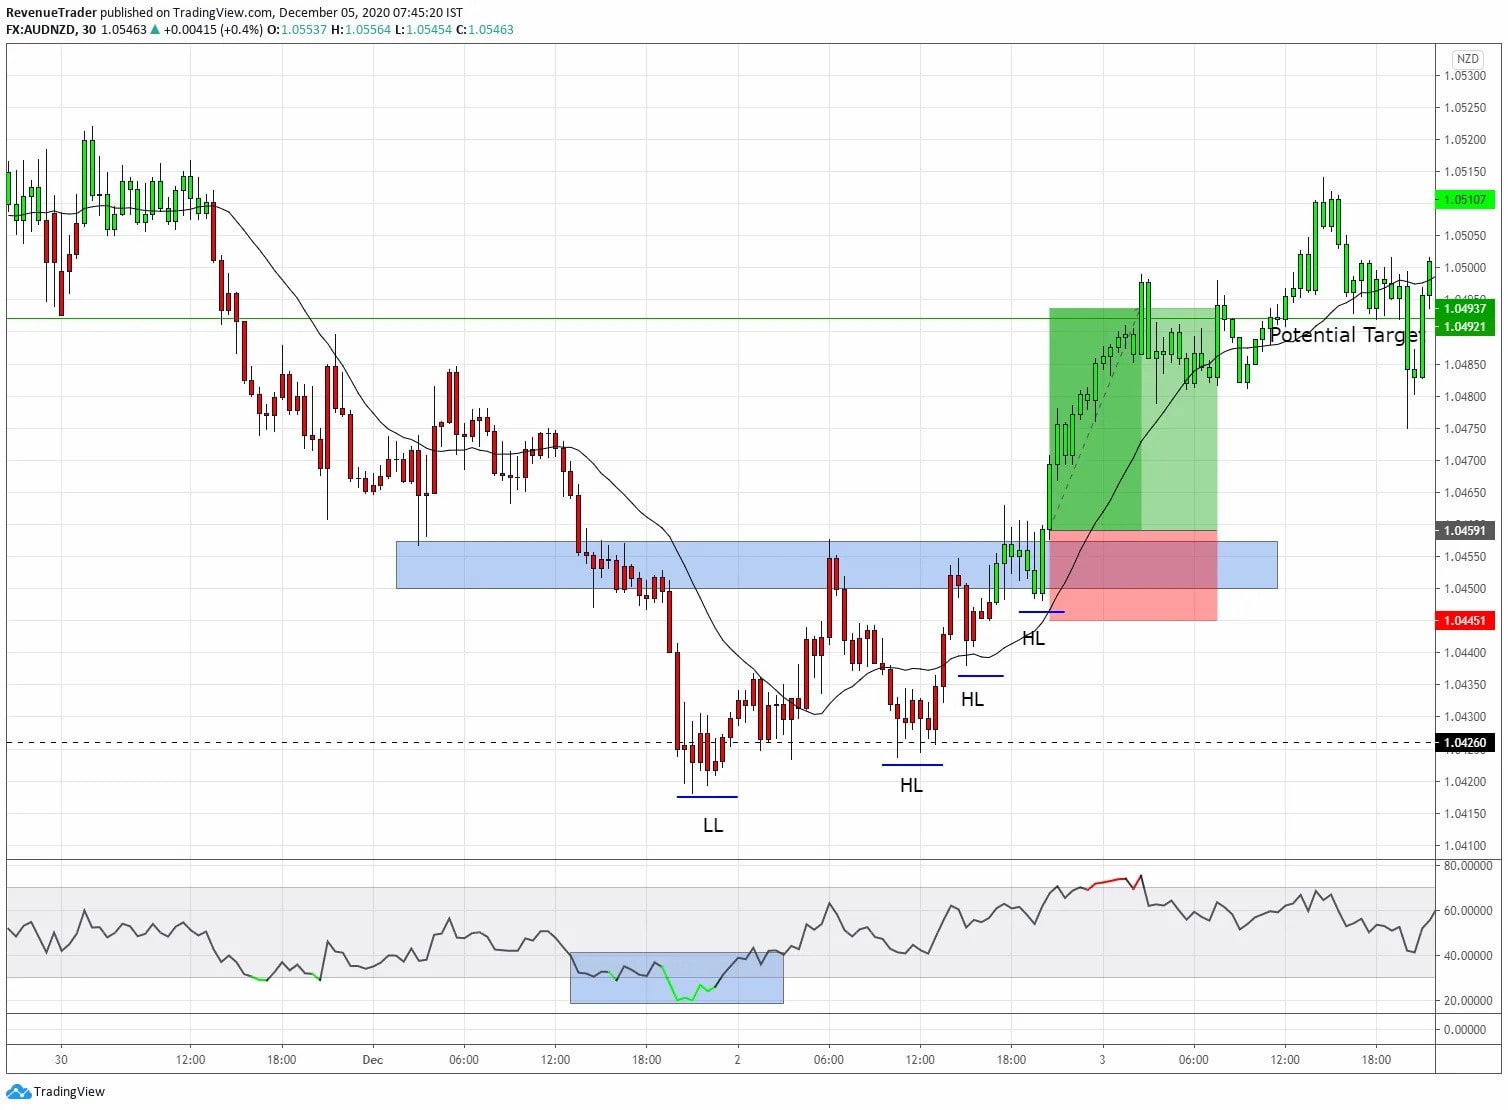
And here’s a trend reversal trade on AUDNZD we executed on the first week on December which helps us to earn 2.7R,
With that, here’s what you’ll be learning in this guide :
- How to Identify Trend Reversals – 4 Trading Tactics
- 5 Proven and Profit-Driven Reversal Patterns
- Mistakes You Should Avoid When Trading Reversals
Are you ready?
Let’s dive right in…
What is Reversal Trading?
Let’s start with the definition:
A Market Reversal Is A Turning Point Of An Ongoing Price Trend. On An Uptrend, A Reversal Would Be To The Downside. On A Downtrend, A Trend Reversal Would Be To The Upside.
Furthermore, trend reversals are not generally based on one or two candlesticks, It’s based on shifts in the overall price context.
In Forex trading, there are certain indicators which used to determine the trend strength and trend reversals. Some of those popular indicators are Moving Average, RSI and different reversal chart patterns.
Now, before you can identify trend reversal, you must understand the 4 cycles of the market.
But Why?
Because it warns you that market conditions will change – enabling you to plan trading decisions in advance.
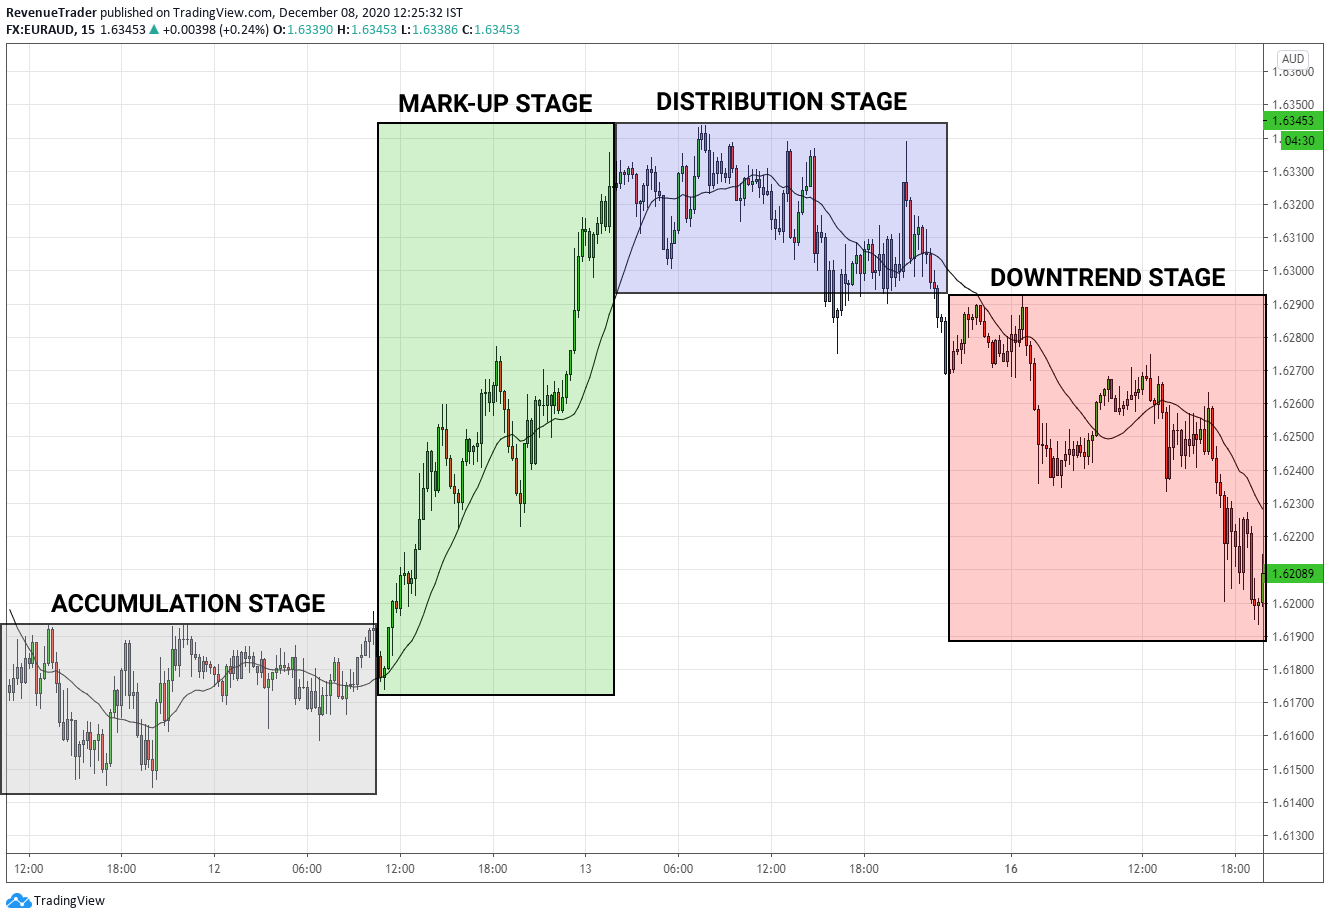
The market cycles go through 4 main stages:
- Accumulation Stage – This stage looks like a range market in a downtrend. This stage often telling traders about the lack of selling pressure in the ongoing downtrend.
- Mark-up Stage – This where the previous downtrend shifts in the opposite direction. Basically, the mark-up stage is an uptrend with price making higher highs and lows.
- Distribution Stage – This stage looks like a range market in an uptrend indicating buyers are losing their momentum over the market.
- Downtrend Stage – This stage is essentially a downtrend with price making lower lows and lower highs.
Have a look at the chart below, it represents the 4 Market Cycles,
Next, Let’s see how a typical reversal market looks like.
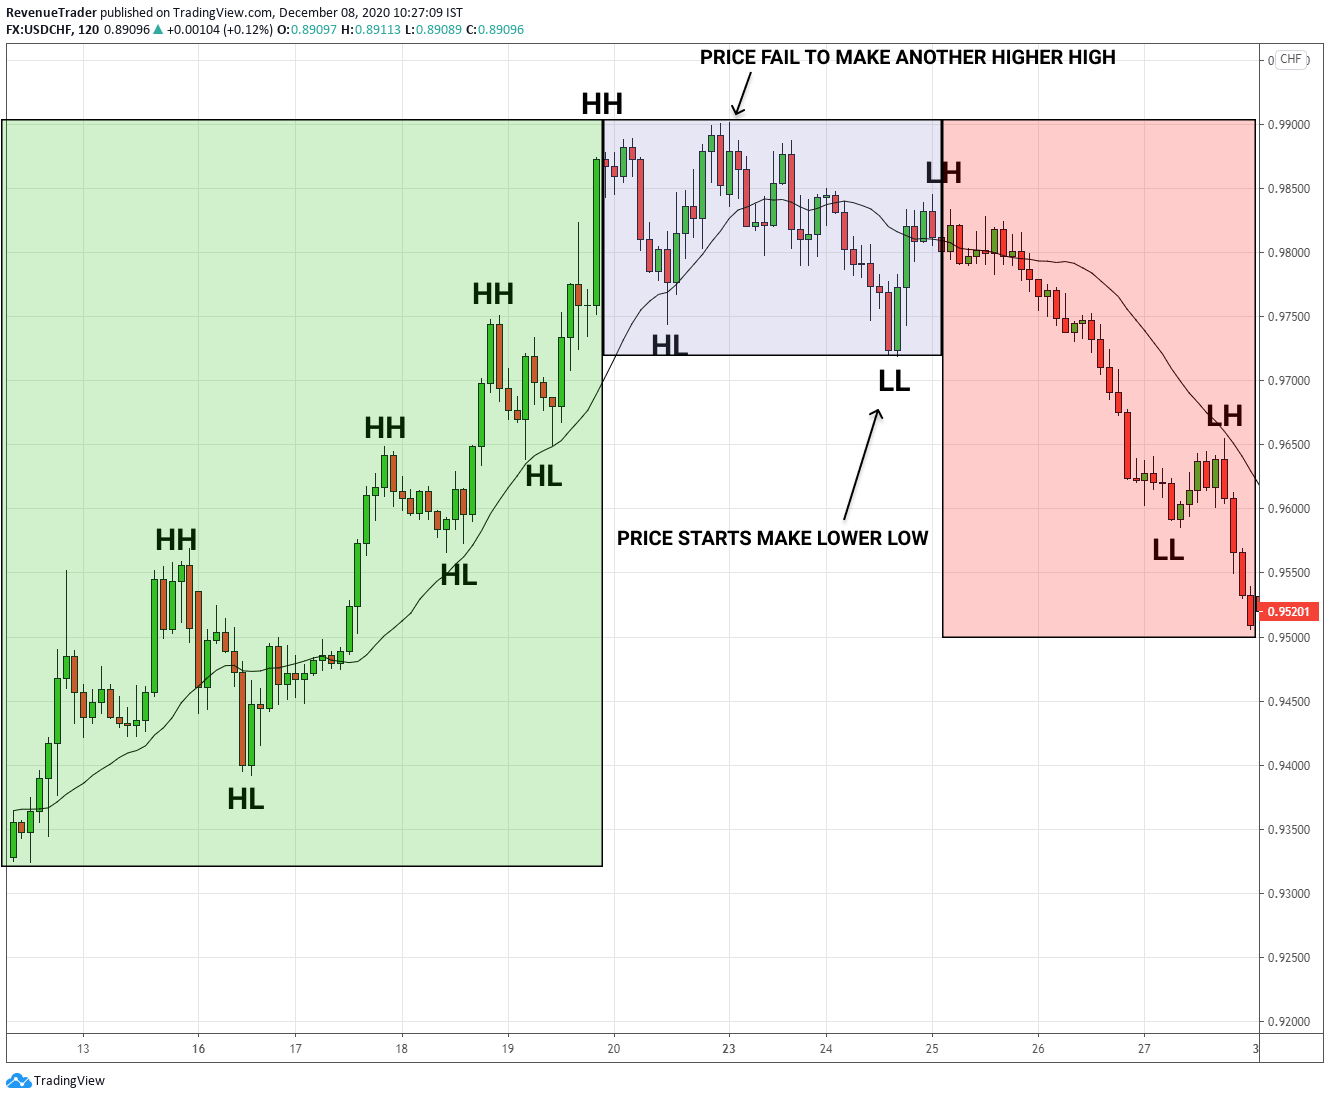
First, in the green box, we can see a strong uptrend with price making series of Higher Highs and Higher Lows.
But, observer the blue box carefully, from there onward buyers were struggle to make another higher high which indicate lack of buying pressure.
Instead, sellers were stepped in and formed a new LL (Lower Low) which is the starting point of a downtrend and in order flow perspective, this indicates that sellers are gaining traction at the moment.
Finally, in the red box, we can see a strong reversal of the previous uptrend.
This is how trend reversal looks in the Forex market.
With that, Let’s see why trade trend reversals? and What are the particular benefits that can be gained from trading trend reversals?
Why Trade Reversals?
Before dive in and talk about reversal, let’s talk about the opposite of the reversal trading which is Trend Trading.
Reversal Trading vs Trend Trading. What are you choosing?
Probably, Choice of the most traders would be Trend Trading.
Why is that?
The main reason is – Trend traders want to play safe, tend to take small risks and trade in the direction of momentum.
When comparing to the reversal trading, trend trading offers these particular benefits over reversal trading:
- Higher Probability Trade Setup – With momentum on their side, trend trading opportunities have a higher probability of working out—often much higher, in fact—when compared to any reversal trading strategy.
- Higher Trading Frequency – Since trends are longer-lasting, trading set-ups naturally occur more often than reversals.
These factors and others could force trend traders to sidestep reversal trading altogether.
Now you’re probably thinking, is Reversal Trading Dead?
NO! As long as trends are in place, market reversals are always happening.
Besides, Reversal Trading is Where the Big Money Is!
Let me explain,
Unlike conventional trend trades, reversal set-ups are all about taking a calculated risk in anticipation of greater rewards.
And one of the core benefits of reversal trading is that, when a reversal trade works in our favour, they win big and we already gave the proof for that, right? (Look at the trades in the spreadsheet we provide at the beginning).
Higher returns mean small dips in your equity curve which ultimately help you to achieve smoothed rising equity curve.
Have a look at our equity curve for the above trades in the spreadsheet (Trades for December 2020 so far). It is growing smoothly, right? and that’s what you guys also want to do, am I right? Just hang on.
In summary here are the reasons why you should trade reversals.
- Reversal Trading provides trade opportunities with higher risk to reward ratio which mean a one or two losing trades won’t bother you.
- Higher Risk to Reward ratio means you can easily recover from a streak of losing trades which mean overcoming from a drawdown is easy.
- Since one or two losing trade won’t bother in reversal trading, managing your emotional ups and downs is easy.
While making a note on these benefits come from the reversal trading, Let’s move forward to the exciting part where we talk about 4 Trading Tactics which comes in handy when determining trend reversals.
How to Identify Trend Reversals – 4 Proven Trading Techniques
Identification of a trend is easy and a beginner forex trader with basic trading knowledge can also easily spot a trend. If we can spot a market with higher highs followed by higher lows, we can say this is an uptrend. It’s just as plain as that.
But…
At some point, every trend is going to stop or reverse, when it reverses, the market is going to make a huge bullish or bearish move depending on the trend type (Uptrend or downtrend).
So as trend reversal traders, it is our job to identify these reversals in advance.
Now, How to do this?
Here is the truth: There is no way to detect a reversal in the early stages of the trend, nor is there a trading system that can do that.
That implies that it is not possible to capture the top and bottom in reversal trading. If you try to do this, most of the time, you’re going to end up catching a retracement, not a reversal.
But catching a trend reversal and ride big momentum moves are not that hard if you can read the insightful information carried by the price action and the order flow of the market.
Now here’s the question, How do you recognize the trend weaknesses that lead to reversals?
There are 4 proven trading strategies that we used to detect trend reversals. Pay attention, these techniques are very effective.
The first one is…
1. Size of the Trend Wave – The Story Behind the Trend Wave
What is the trend wave?
In an uptrend, trend wave is the extension move to the upside and in a downtrend, it is the extension move to the downside.
Did you know that information concealed within these extension moves brings very powerful reversal signals?
Specifically, I’m referring to the size of the trend move or extension move.
Let’s clarify this using a real chart, Have a look at the AUDUSD 30-Minute Chart below,
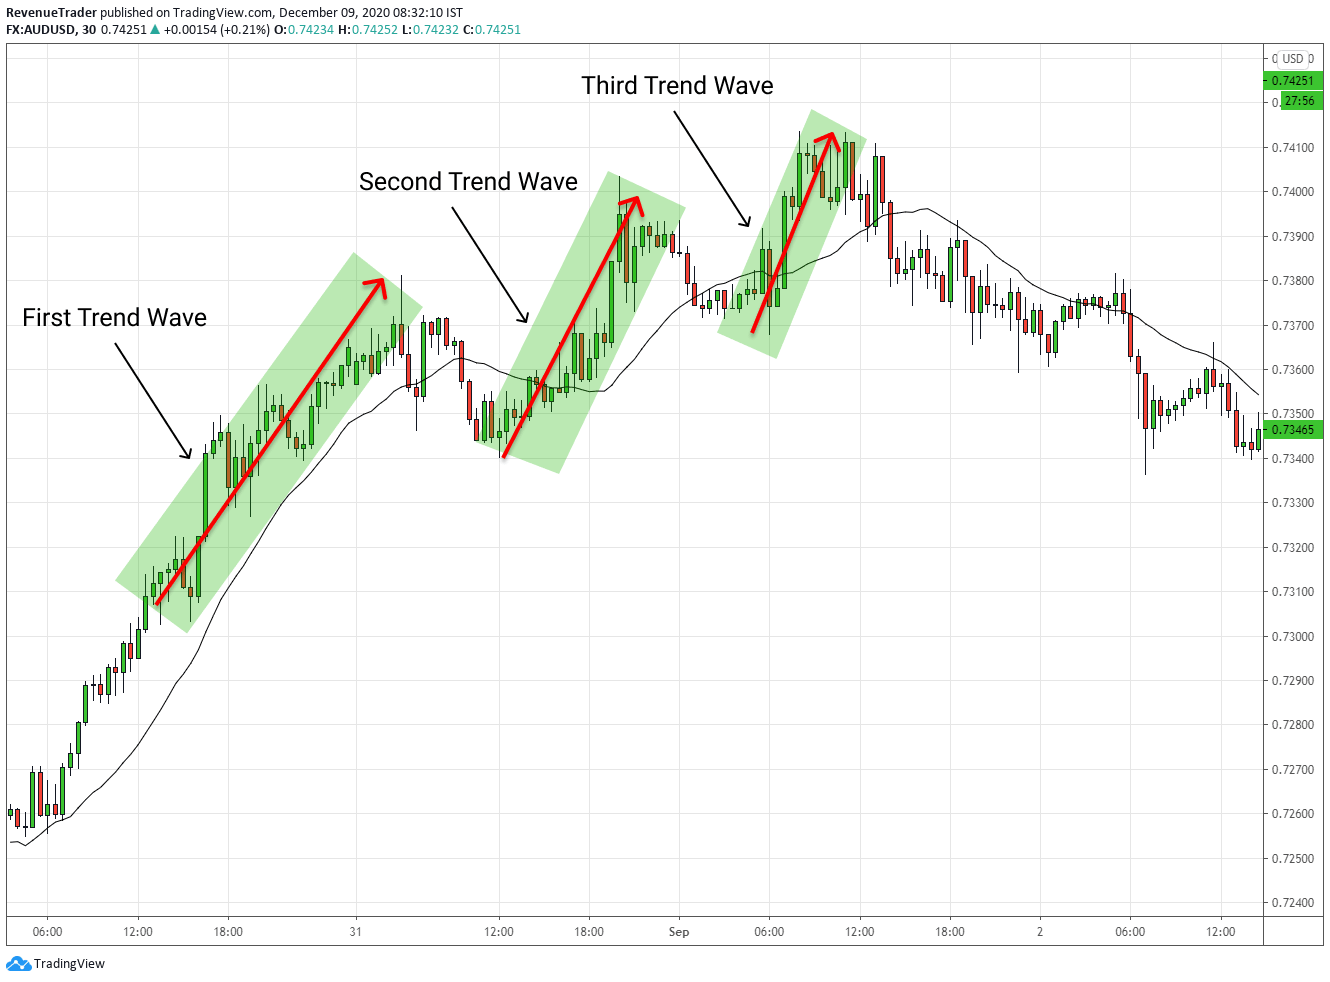
At a glance, we can see that AUDUSD was in a strong uptrend and lately it reverse into a downtrend. Now is there a way to identify this reversal in advance?
Of course, we can. This is where the size of the trend wave comes into play.
According to the above chart, you can see that the size of the first trend wave is much bigger. In order flow perspective, this indicates strong buying pressure.
Next, have a look at the second and third trend wave, the size of the second trend wave and third trend wave is getting smaller and smaller indicating the lack of bullish momentum.
In order flow perspective, this indicates the lack of buying pressure (Maybe buyers are taking their profits).
See the analysis of the trend wave is important particularly the absorption of the information it carries.
Let’s take another example before move into the second technique.
Now, have a look at the EURJPY daily chart below,
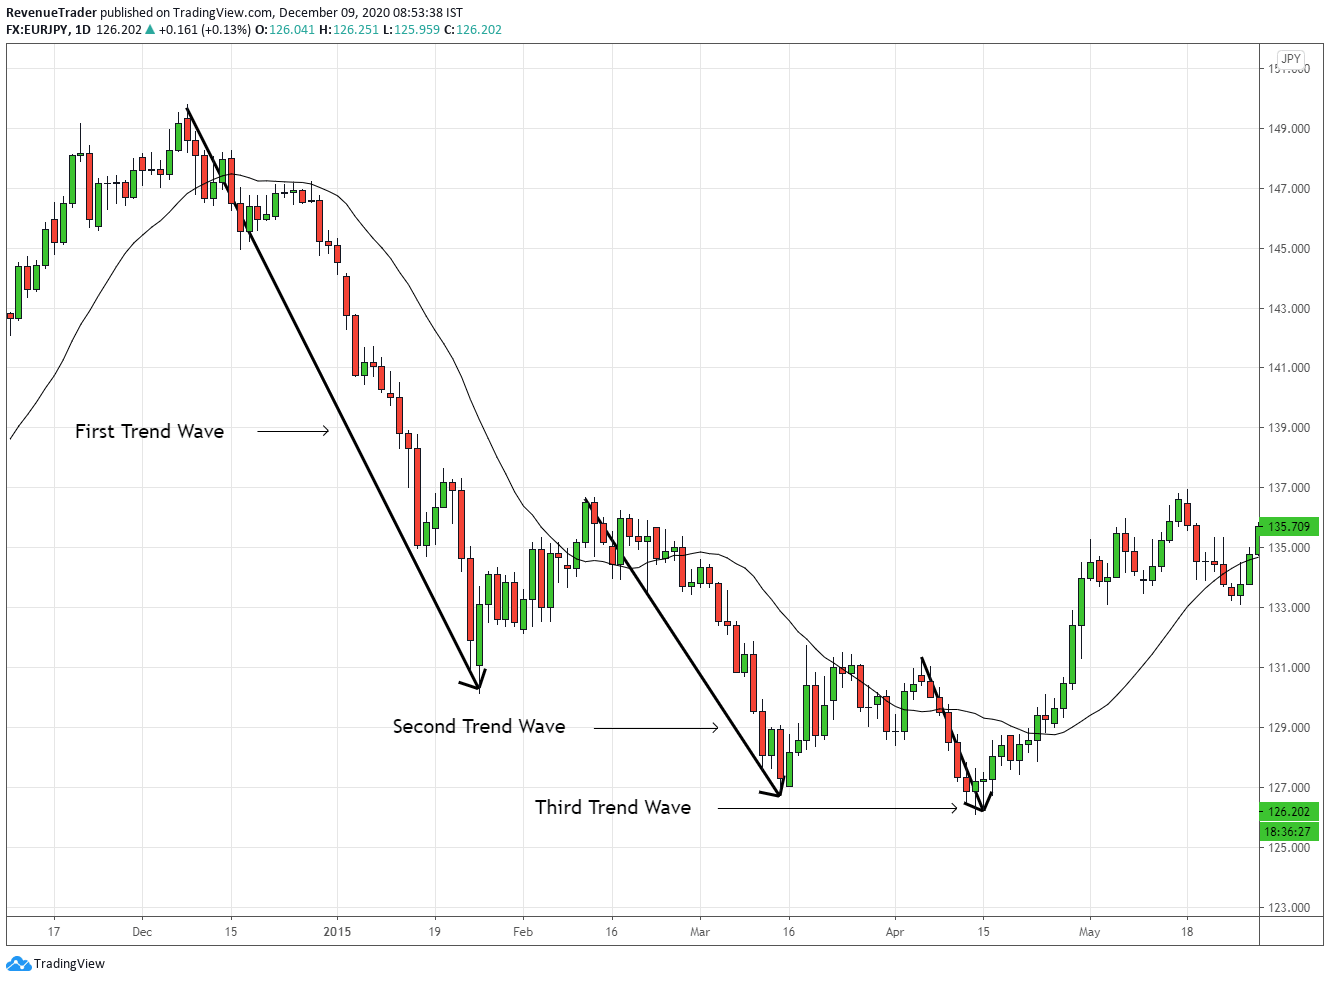
This is downtrend and looks at the right side of the chart – A reversal, right?
Just like the previous example, by observing the trend waves we can easily identify the reversal. Have look at the three waves here, they are getting smaller and smaller indicating lack of selling pressure, right?
Now, what happened after that? A downtrend shifts its direction, allowing us to make huge profit potential to the upside.
Trend wave analysis helps us to analyse the momentum in its direction.
Means – in an uptrend, trend waves help us to identify the changes of bullish momentum and in a downtrend, trend waves help us to identify changes of bearish momentum.
This brings me to the next topic – Size of the retracement move which helps us to identify the momentum of the opposite side.
2. Size of the Retracement Move (Or Pullback)
Downtrends and uptrends are not straight moves on the chart, During the trends, there are some points where the market stop to breath which resulted in retracement (or Pullback) in the opposite side of the ongoing trend.
This retracement, specifically the size of the retracement helps us to determine the strength of the opposite direction of the current trend.
Means – In an uptrend, the size of the retracement indicating the selling pressure and in a downtrend, the size of the retracement indicating the buying pressure.
Let’s clarify this using a chart. Have a look at the EURJPY daily chart below,

First of all, from the left side, it is an uptrend and from the right side it is a reversal, right?
Now, how do we identify this reversal in advance and is it possible? Yeah! with the clues this chart have, it is possible.
Now have a look at the first and the second retracements. Both retracements are small indicating minor selling pressure during the uptrend. This kind of small retracements during an uptrend indicates the bullish momentum is still in place and in order flow perspective, it indicates that buyers are still in control.
Next, have a look at the third and fourth retracement, Both of them are deeper retracements, right?
This indicates that the selling pressure is getting increase gradually and as a result of that EURJPY ended up reversing.
The deeper retracement against the on-going trend means that the momentum of the trend is getting low, so the probability of a trend reversal is much higher.
Now let’s see another example, an advance one. Have a look at AUDUSD 4-Hour chart below.
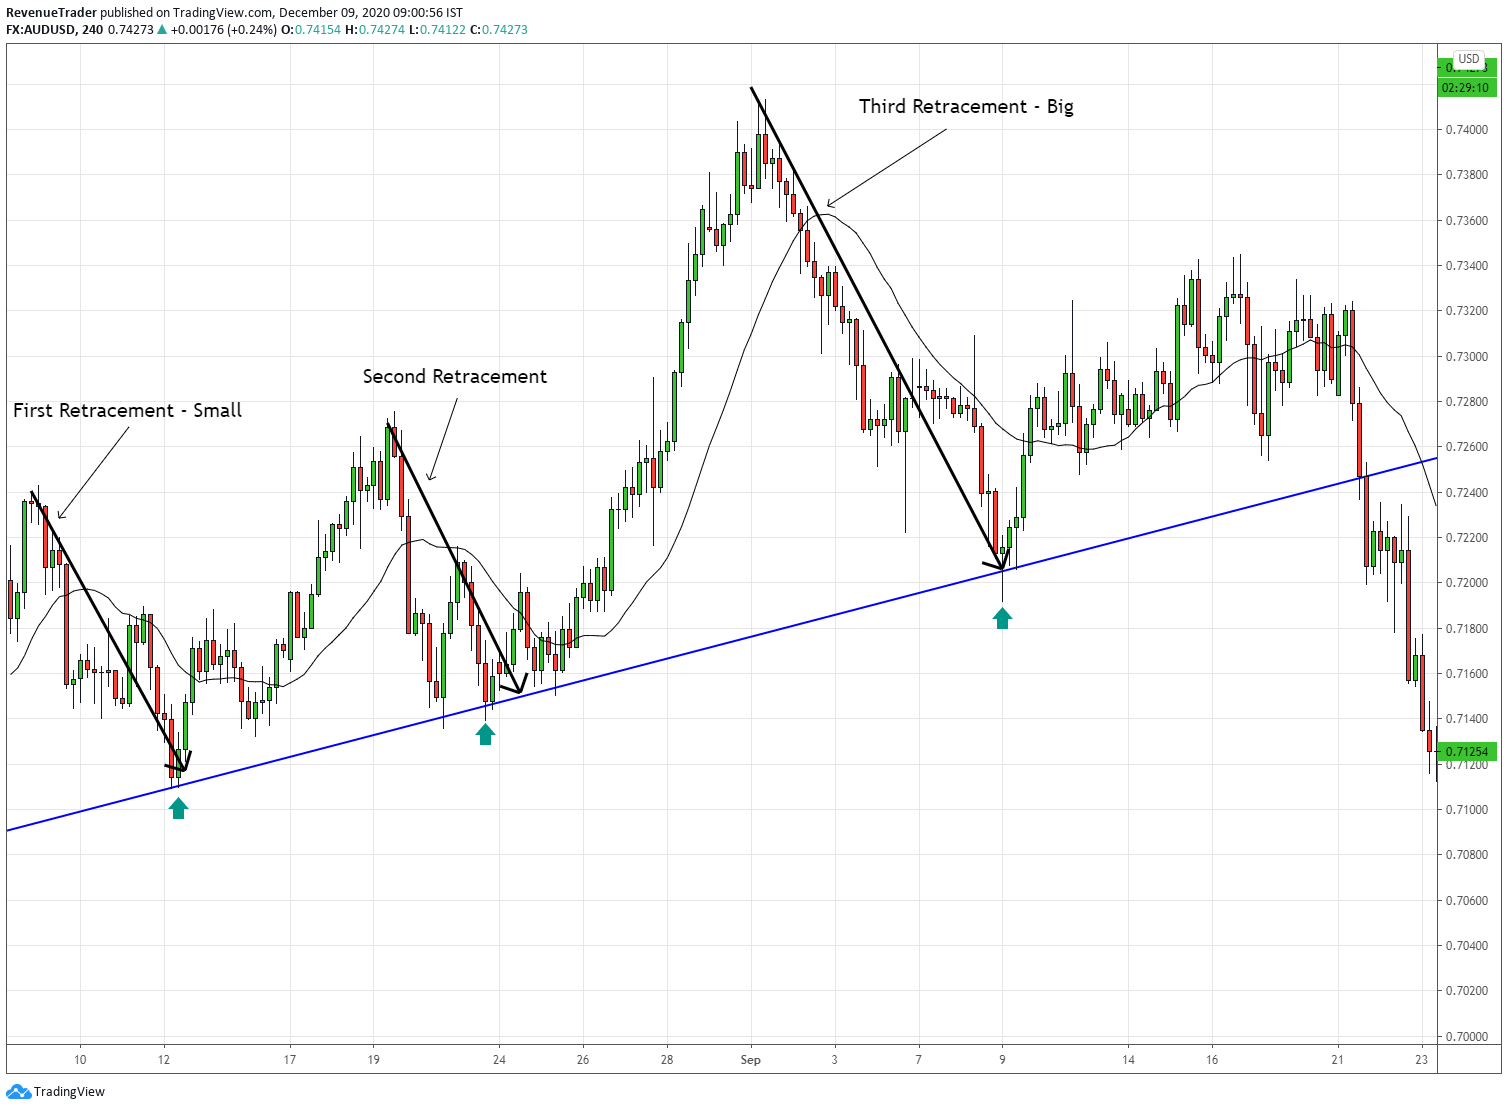
First all you can see that price making higher highs, technically this is an uptrend but not a perfect one though. Also, price is respecting to the uptrend line as well.
Now first and second retracements are equal in terms of size. But have a look at the third retracement. It is twice as the first two, right? This is a clear indication of strong selling pressure during an uptrend.
So what is the end result? A quick reversal, right?
I think you got the idea of the first two methods. Now keep in mind that when combining these two methods, we can spot trend reversals with deadly accuracy.
Next…
3. Break of a Previous Higher Low or Lower High (Change of the Overall Trend Structure)
An uptrend is when price making higher highs and higher lows. What happened if price makes lower lows, instead of higher highs.
If that happened, the structure of the uptrend is changed, right? This is a high probability trend reversal trading confluence we see again and again in the forex market.
Have a look at the AUDCAD 4-Hour chart below.
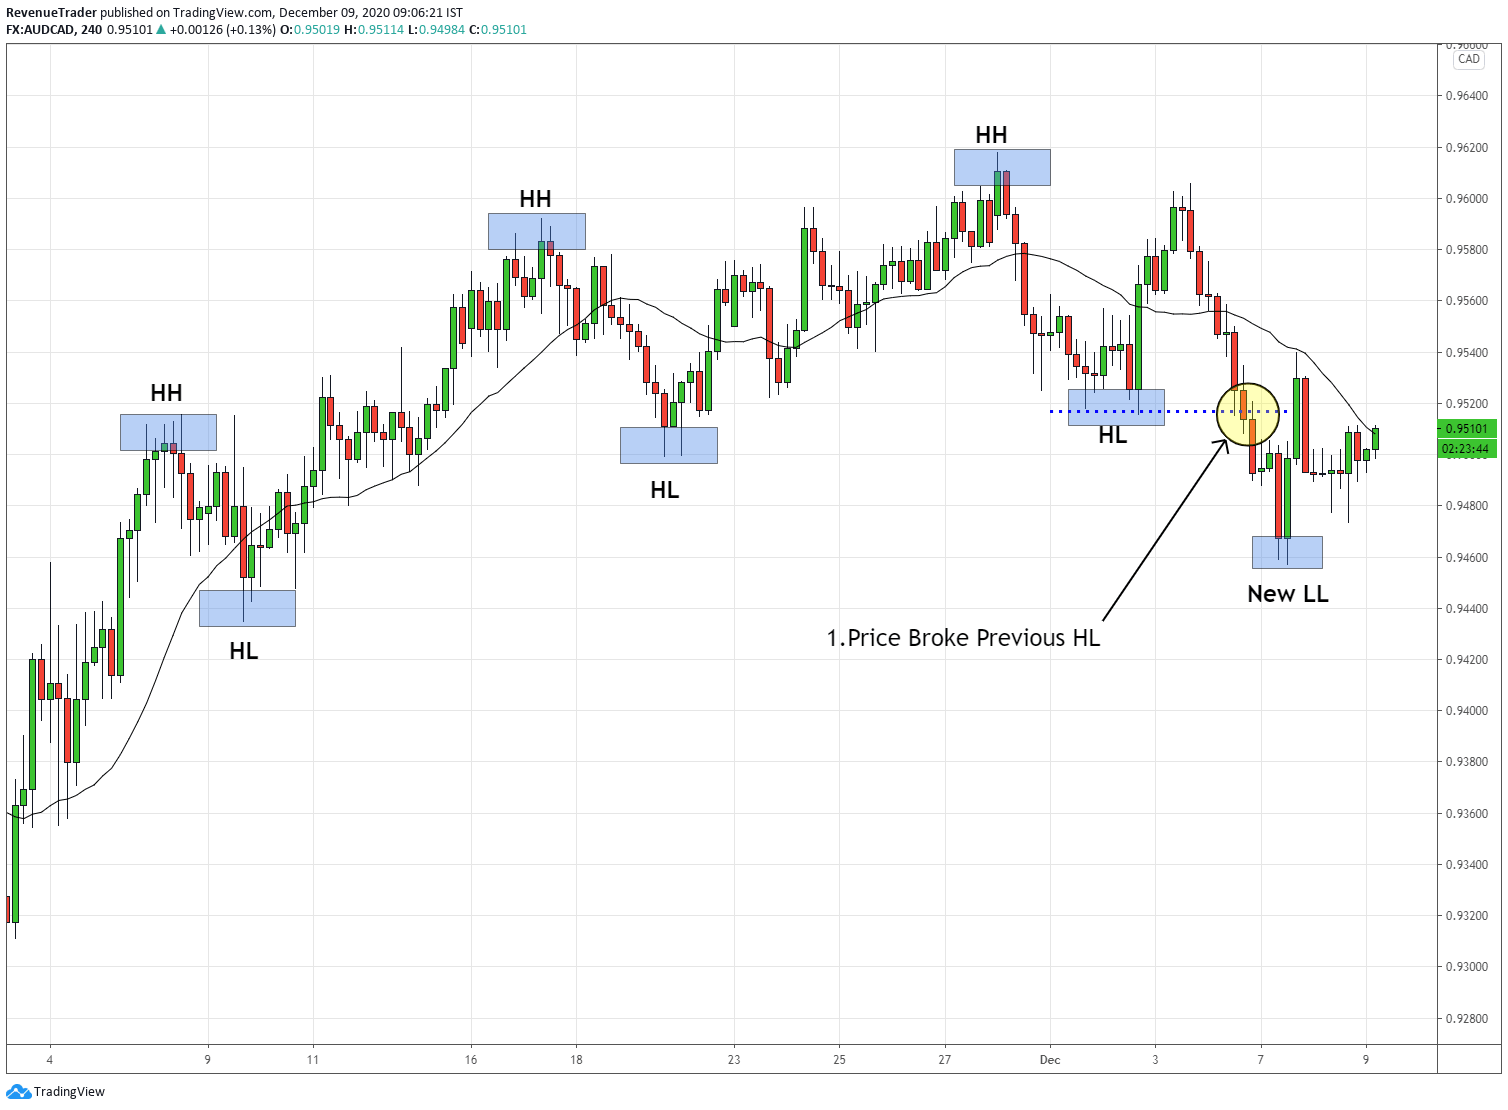
First of all, It is an uptrend with a series of higher highs followed by higher lows. Now have a look at the breakout of the previous higher low. What happened there?
Instead of creating a new higher high, the price ended up forming a new lower low by breaking the previous higher low which resulted in a possible shift in the uptrend.
On this point onward, a reversal on AUDCAD is highly possible.
Next, Have a look at the AUDJPY 2-Hour chart below.
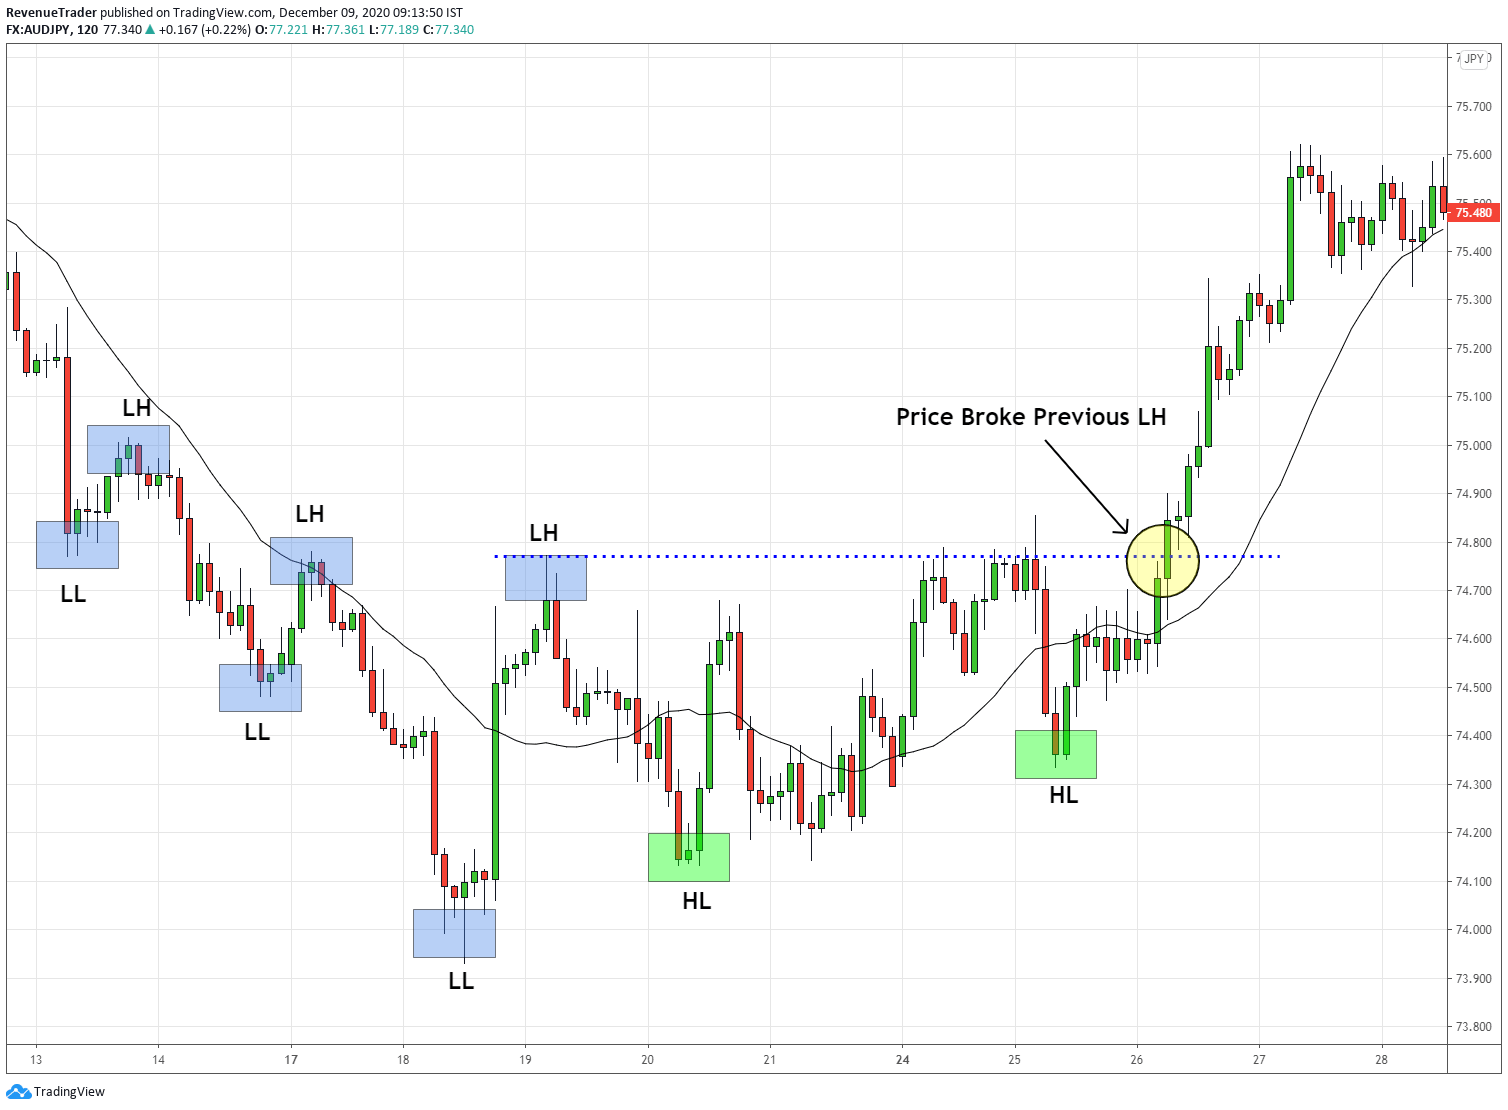
In this case, we have a downtrend with a series of lower lows followed by Lower highs. First, we can see that, instead of price creating Lower lows, price action started to form higher lows. In order flow perspective, this indicates that buyers are getting traction over the market.
Finally, price broke above the previous Lower high which invalidates the previous uptrend and as a result of that price ended up reversing into the other direction.
I hope you got the idea here.
Let’s move on to the final technique.
4. Trend Line Bounce Failure
Among these 4 methods, this is the most reliable reversal signal. When this pattern is present, we give it our full attention.
So what is this pattern?
Have a look at the AUDCAD 2-Hour chart below,
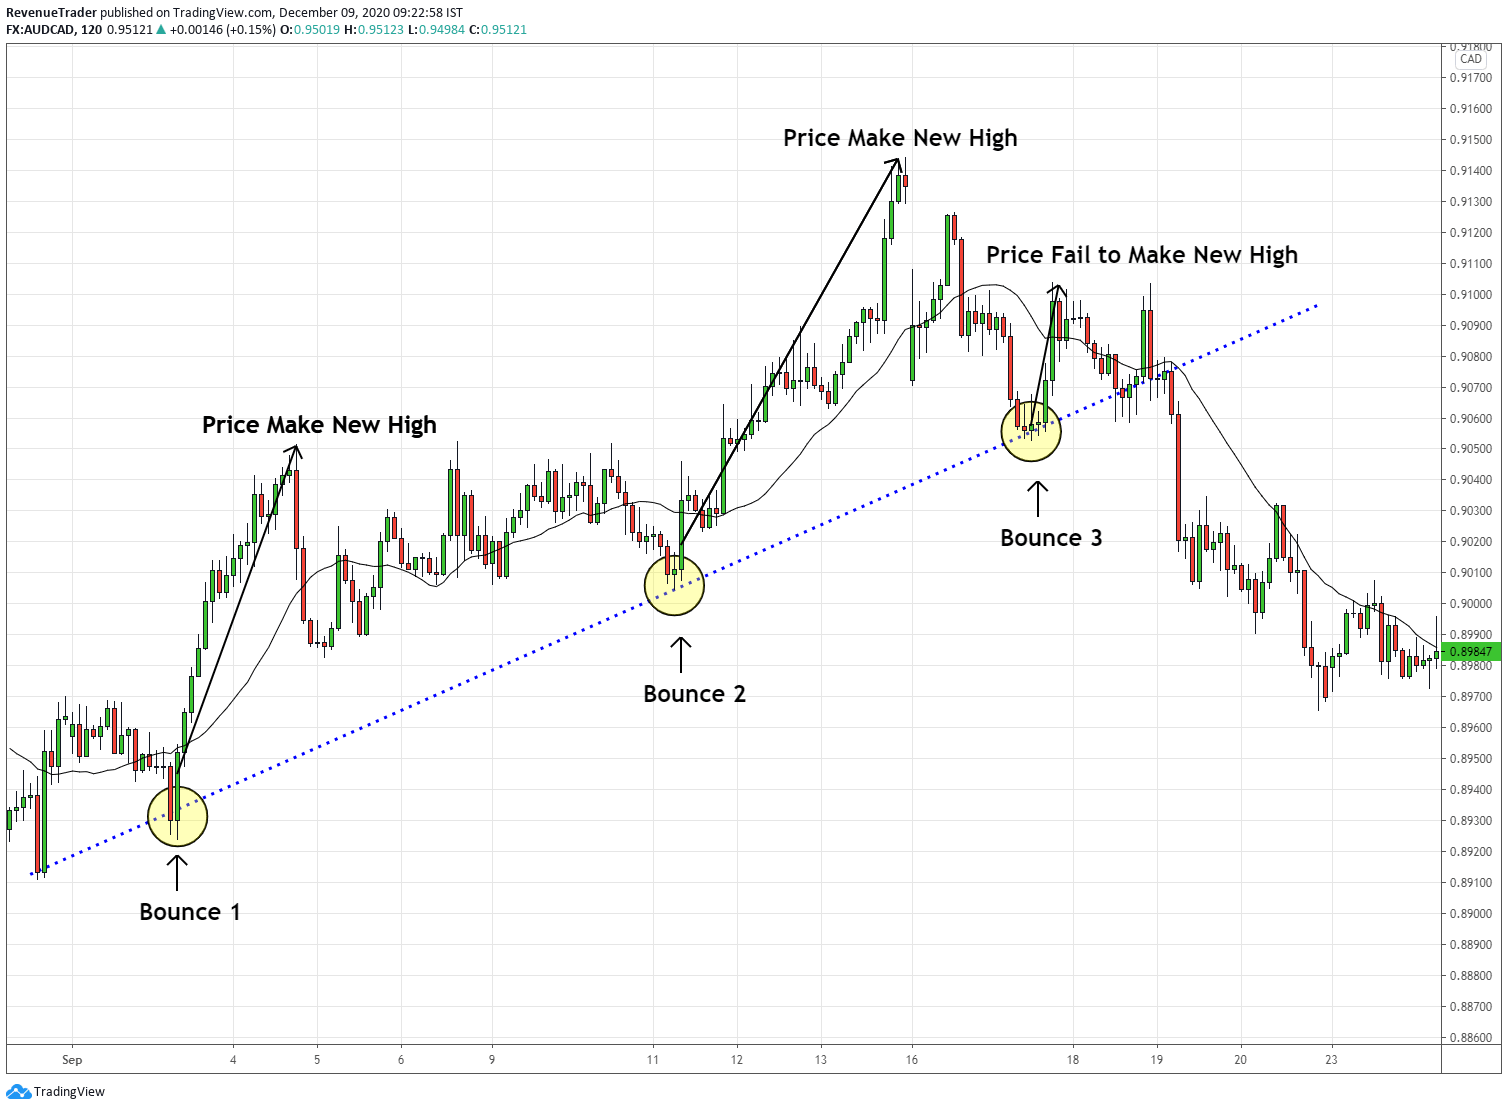
First of all, you can see that AUDCAD was in a strong uptrend. Next, have a look at the trendline, every time price pullback to the trendline, the price ended up making a new high. Look at the bounce 1 and 2.
Now have a look at the third touch (Bounce 3) of the trendline. This time it is a different story, right?
This time price fails to bounce from the trendline. This is what we called the Trend Line Bounce Failure Pattern.
See after that failure bounce, Price ended up reversing into the other direction.
Okay, Let’s take another trade example. Have a look at the AUDUSD 4-Hour chart below.
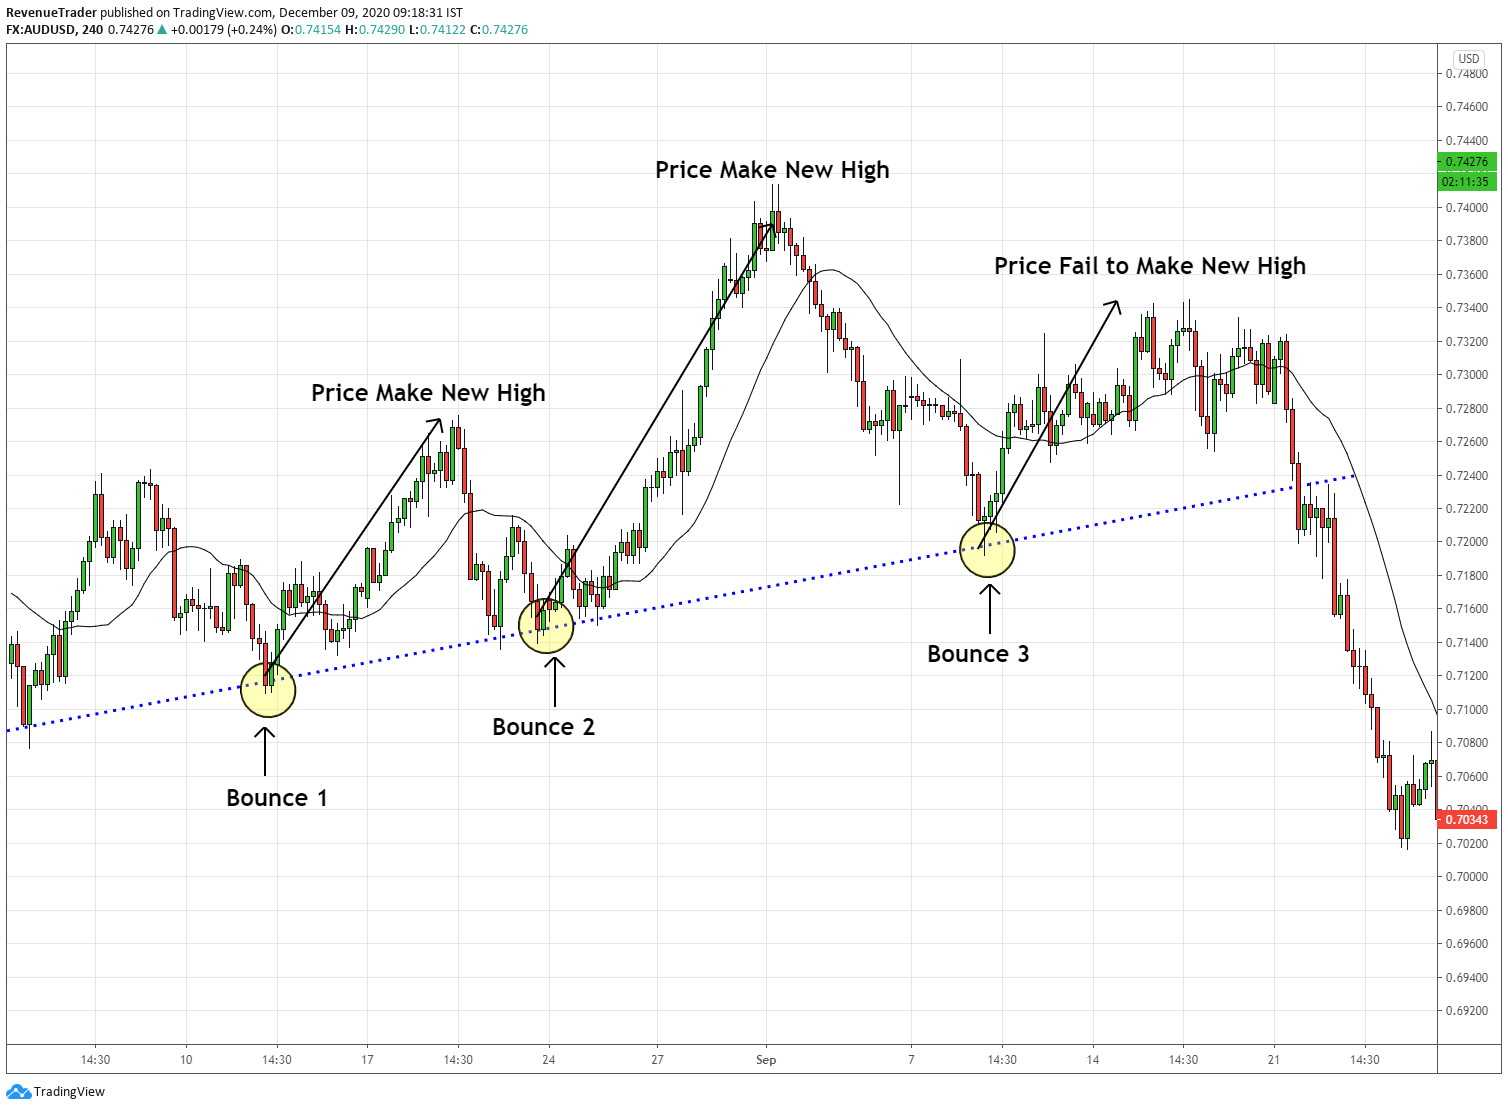
Just like the previous example, the market was in an uptrend (Not a technically perfect uptrend though). Have a look at the first two bounces each time price made a new high, right? But bounce 3 was a failure, it fails to make a new high, Instead, it broke below and started to reverse.
There you have it – 4 practical ways to identify trend reversal.
These 4 trading techniques are highly accurate and often provide highly accurate signals of trend changes.
Now with these 4 techniques, you can easily identify trend reversals.
But how do we get involved and ride reversal?
This is where reversal entry technique comes in the play.
5 Profit-Driven Trend Reversal Patterns
Upon identifying the reversal sign, our next task is to ride the reversal and make some profit. This is the whole point of reversal, isn’t it?
Knowing when to enter the market is a crucial skill every trade must master and in reversal trading, the profit potential you are going to make depend on the trade timing.
Now we are going to talk about 5 Reversal Patterns which provide high-profit potential in terms of risk to reward ratio.
So what are the Forex Reversal Patterns?
Forex reversal patterns are chart formations that help predict reversal areas with high probability. They may take the form of one candle or a group of candles in a particular form, or they may be a classical structural chart pattern.
With that let’s talk about these reversal patterns one by one with examples.
Note: You cannot trade these patterns whenever they occur. This will leads to unprofitable trading. To get maximum out of these patterns, combine them with the 4 trading techniques we talked earlier.
Double Top and Double Bottom Pattern
This is one of the most popular patterns in the forex market and if used correctly, these two patterns often provide good trend reversal trade entries.
Let’s take an example. Have a look at the AUDCAD 2-Hour chart below.
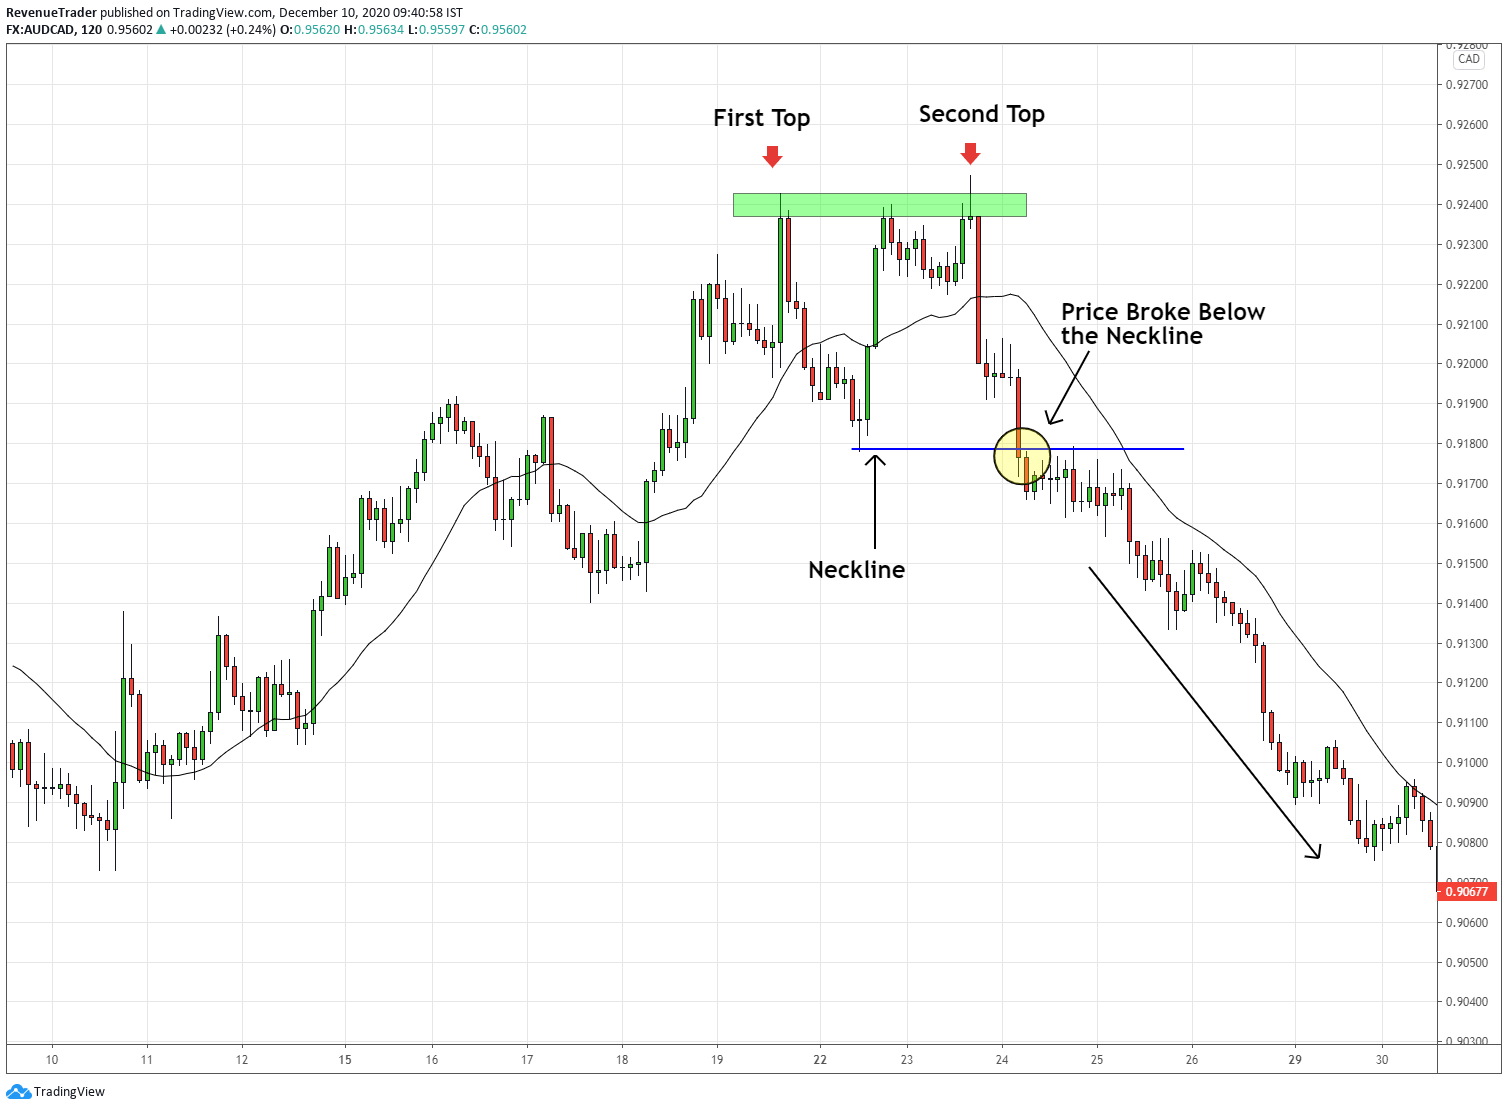
From the left, it is an uptrend but have a look at the double top pattern. From there onward, buyers were struggling to keep pushing higher. At this point, we know uptrend is losing momentum and eventually price ended up breaking below the neckline triggering us to go short on AUDCAD.
Look at the profit potential to the downside, It is huge, right?
Next, have a look at the double bottom pattern on the AUDJPY 30-Minutes chart.
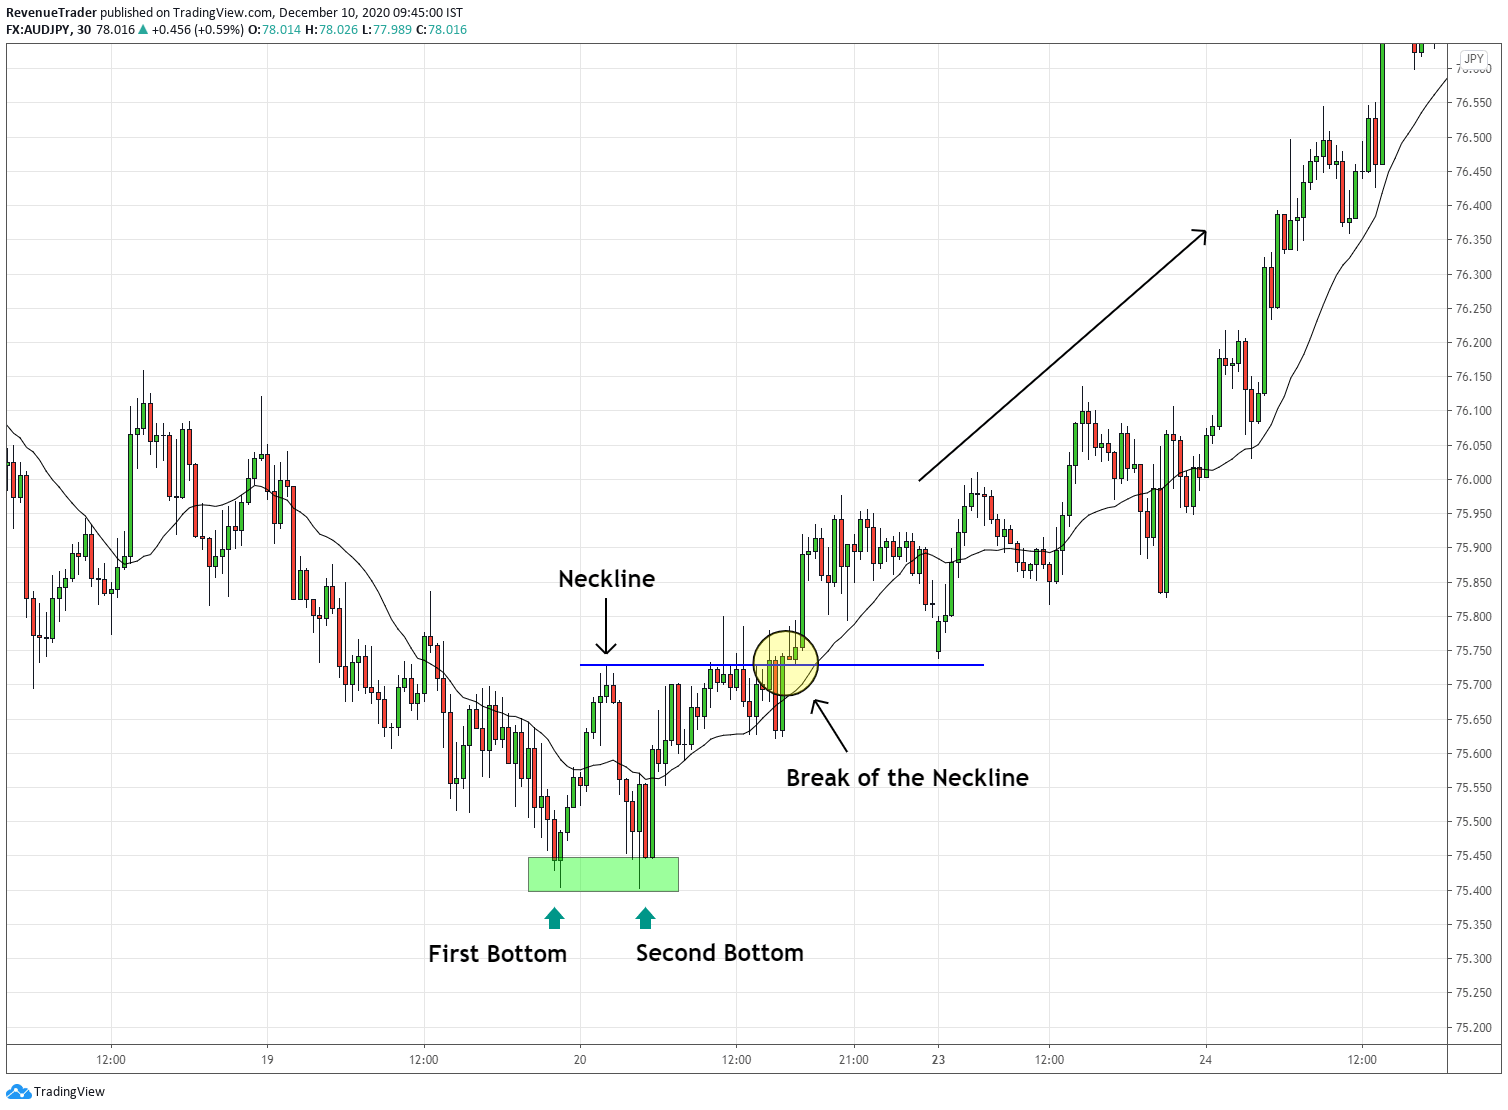
First of all, it’s a downward trend from the left. If we examine the trend wave and the retracements, we can conclude that downtrend is steadily losing momentum.
Then the occurrence of the double bottom pattern is significant. It’s telling you the downtrend is over. Taking a long trade at the break above the neckline would be a smart idea to catch the reversal earlier.
As expected, the price ended up forming not a reversal but a whole new uptrend.
With that let’s move onto the next pattern…
Related – How to Trade Double Bottom Pattern: A Step by Step Guide
Head and Shoulders Pattern
With years of trading experience, I can say that head and shoulders pattern is the most reliable in term of catching trend reversals. There is no doubt about it.
Now let’s see this pattern in action. Have a look at the head and shoulders pattern formation on AUDNZD 60-Minutes chart.
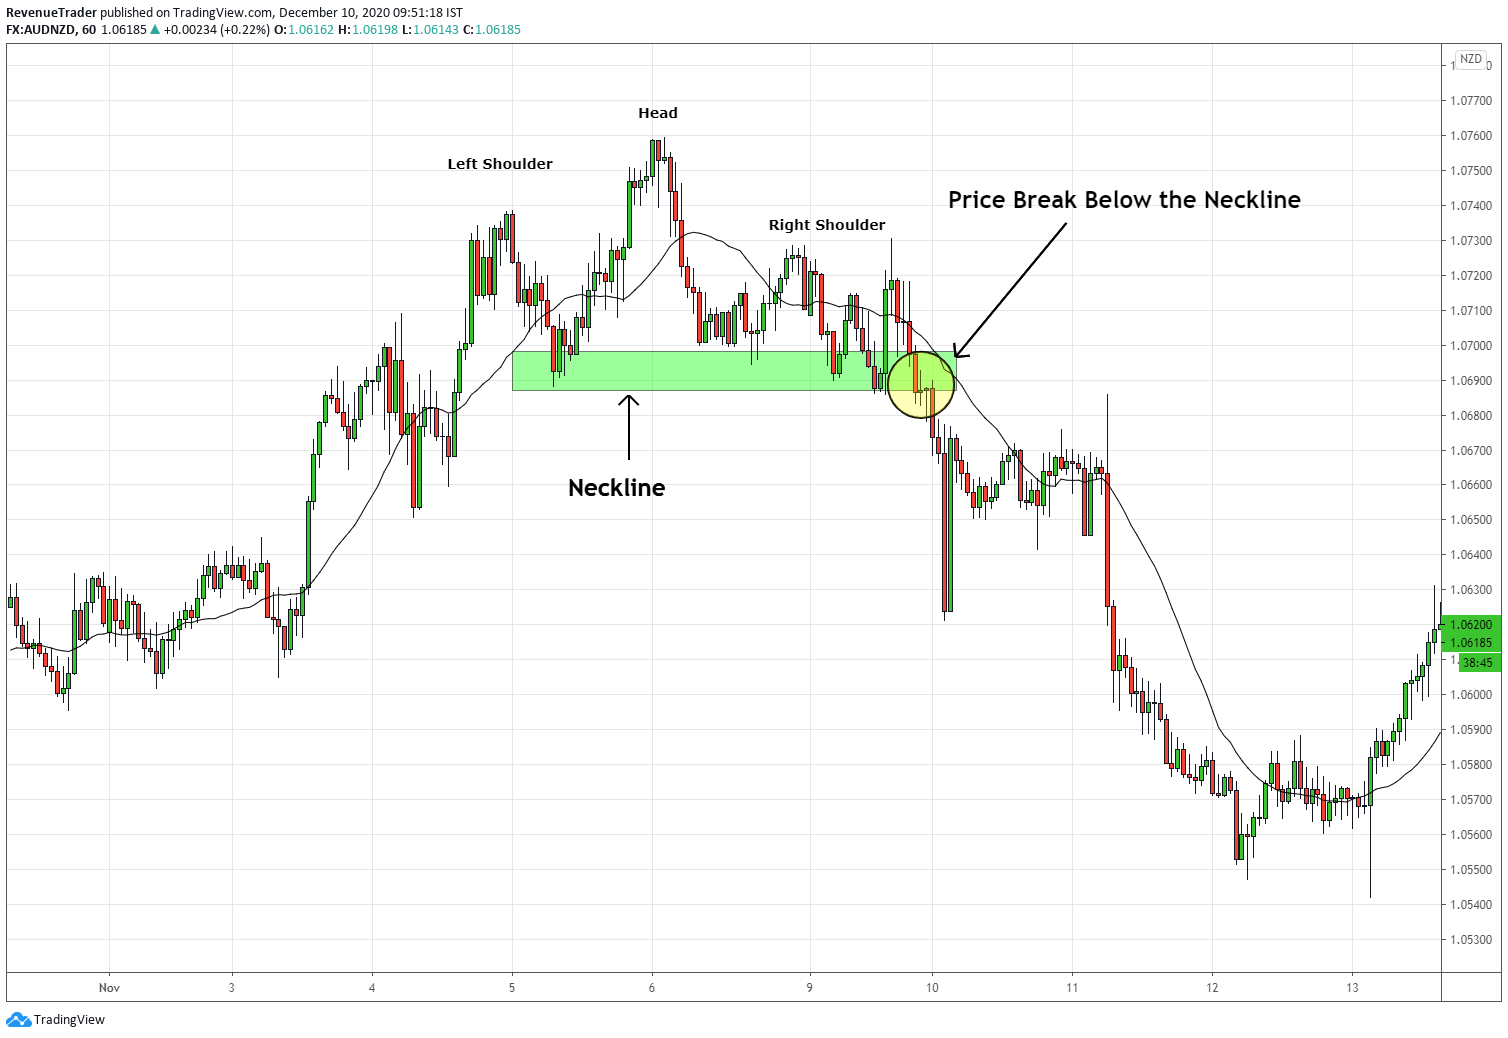
First of all, have a look at the retracements, they are getting deeper and deeper indicating the increase of selling pressure. If we combine this with head and shoulders pattern displayed in the above chart, a reversal would be highly possible here.
We can go short after the price break below the neckline and observer the chart above. What happened after the breakout…?
Next the opposite of the of this pattern, inverse head and shoulders help us to catch the reversal of the downtrend market.
Have a look at the AUDCAD 60-Minutes chart below,

Just like the previous example, the occurrence of the inverse head and shoulders pattern indicates the lack of selling pressure. A long trade upon the break above the neckline would be a good idea to catch the reversal.
Next…
Related – Head and Shoulders Pattern in Forex – A Reversal Trading Strategy
Related – How to Trade Inverse Head and Shoulders Pattern – A Complete Strategy
Break of the Local Structure Level
First of all, what is a local structure level?
In a trend (Uptrend or downtrend), the swing points are the local structure level and break of these levels (In an uptrend, break below the local structure level and in a downtrend, break above the local structure level) are often provide good trade entries with higher Risk to Reward ratio.
Have a look at the AUDNZD 60-Minutes chart below.
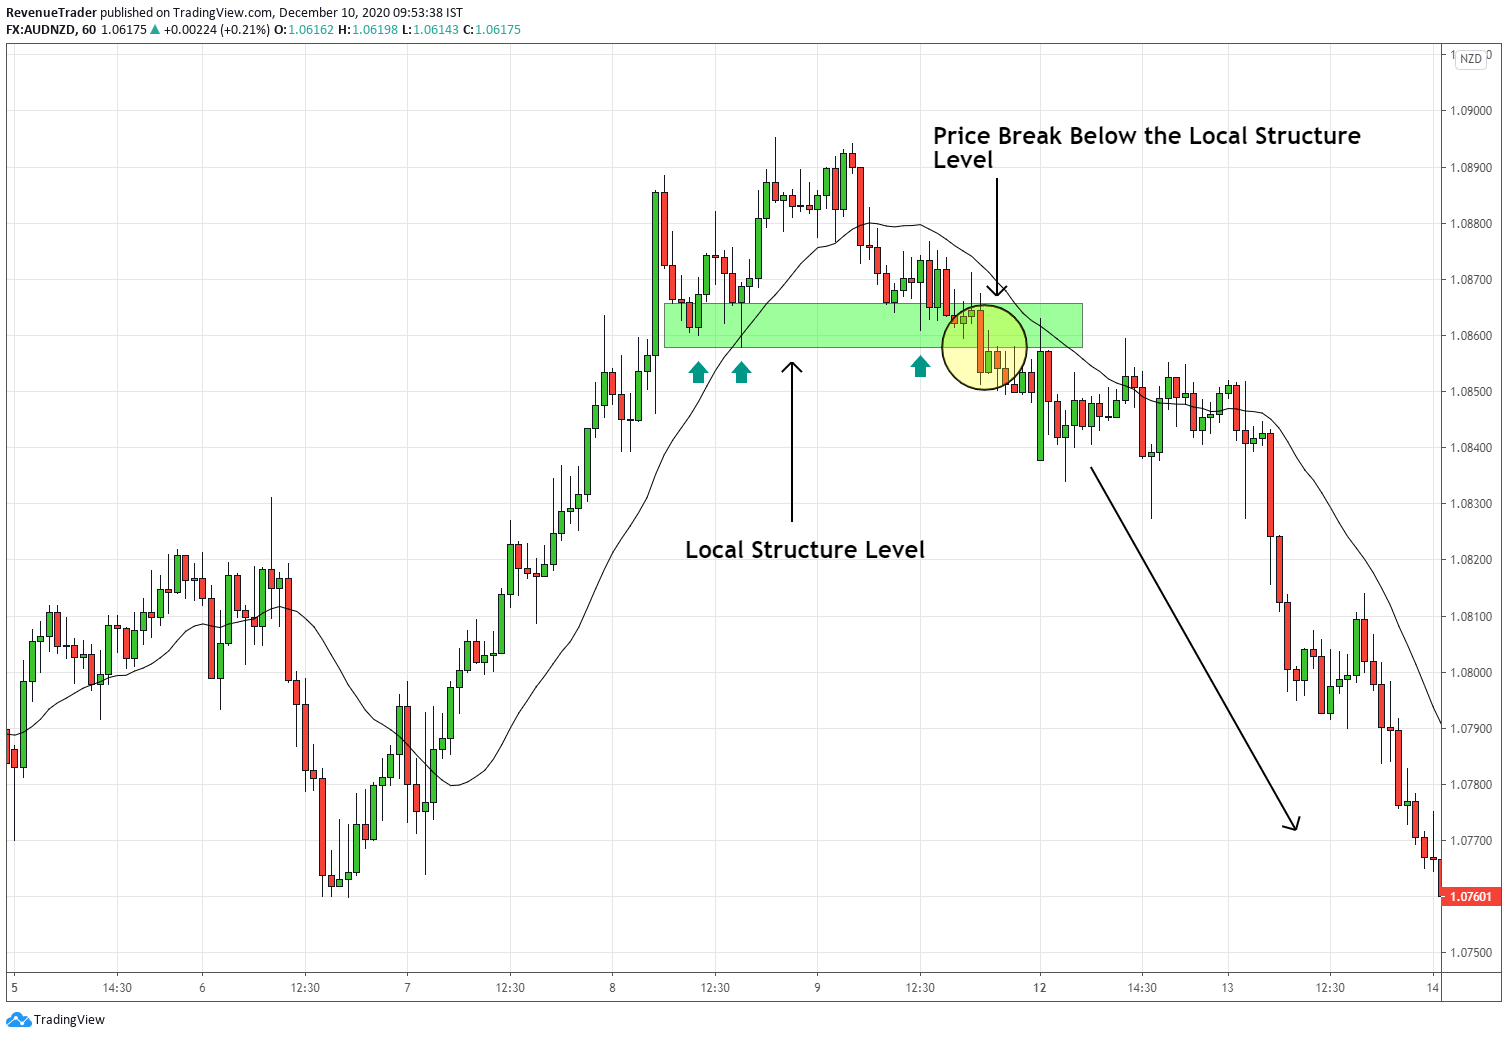
First of all, if we analyse the latest trend wave and retracement, it clear that the uptrend is losing its momentum. Next, have a look at the local structure level (which is drawn from the previous HL) which work as support during the uptrend.
In the end, however, price broke below the local structure level, showing the aggressiveness of the sellers and as predicted, the price ended up dropping sharply.
Next, have a look at the EURAUD 2-Hour chart below.
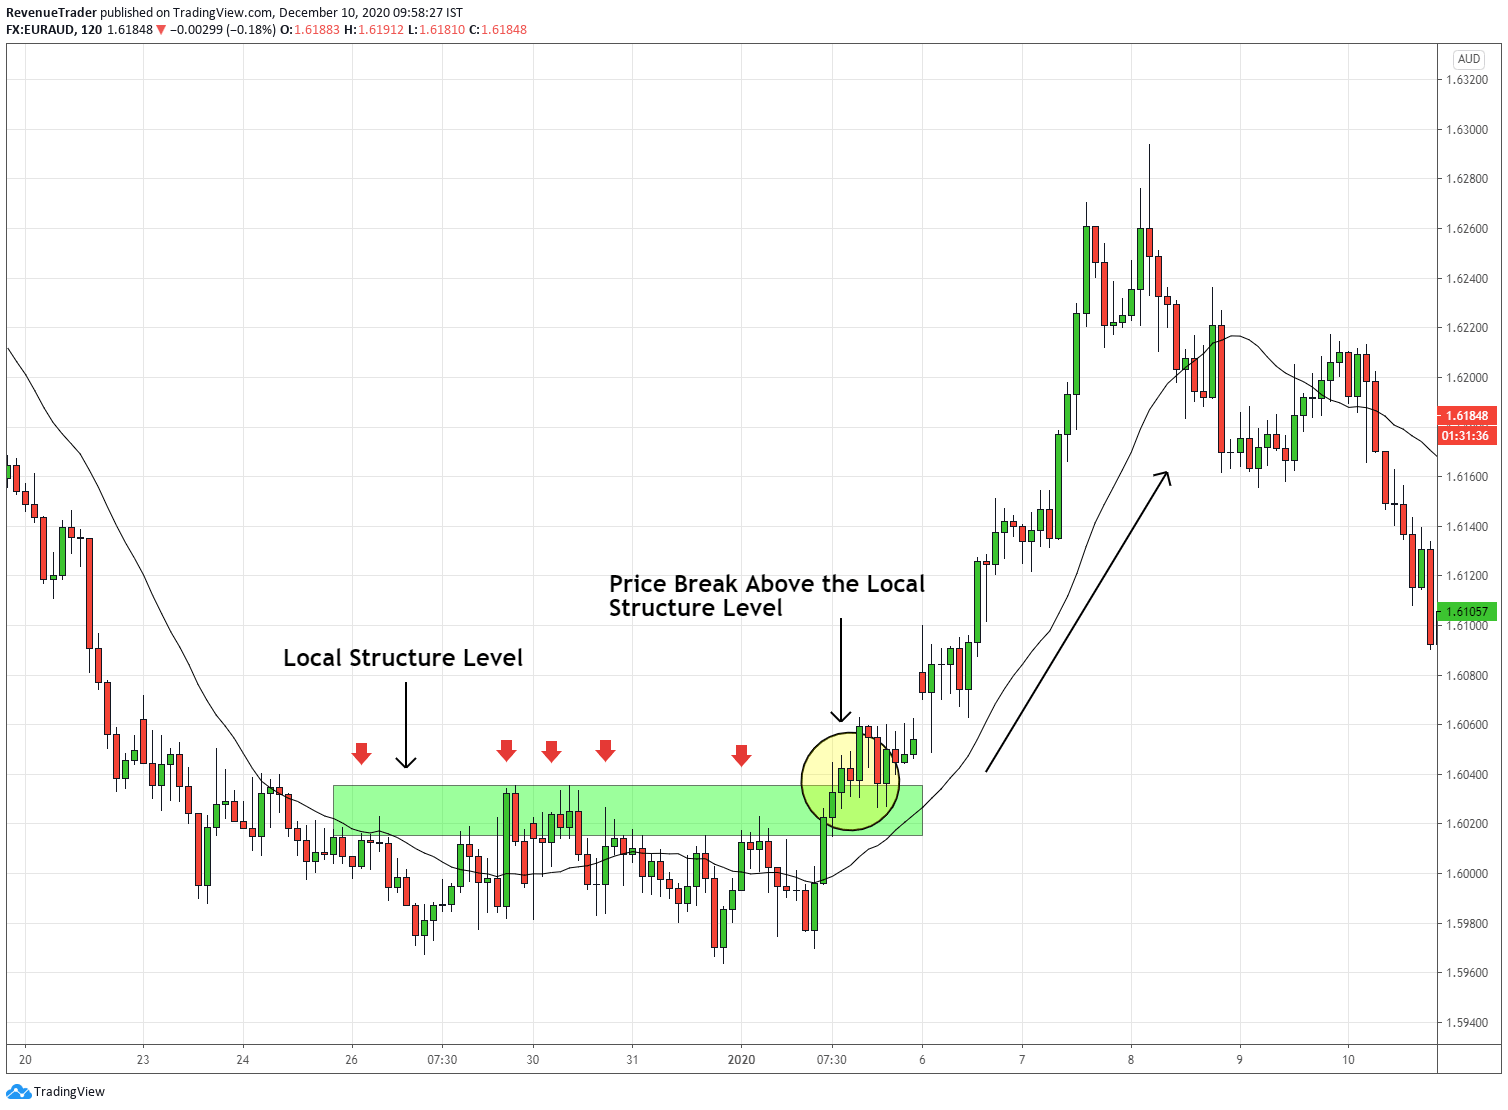
Have a look at the trend waves here, they become smaller and smaller while the retracement moves are getting bigger and bigger. In order flow perspective, this indicates the lack of selling pressure in the downtrend.
Next, have a look at the local structure level which is drawn from previous LH. As long as the price is trading below this level, it still a downtrend, but the price ended up closing above the local structure level and this would be a good time to place a long trade.
Break and Retest pattern is highly profitable trade entry techniques to catch trend reversal pretty quick especially in highly momentum scenarios.
But there are some times, where the breakout is closed too far away from the local structure level. This makes it hard to achieve a favourable risk to reward ratio for trades.
To prevent this we can use Break and Retest Pattern which always allow us to place trades with favourable Risk to Reward Ratio.
Break and Retest Pattern
The whole point of using this pattern is to achieve higher Risk to Reward ratio.
If the breakout of the local structure level is too big, the break and retest pattern comes in handy.
Have a look at the GBPUSD 2-Hour chart below.
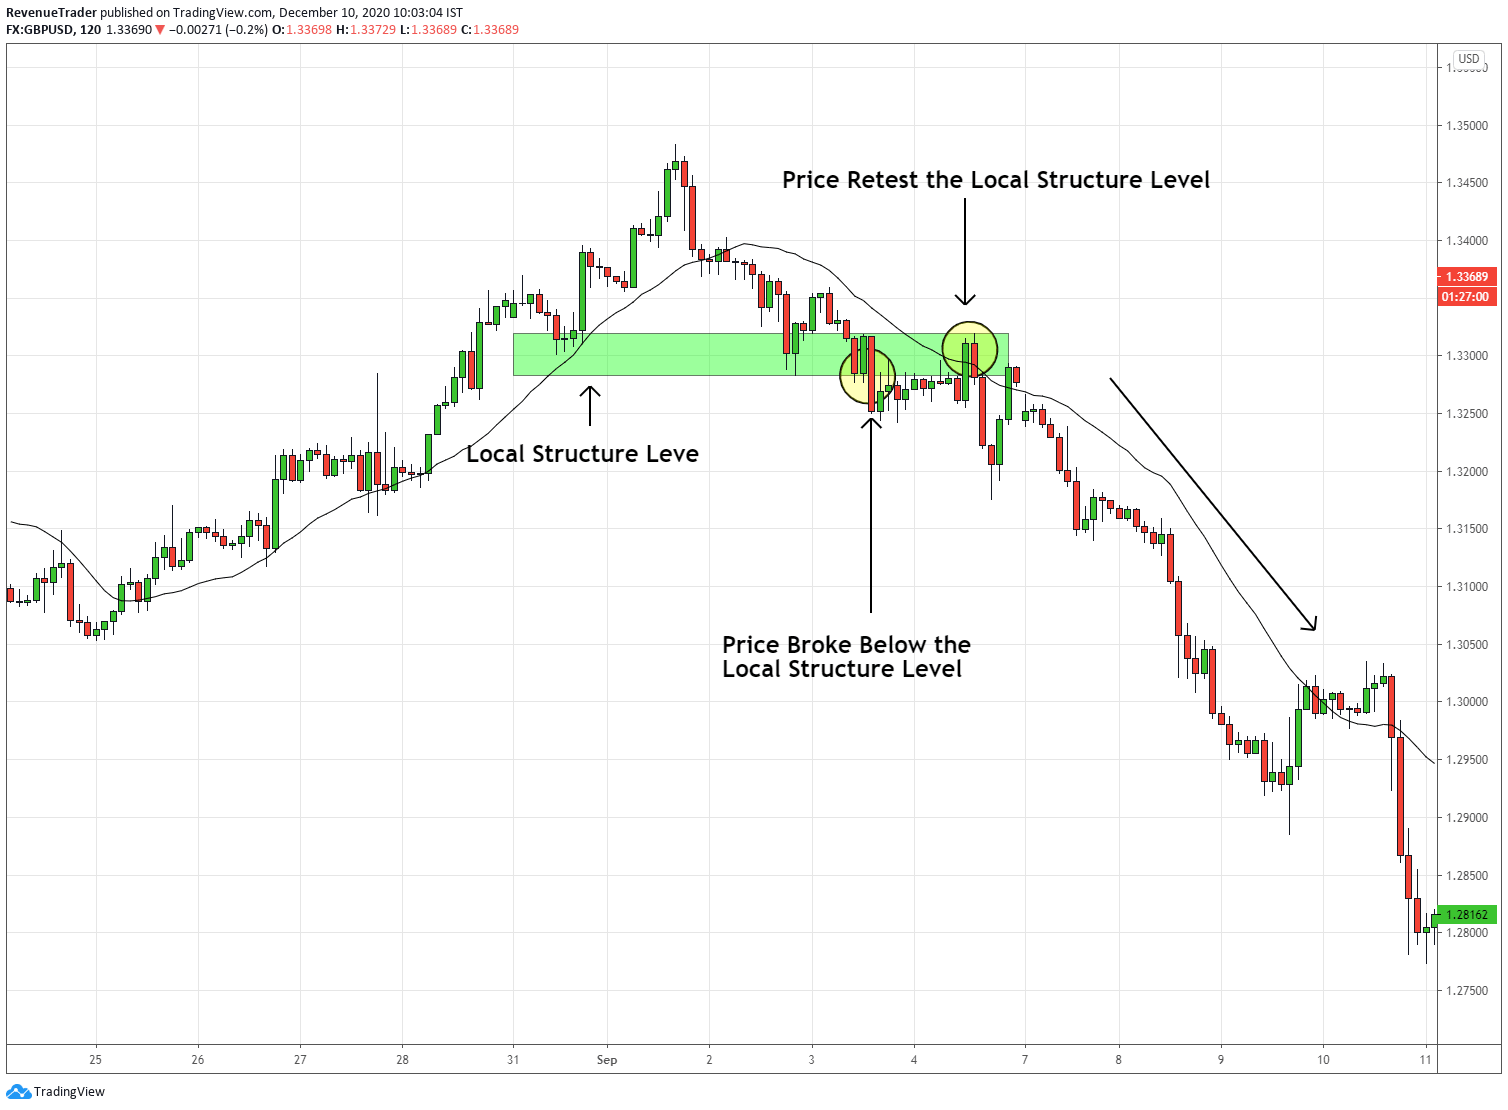
The price break and closed underneath the local structure strongly and the breakout candle is a little far away from the local structure level. Placing a short trade here would result in a low risk-to-reward ratio. Therefore, waiting for a re-test of the local structure level allows us to have a reasonable risk of reward ratio compared to the previous one.
with that let’s move into last reversal pattern which allows us to ride the momentum.
Momentum Drive Pattern
This pattern was called Momentum Drive Pattern. You can’t find this pattern anywhere else.
So, What is this patter?
Simply put, we wait for a strong momentum to the opposite direction of the ongoing trend then ride the momentum. That’s it.
This pattern has three components – Momentum Move, Small Pullback (Or Hold) and Continuation.
Let’s clarify this by using EURCAD 1-Hour chart below.
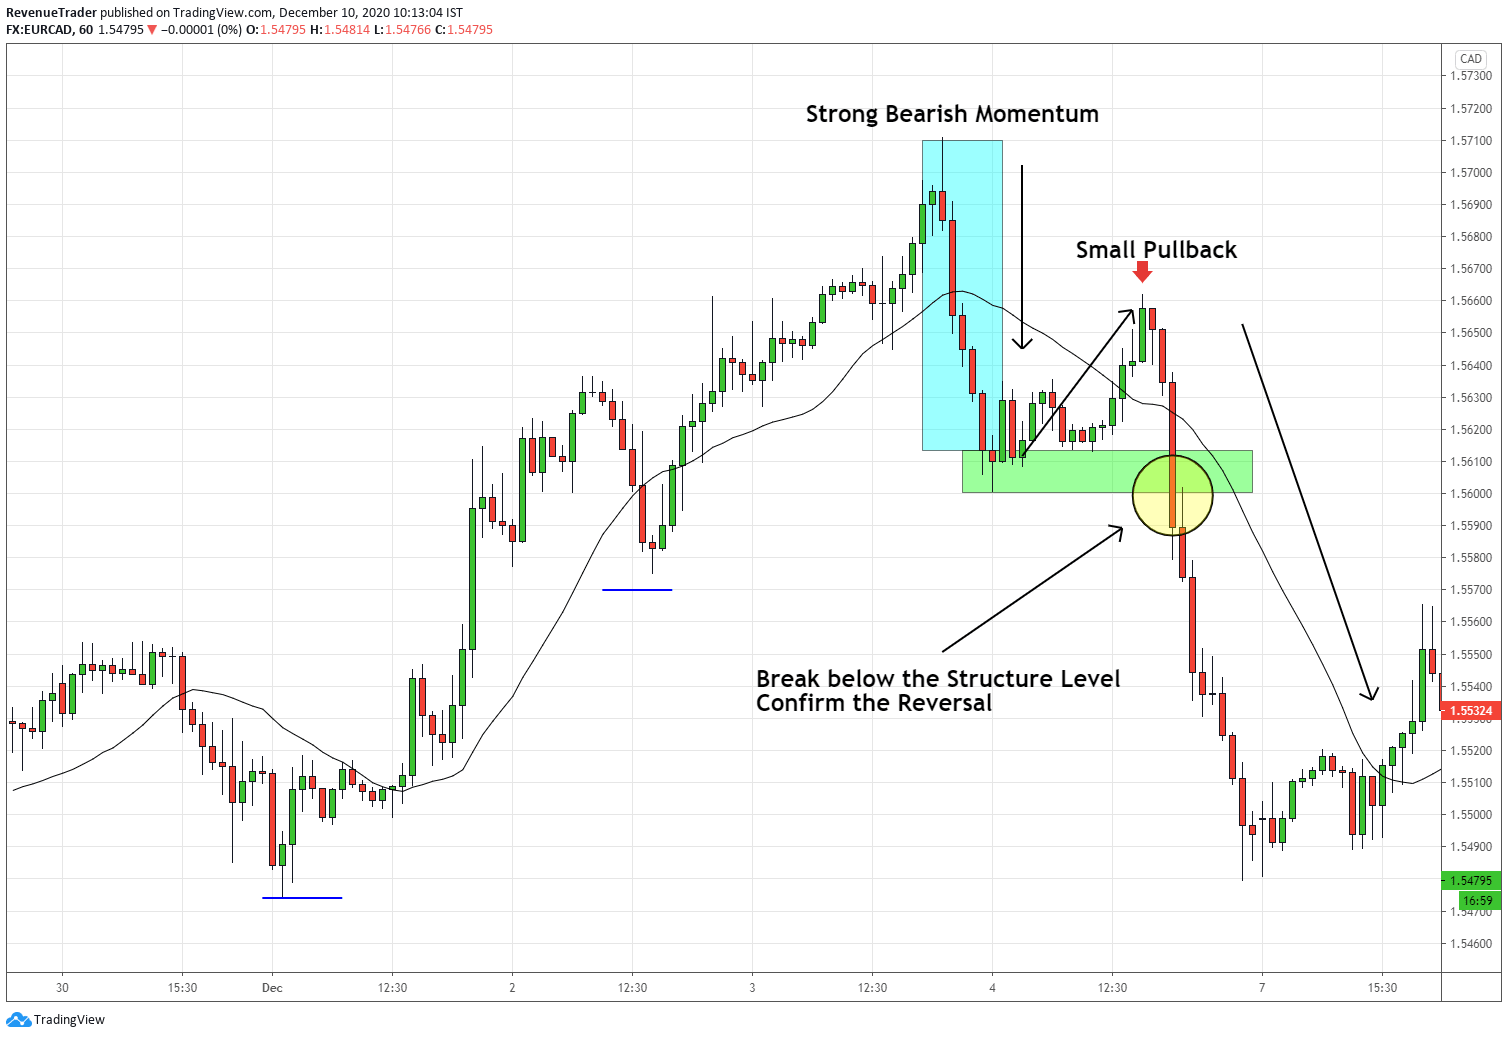
First, on the left side, we can see this it is an uptrend. Next, have a look at the blue box, it is a retracement, right? But not an ordinary retracement, it packed with lots of bearish momentum against the trend. This is the first part of this pattern.
The second part is the small pullback and more importantly, this pullback should smaller than the momentum move. This indicates the lack of bullish momentum in the uptrend.
Finally, we have a continuation part, this is where we are going to place trades. Simply we wait for a break below of the local structure level and then we place a short trade.
Let’s see another example. This time it is on GBPAUD 1-Hour chart in opposite direction.
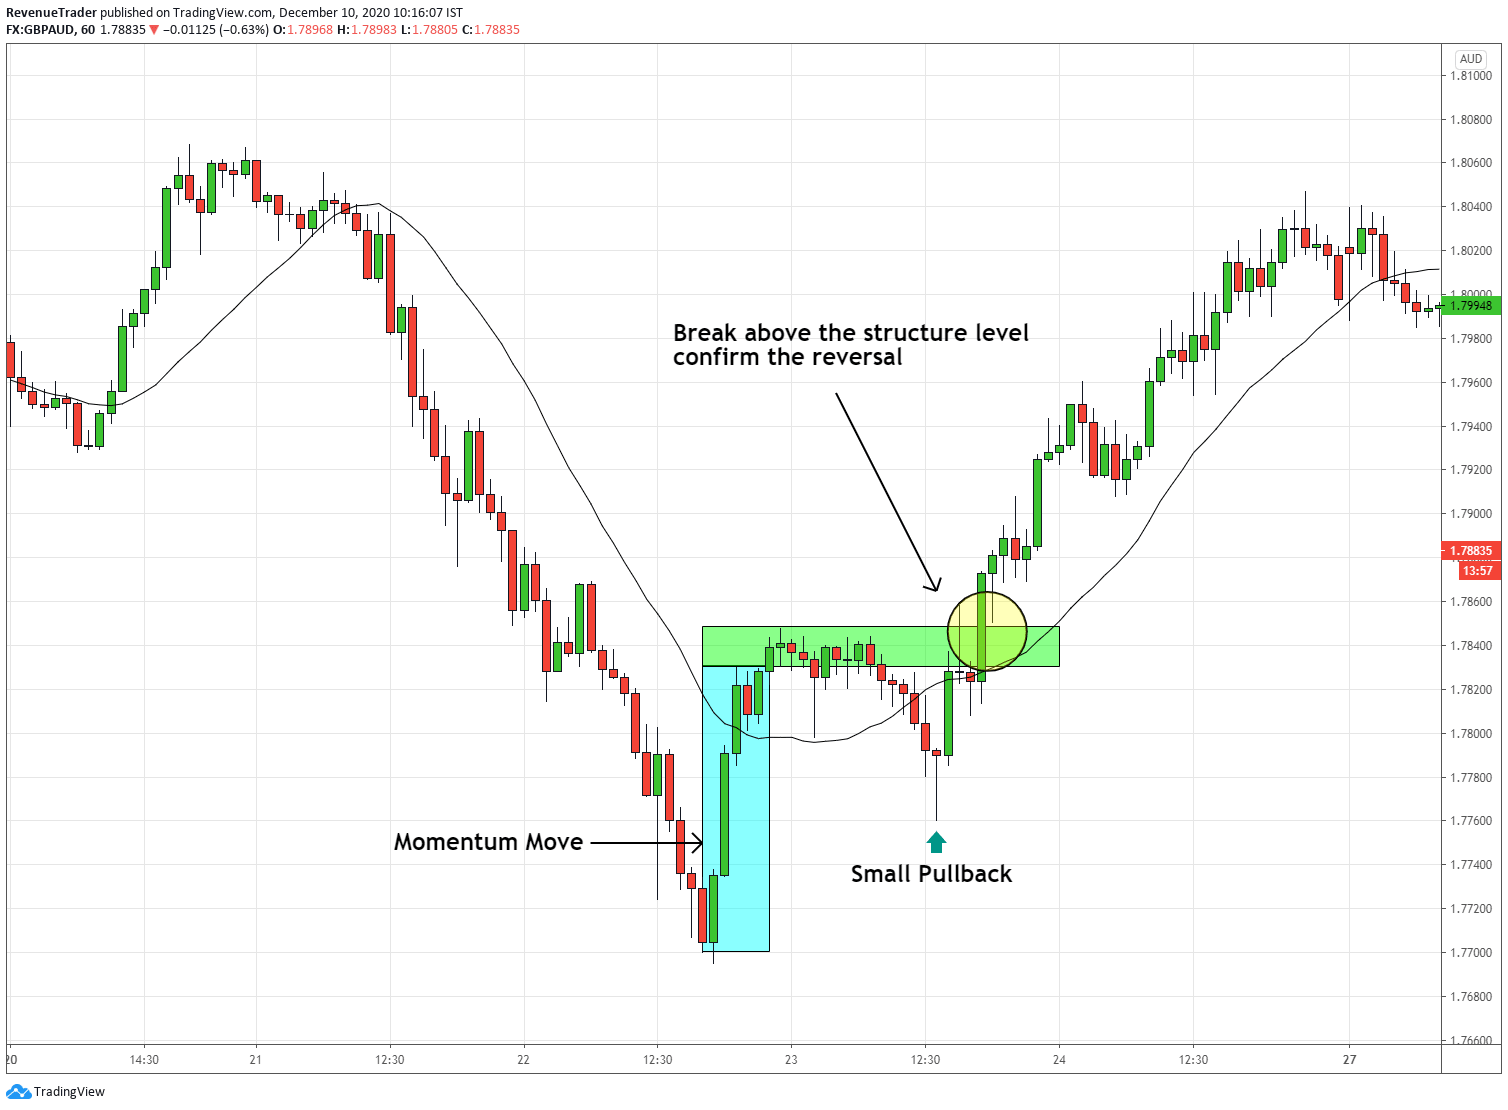
Just like the previous example, after a strong downtrend price started retrace strong (Blue box). This is the Momentum Move.
Then after a small pullback price ended up break above the local structure level indicating the strong bullish momentum.
Finally, as expected price ended up pushing higher strongly.
That’s it these are the 5 Profit Drive Trend Reversal Patterns.
In fact, we trade these reversal patterns with the combination of the first four trading techniques (4 Prove reversal trading techniques) and have been able to extract consistent profits from the market every month.
These trend reversal techniques, together with the reversal patterns we have talked about so far, provide a very strong and highly reliable trend reversal signal.
Not sure…
Apply these techniques and reversal patterns to historical chart data and see for yourself.
Now before wrapping this article, I need to point our few very important things.
Mistake You Should Avoid as a Reversal Trader
Here is the thing:
Trend reversal can be profitable and make huge returns in term of Risk to Reward ratio.
But this is not a holy grail. Just like any other strategies and trading mechanism out there, reversal trading also suffers from loses.
In here we can divide those loses into two categories.
- Legitmetic losers – These are the losing trades that naturally comes from the trading strategy. These are normal as long as you manage your risk and No traders have control over these loses.
- User Generated Losers – These losers happen because of the mistakes done by the traders. Traders have control over these losers and can be avoided by reducing the mistakes.
Now in reversal trading, Legitmetic losers are always present. In fact, the random distributions of winners and losers are all over the forex market. we cannot filter out which one is the loser and the winner.
But User-generated losers – we can easily identify and fix them. We have control over them.
Here are three tips to reduce those kinds of trading losers.
- Never Try to Catch a Falling Knife
- Learn Distinguish the different between retracement and reversal.
- Don’t trade the pattern by itself – always combine it with the other trading confluences
- Don’t wait and watch your trade turn deeper and deeper against your direction. Always find a way to cut loses.
With that, I hope you got the idea about the reversal trading, how to identify a reversal and actually ride the reversal.
Besides these techniques, there are lots of reversal trading techniques are out there that cannot be cover from just one article.
Now it’s your turn. Go ahead and test these strategies and techniques and let me know in the comment section how its work.
Finally, I hope you learned something valuable lesson from this article. If so, show us some love by sharing this article.
If you want to learn more about Forex trading strategies and techniques head over to our Trading Blog.
We put an article about chart analysis every weekend. Find those in the Trade Idea section.


