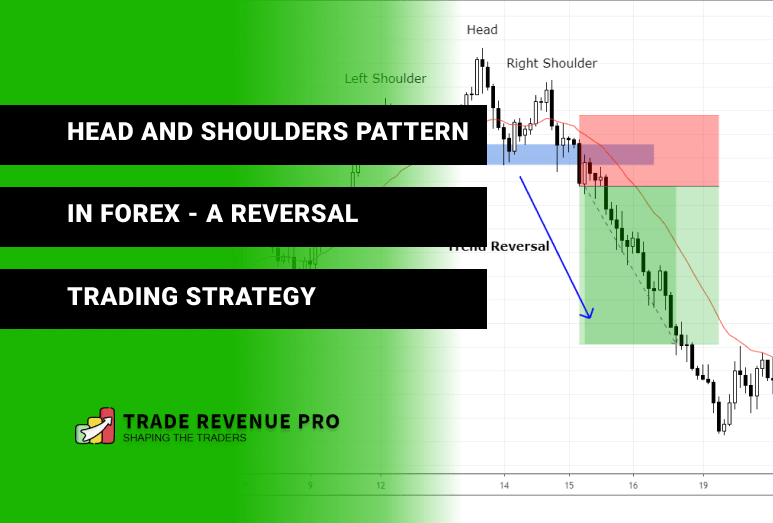
When it comes to chart patterns in forex trading, the Head and Shoulders pattern is the one most reliable and most profit-driven chart pattern in the forex market.
In this blog post, we are not going to talk about the thing like how to identify head and shoulders or characteristics of head and shoulders pattern. (You can find these kinds of articles on google).
But instead from this blog post, you are going learn How to Use Head and Shoulders Pattern to Trade Trend Reversals so That You Can Capture Trend in the Early Stage and Hopefully can make a Good Return like trade below.
Okay, Before making trades like the above let’s get a brief idea about the head and shoulder pattern and how it behaves in the forex market.
What is A Head and Shoulders Pattern?
A head and shoulders pattern is a chart pattern in the forex market that consists of three swing points, two outside swing point with a middle swing.
Normally two outside swings are called left shoulder and right shoulder and the middle one is called as the head which is the highest swing point in the head and shoulders pattern and finally, there is a neckline which works as a baseline for swings.
Have a look at the head and shoulder pattern below.
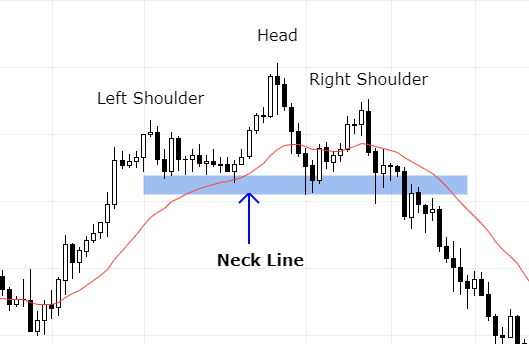
The head and shoulders pattern is a reversal pattern which means as currency traders we are looking to trade this pattern after an extended price move.
Also keep in mind that, to confirm a head and shoulders pattern or to trade this chart pattern, the price must be closed below the neckline.
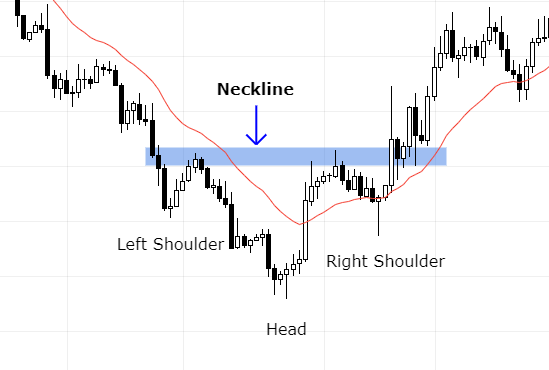
The opposite of this pattern is called the inverse head and shoulders. Inverse head and shoulders pattern mostly occurs when downtrend reverse. Have look at the chart below.
Why the Head and Shoulder Pattern Occur and What is it Telling to Traders?
When reading a forex chart, we come across with a lot of price actions and chart patterns that carried a lot of insight-full market messages and clues.
Some of those clues are easy identified while some of them are hard to interpret.
However, the head and shoulders pattern is easy to spot and making trading decisions based on this chart pattern is easy and objective.
Why the Head and Shoulder Pattern Occurs?
The head and shoulders pattern occurs in an uptrend.
When buyers are losing their control over the market, the head and shoulders pattern occurs. If you spot a scenario like this in an uptrend it is better to prepare for a trend reversal.
Have look at the chart below.
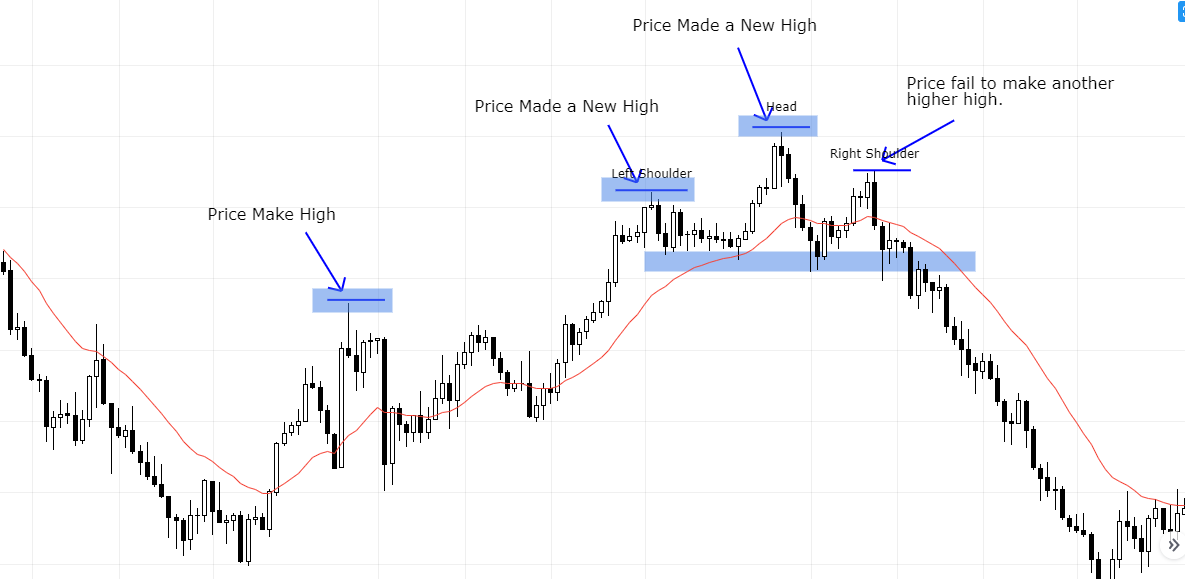
On the left side of the chart, you can see that it is a clear uptrend. Each time the price made new highs and another new high. But after the head instead of creating new high, the price made a lower high and this cause to create a Head and Shoulders pattern in an uptrend.
Hidden Clues Behind the Head and Shoulders Pattern?
Now you know where and when the head and shoulders pattern occurs.
But what is it so special of this chart pattern that turns the trending market into reversals?
Answer – It is not the chart pattern that turns the trending markets into reversals. It the transactions happening in between buyers and sellers. The head and shoulders pattern is just an outcome of that process.
Like this, every chart pattern found in the forex market carried a message.
Let’s take a real forex chart with a real head and shoulders pattern to see what is telling?
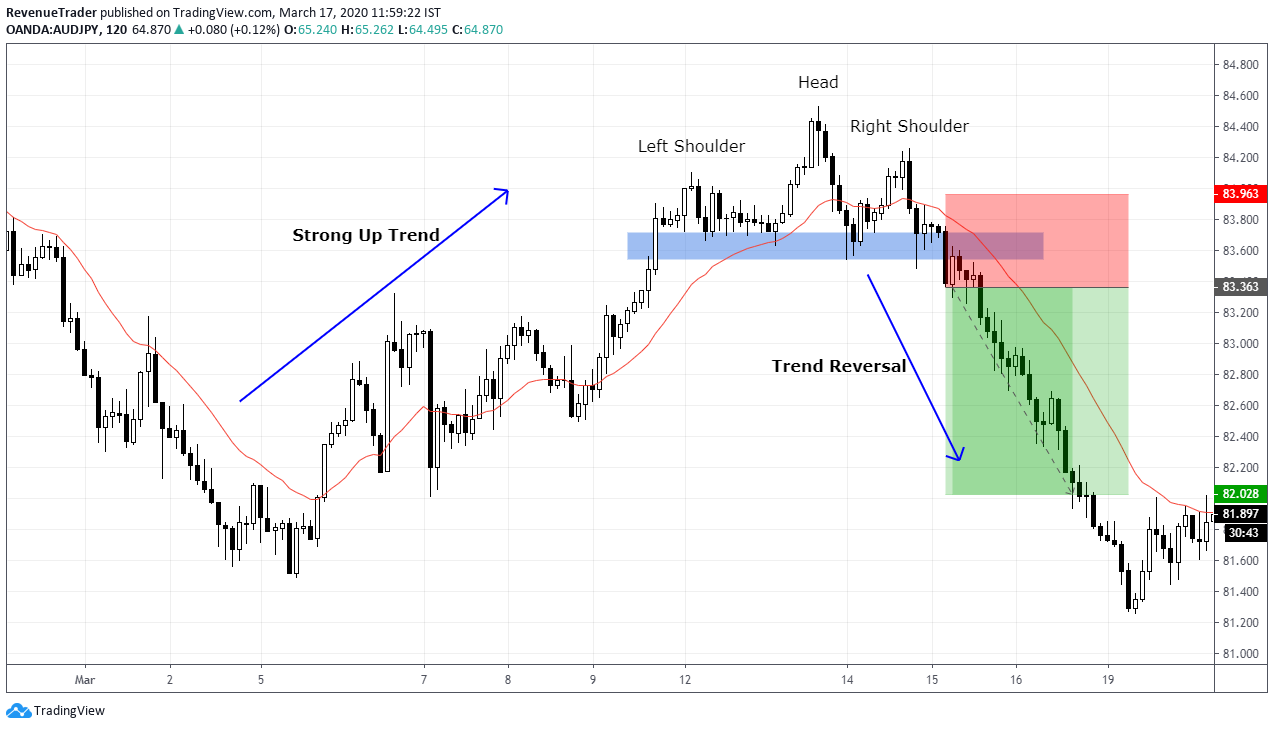
Have look at the AUDJPY Chart below.
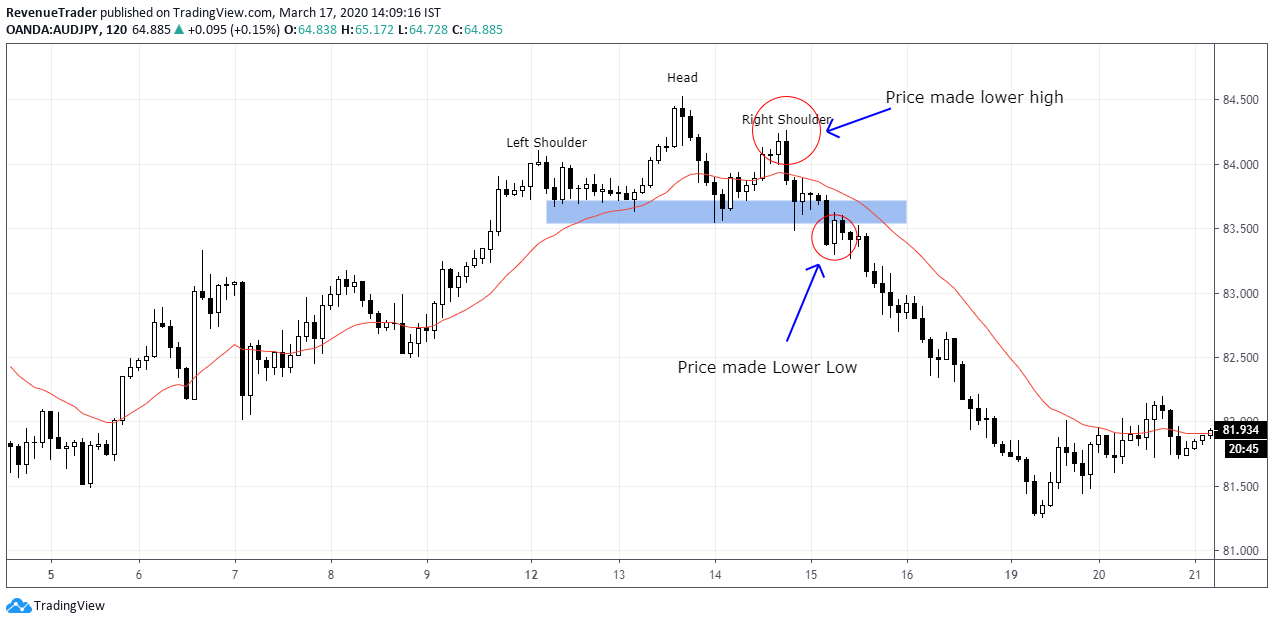
This is the same chart we used earlier. You can see that from left the price was in a strong uptrend until the occurrence of the head and shoulder pattern.
Now, have a look at the right shoulder marked in a red circle.
On this point onward buyers were not able to make new higher highs, instead, price starts to create higher lows and this eventually formed a head and shoulders pattern.
Above phenomenon indicates buyers are losing their control over the market.
Next, have a look at the second red circle. What happened there?
Price broke the neckline. Not only that, but the price also made a new Lower lower as well. This confirms that sellers are now in controlled and a possible trend reversal could happen here.
See it is all about absorbing the hidden clue behind the chart patterns.
The head and shoulder reversal pattern doesn’t work because of the chart pattern itself. It works because of the way buyers and sellers behaved in the up-trending scenario.
Okay, so far you learned about how to spot a head and shoulders pattern and also now you know how to read the hidden story behind the head and shoulder pattern as well.
Now let’s see how to use head and shoulders pattern as a reversal trade entry technique.
This is why you are reading this blog post. Right?
How To Use Head And Shoulders Pattern To Trade Trend Reversals
In the world of forex trading, many traders come across with a lot of chart patterns like double tops and bottoms, triangle patterns and the head and shoulders pattern that we talked so far.
But most traders, especially new forex traders use these chart patterns by itself or in another word, these newbie traders trade these patterns in unfavourable market conditions and eventually, they ended up blaming the patterns without understanding the real reason.
The same principals go for the head and shoulders pattern as well.
If you use this pattern in no man’s lands you cannot get max potential out of this pattern.
Since the head and shoulders pattern has reversal characteristics, we must use this pattern to trade reversals.
So, before we talk about trade entry, stops or take profit. Let’s talk about reversals.
What is a Trend Reversal?
A trend reversal is a change in the price direction of any currency pair.
A trend reversal can occur to the upside or downside. On uptrend, a reversal would be to the downside. on a downtrend, a trend reversal would be to the upside.
Head And Shoulder Pattern As A Trade Entry Technique.
As I said above to get the maximum out of any chart pattern we have to combine it with the right market conditions.
For the head and shoulders pattern, we are focusing on the reversals of ongoing trends which mean to trade the head and shoulders pattern our first criteria should be a trending market.
In this article, we are going to talk about two trade entry techniques, that helps to get favourable reward to risk ratio regardless of the market conditions.
The first one is,
Trade Entry Technique One – Strong Breakout of the Neckline.
As we already know, we only trade the head and shoulders pattern after price break below the neckline. That is our entry trigger.
Sometimes the price breaks the neckline with greater momentum. In scenarios like this, we can directly place our trade orders. because we know that the market momentum in our favour.
Let’s take an example to see how this work. Have a look at the AUDJPY 2-hour chart below.
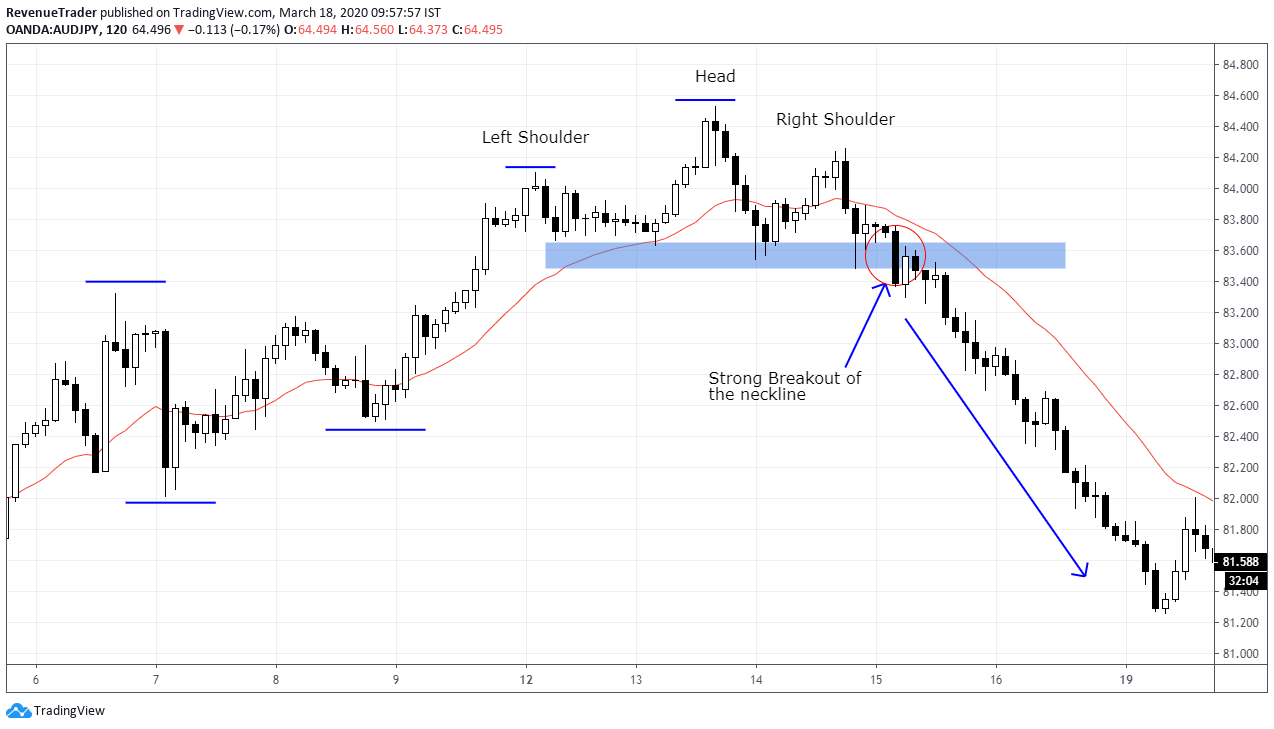
If you look to the left first we can see that AUDJPY was in a nice uptrend for quite some times.
Then the occurrence of the head and shoulders patterns indicate the weaknesses of the ongoing uptrend.
Based on the above clues, we can expect a trend rotation or trend reversal here in AUDJPY.
But the question is when and how to enter the trade? In forex terminology, we called it as trade timing.
In this scenario, we are looking to place a sell order if price broke below the neckline very strongly which mean we only place our trade if price broke below the neckline strongly.
Have a look at the red circle marked in the AUDJPY chart above. That is a strong breakout of the neckline and breakouts like this indicate the aggressiveness of sellers.
Placing sell order here would be a good idea to catch the bearish move pretty earlier.
Let’s take another trade example to clarify this first trade entry technique before moving into the second trade entry technique.
Have a look the EURUSD 4-Hour forex chart below,
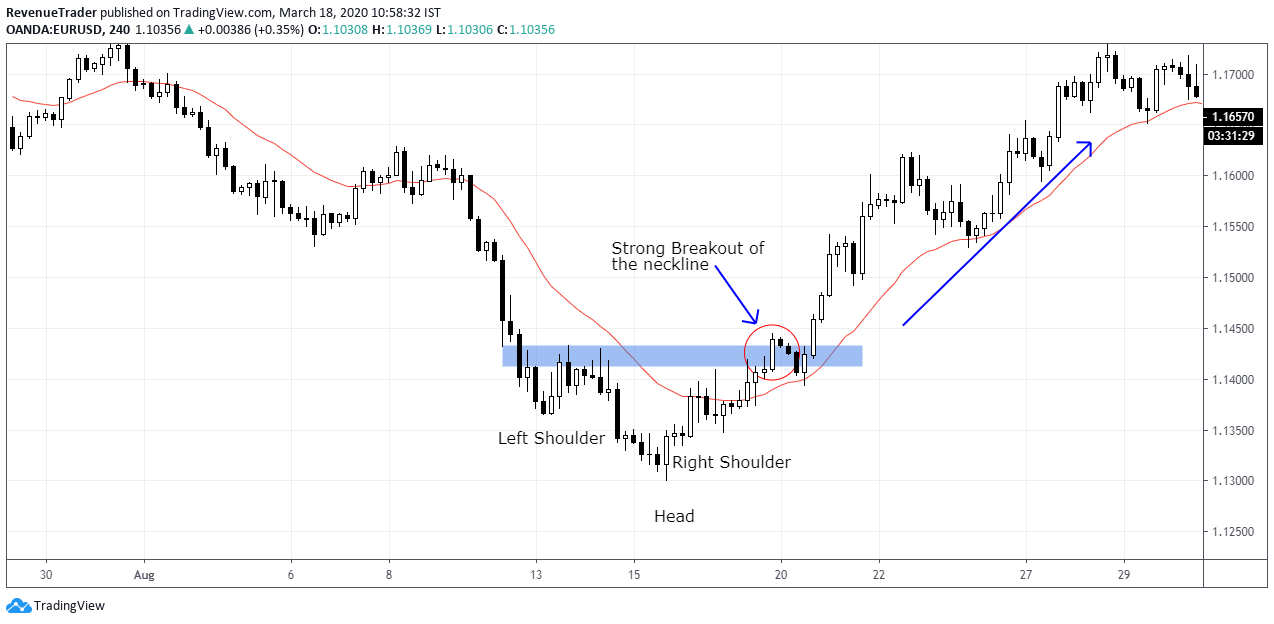
Like the previous example, EURUSD was in a trending condition for some time. but this time, it is a downtrend.
The occurrence of the inverse head and shoulders pattern indicate the weaknesses of the downtrend.
Since we have head and shoulders pattern align with the right market conditions, now it is a good time to looking for a reversal trade.
According to the EURUSD 4-Hour chart above, We can see that price broke above the neckline strongly (red circle marked in the chart) which indicate buying pressure.
What happened after the breakout?
EURUSD turn into a strong uptrend. See, if you were long after strong breakout then you would have been banked good profit. Right.
As you guys saw a strong break of the neckline often provide us with good reversal trading opportunities.
But what to do if the breakout of the neckline is not strong or not clear?
This is where the second trade entry technique come in to play.
Trade Entry Technique Two – Break and Retest
Forex market filled with a lot of uncertainties hence we can’t spot strong breakouts of the neckline every time.
Some breakouts are not cleared or not strong enough to enter a trade right away.
When scenarios like this arise Break and Retest Trade entry techniques come in very handy.
What is the break and retest trade entry technique?
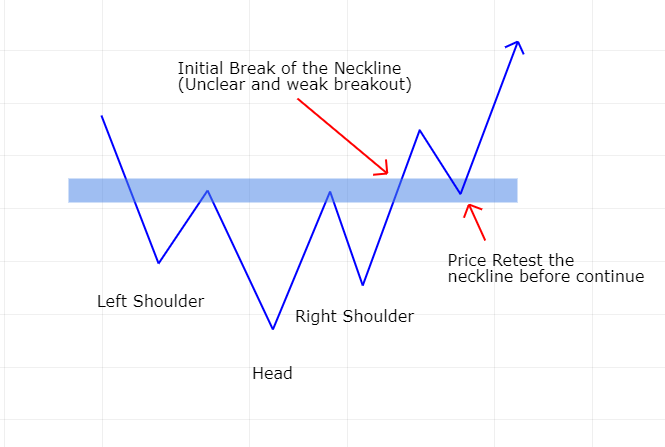
Simply we wait for a break of the neckline and then wait for the price to push back to the neckline and retest it.
When it retesting the neckline, we are looking to place a trade based on the trending scenario.
To understand this concept have a look at the sketch below.
Now let’s take a real example to see break and retest pattern in action.
Have a look at the EURUSD 4-Hour forex chart below.
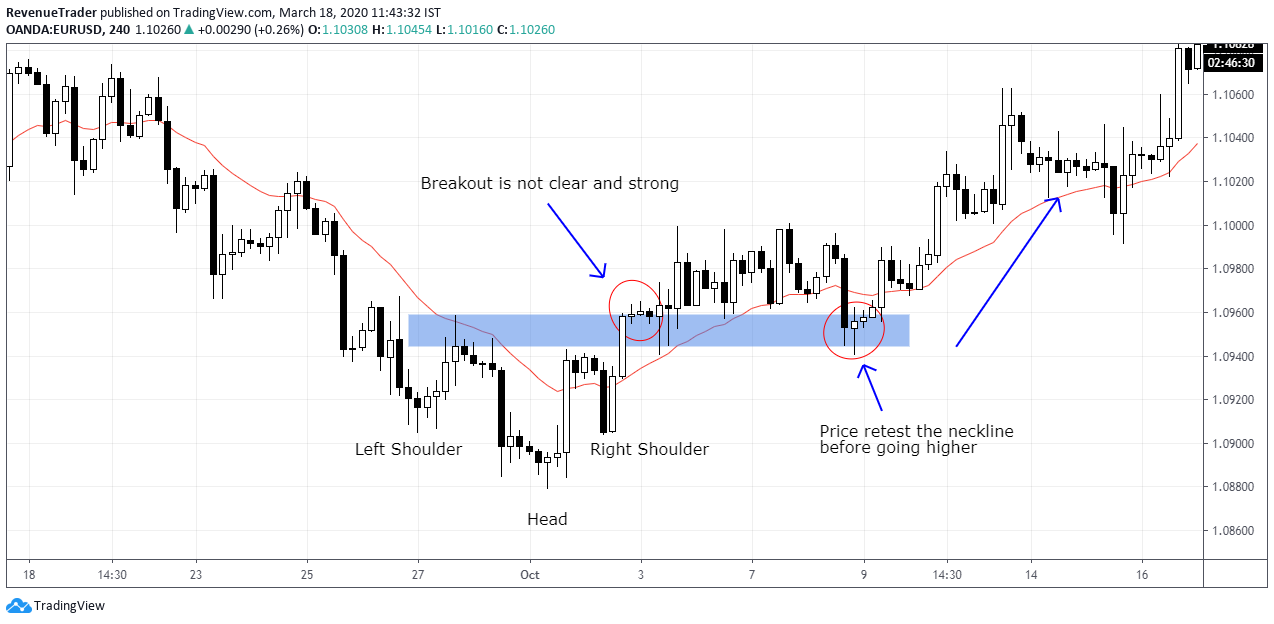
At glance, we can see that EURUSD was in a downtrend for some time and then the occurrence of the head and shoulders pattern indicate the weaknesses of the ongoing downtrend.
To execute a buy trade all we need is a strong break above the neckline.
But what happened at this time? breakout is not clear, right?
Because of that, we have to wait for a retest of the neckline to confirm the breakout.
In the above EURUSD chart, we can see that the initial breakout is not clear hence we wait for a retest of the neckline (seconde red circle).
Like that you can re-enter a reversal trade using break and retest pattern if you get an unclear break of the neckline.
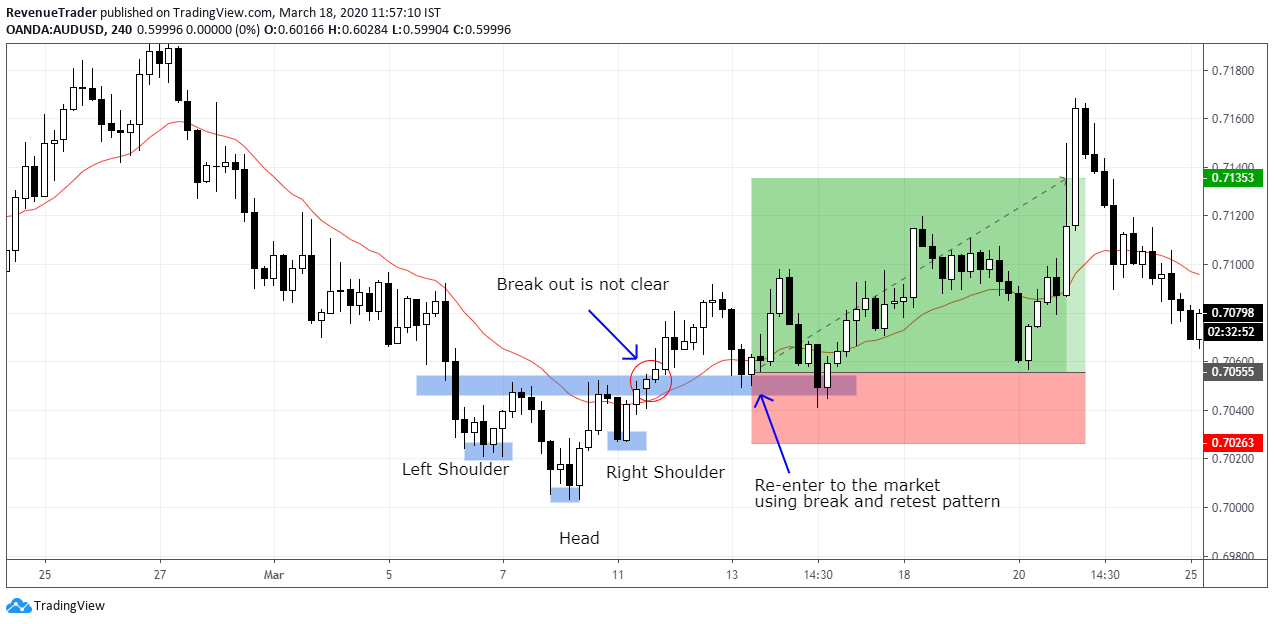
Now have look at the reversal trade I execute using this break and restest entry technique.
Okay, now you are familiar with two trade entry technique that used to enter a reversal trade using head and shoulders patterns.
- A strong break of the neckline, and
- Break and Retest of the neckline.
Next, let’s talk about how to place stop loss when trading head and shoulders with trend reversals.
Stop-Loss Placement
Traders are risk-takers, right?
Hence managing your risk is very important if you truly want to become a consistency profitable forex trader.
So, how to place stop loss when trading head and shoulders pattern?
It is easy. We can use the recent market structure as a guide to place a stop-loss.
Use Structure Level To Place A Stop-loss
First, what is the structure level?
Structure level is simply support and resistance or previous swing point in a forex chart.
Or structure levels are levels on any forex chart that attract the most attention. Which mean these levels are often lead to price bounces, therefore, placing a stop-loss order few pips above or below (Based on the scenario) is a good idea to limit your downside.
Let’s take an example of head and shoulders reversal trade to see how place stop loss.
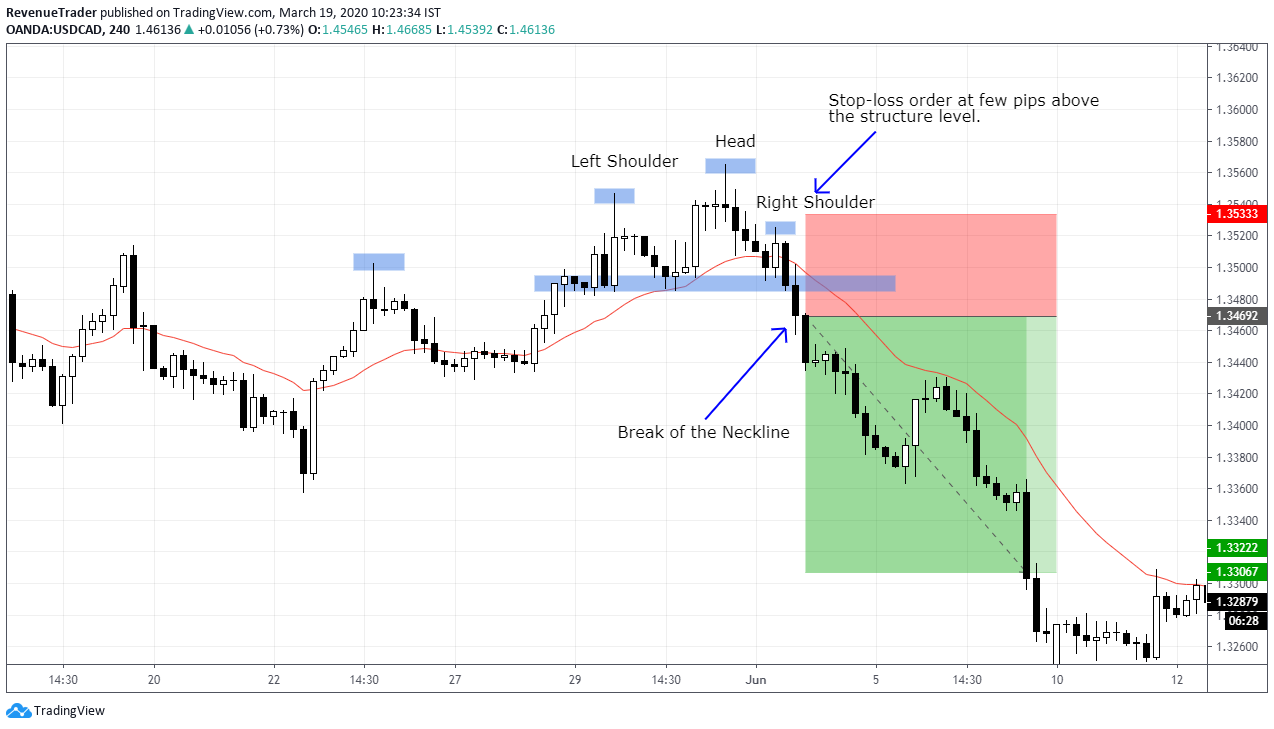
According to the USDCAD 4-Hour chart above, we can see that the head and shoulders pattern indicate the weaknesses of the ongoing uptrend and after the break of neckline we can confirm the trend reversal.
Now, to place our stop-loss order we need to find a previous market structure, right?
In this case, the right shoulder is recent structure level, therefore placing stop-loss order a few pips above the right shoulder is the most secure option here. (Have a look at the above chart)
See, after identifying the most recent structure level, It is a matter of placing the stop-loss order. That it.
But, what if we can’t find a structure level,
Or, If we struggle to get favourable reward to risk ratio by choosing to place stop-loss orders using structure level.
This is where 21-EMA comes into play.
Approach Two – Use 21-EMA To Place A Stop-loss
Have a look at the USDCAD 4-Hour chart below,
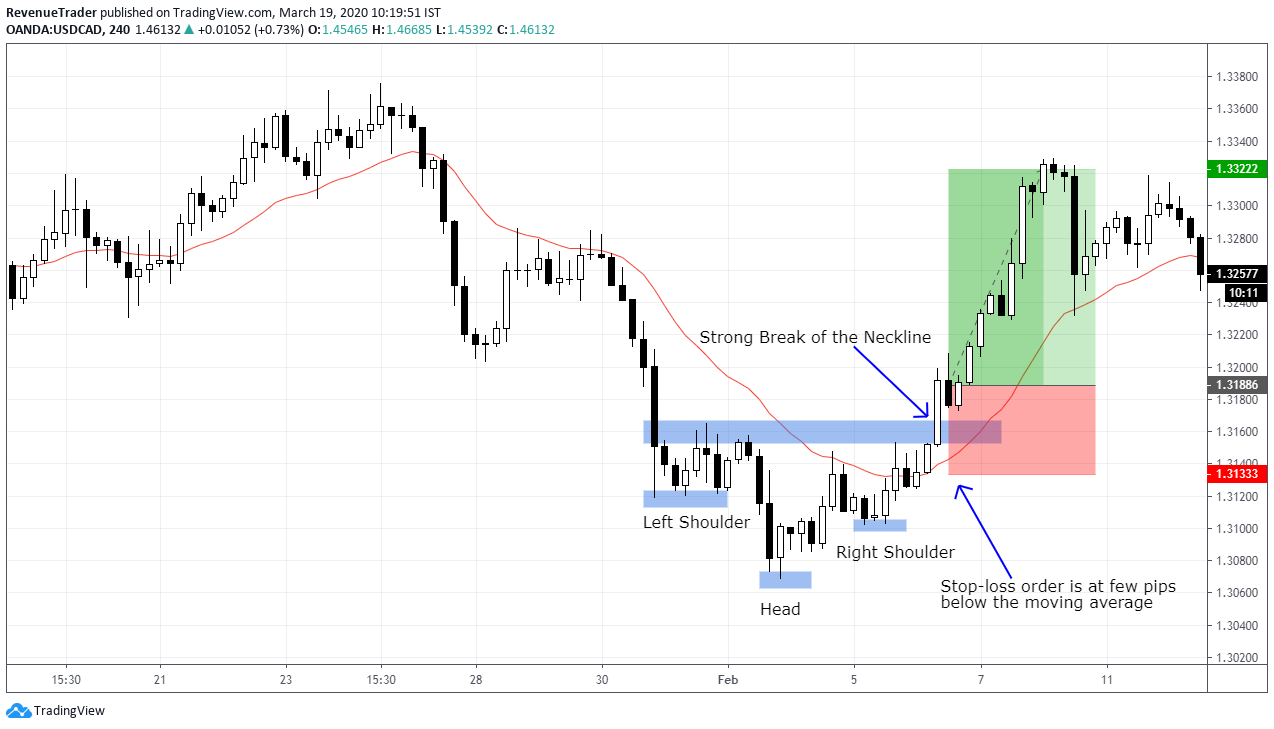
Again the same concept repeats but in the opposite direction.
Have a look at the strong break of the neckline. That breakout candle is very strong and closed too far aware from the neckline.
If we look at this situation in risk to reward ratio perspective, placing a stop-loss order at the structure level (like we did before) is not a good idea, right?
Therefore, we can go for the second option which is using the moving average to place out stop loss.
According to the above chart, we placed of stop-loss order a few pips below the 21-period exponential moving average (look at the above chart) which is a secure place to cut our losses. Not only that by using this approach we were able to get a favourable risk to reward ratio as well.
See placing the stop-loss order is not a big deal.
But finding a secure market level to place your stop while minding risk to reward ratio is the hardest part and this is the part you need get right in order to get a good profitable trade.
Up to this point, you know when to enter the trade and where to place to stop-loss orders.
But there is one missing in this trading puzzle. Any guesses?
Yeah! It take-profit.
How to Place Take Profit for Head and Shoulder Pattern
This is the easier part in head and shoulders reversal trading strategy.
You just have to place your take-profit order at the recent structure level. But there is one rule and an important one.
When placing take-profit orders you should have at least 1 to 2 Risk: Reward ratio (your reward should be twice as the risk) otherwise your this trading strategy will underperform over the long run.
Have a look at the trade example below.
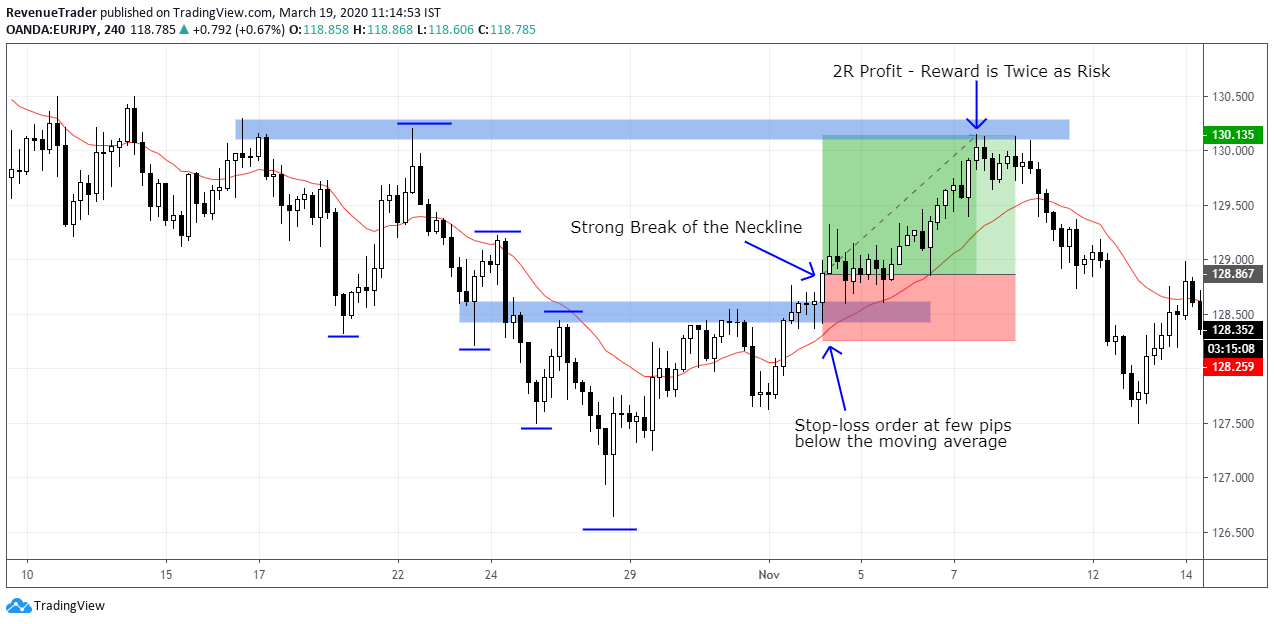
According to the above chart, It is inverse head and shoulders pattern that formed at the end of the downtrend.
Just like the previous examples, we enter the market as price strongly break above the neckline and placed stop-loss few pips below the 21-EMA.
For take-profits, we use recent structure level. In this case, it is the resistance level (horizontal blue zone marked in the chart) that tested twice previously.
Not only by closing our trade on that resistance level we were able to get a favourable risk to reward ratio for our trade as well.
Learn risk to reward ratio from here.
Okay, that is it. Now you know how to trade trend reversals by utilizing head and shoulders pattern.
But there is one important thing you should know.
This Pattern Don’t Work by Itself. You should combine other technical factors with head and shoulders pattern to get the results that you are hoping right now.
What is that mean?
Don’t Trade Head And Shoulder Pattern By Itself.
Forex trading is all about finding quality trade setups and eliminates the other setups. This way you can get high probability trade setups that will promise gains.
By combining head and shoulders patterns with other technical confluences you can get profitable and quality trades that help you achieve consistency gain over time.
So, How to do this? Have a look at the trade example below.
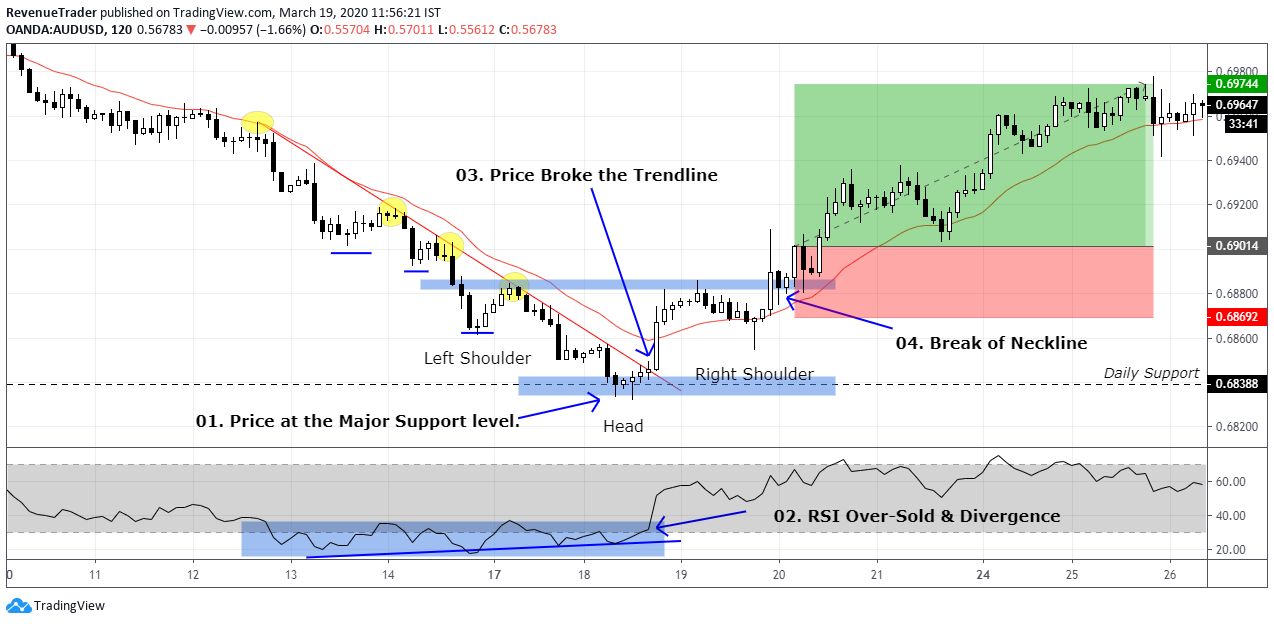
According to the above chart,
First, you can see that price is at Daily support level which is a good trade level to look for any buy setups.
Second, have a look at the RSI Divergence. It indicates the weaknesses of the ongoing downtrend at the daily support.
And then, Break of the downtrend line indicates the buying pressure at daily support.
With all that conflucence in hand, the price finally broke through the neckline of the inverse head and shoulders pattern.
So, based on the above confluences, we can confidently set buy order as price broke the neckline of the head and shoulders.
See, by combining head and shoulders pattern with other technical tools you can get a higher probability trade setup.
Since all the technical confluences are aligned with your trade setup, you also get extra confident to trade this pattern as well.
So what do you think about this reversal head and shoulders trading strategy?
Are you going to implement these trading techniques to your trading plan? Let me know in the comment section.
Finally
Just like this trading strategy or chart pattern, there are a vast amount of trading strategies can be found on the internet.
But are you going trade those strategies right away? If yes. You going ruin your trading account for surely.
Then what you have to do?
Backtest is to check whether it is going to work or not and also check whether the trading strategy you found on google are matching with your personality or not.
If any trading strategy works for someone else, it doesn’t mean that it also going to work with you.
Trading is all about finding your trading edge over the market. Therefore stop jumping from one strategy to another. Focus on the strategy that you are trading right now and find ways to improve it.
If you like the trading techniques we talked in this article feel free to implement these techniques for your trading plan.
But before that please backtest using historical price data to check whether these trading techniques are going to work for you or not for you.
General FAQ
A head and shoulders pattern is a chart formation in the forex market that consists of three swing points, two outside swing point with a middle swing.
Normally outside swings are called left shoulder and right shoulder and the middle one is called as the head which is the highest swing point in the head and shoulders pattern and, there is a neckline which works as a support for all three swings.
Head and Shoulder pattern has Reversal characteristic. Therefore using it to catch trend reversal with combining other technical analysis tools provides high probability trade entry signals more often.
In an uptrend break of the neckline indicate the weaknesses on ongoing trend. Oppositely when the market is in a downtrend break above the neckline indicate bearish to bullish trend rotation.
Yes technically you can but this is the fastest way to blow your trading account as well. Since head and shoulders pattern has reversal characteristic it is more profitable to trade this pattern in a trend reversal conditions.


