In forex trading, Different indicators help us to see the current market condition in different perspectives. Take RSI indicator for an example, It helps traders to evaluate the strength of the price action in a particular currency pair by providing RSI divergence and overbought/oversold signals.
RSI divergence is a very effective trade signal especially when it comes to identifying trend reversal and trading around key levels.
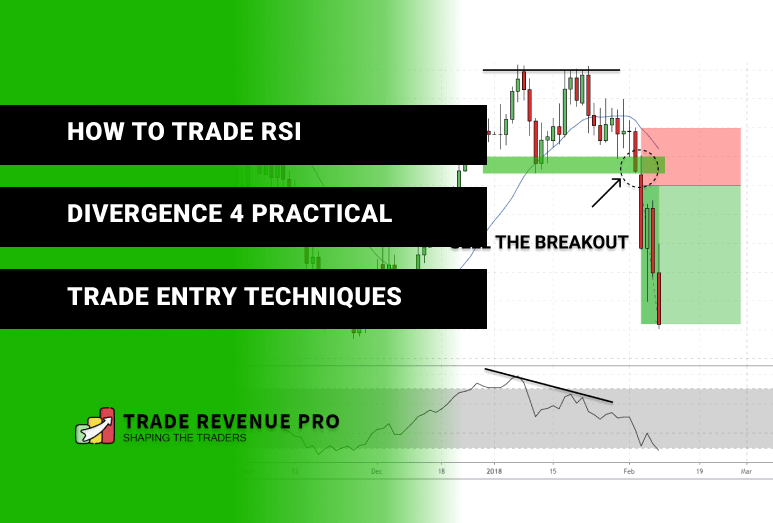
In this article, we are going to talk about How to Trade RSI Divergence Profitably by combining it with trend reversal chart pattern.
First of all, let’s see what is RSI Divergence is and then we are going to talk about 4 practical and highly profitable trade entry techniques to use with RSI Divergence.
I highly recommend you to read our Ultimate Guide to The RSI Indicator, if you are not familiar with the RSI much. As a bonus, I will share a few reversal trade setups which use RSI divergence.
What is RSI Divergence?
Okay, Let’s start with the most obvious question and explore what is RSI Divergence is and what trading clues we can get from it.
A Divergence occurs on your chart when the price action and RSI indicator are out of the sync. Which mean, in a Downtrend market, Price makes a Lower low But the RSI indicator makes higher lows.
Basically, a divergence form when the indicator does not agree with the price action and when a situation like this arises, you should pay attention to the market. Have a look at the chart below which explain RSI divergence.
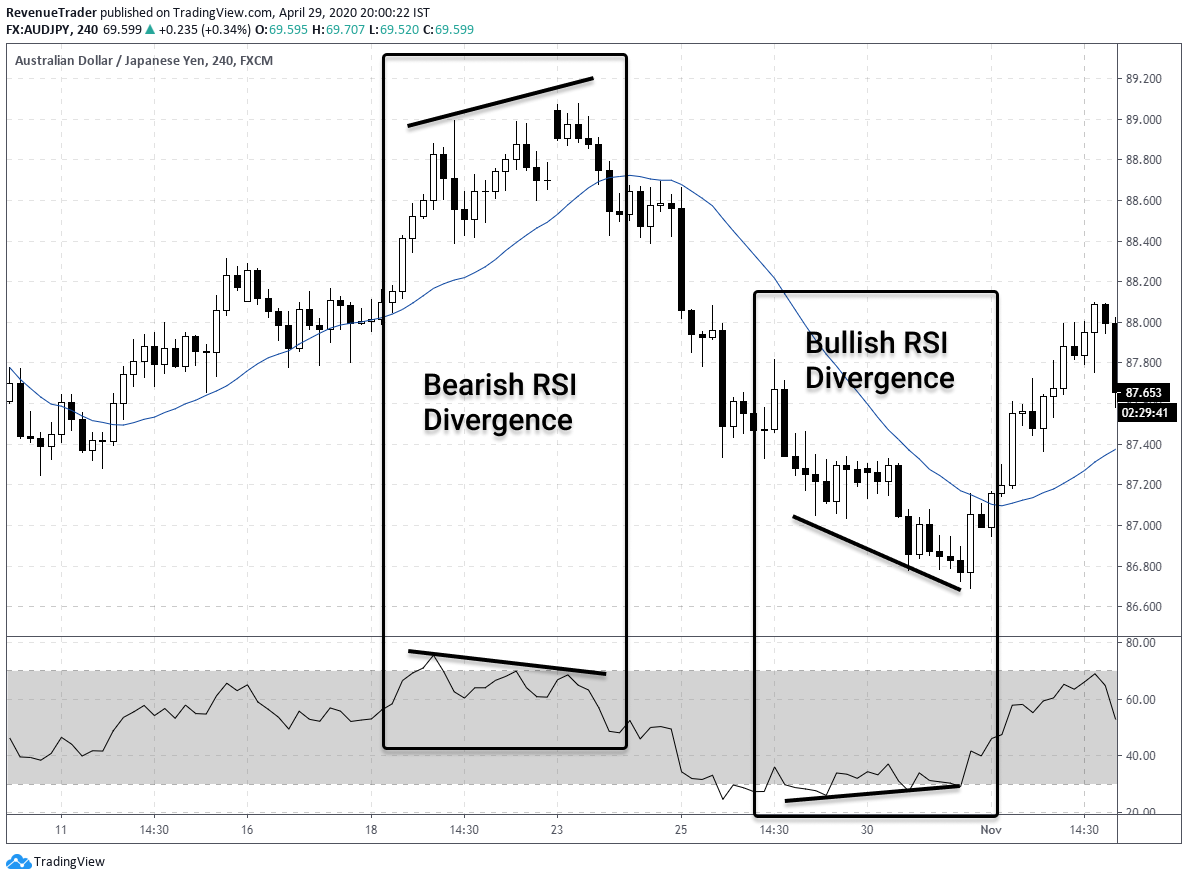
According to the above chart, both bullish RSI divergence and the bearish RSI divergence are clear and, the price action actually reversed after both RSI Divergence signals, right?
Now, let’s talk about one last topic before move into the exciting topic.
How to Analyze RSI Divergence?
Since we are using the RSI indicator for identifying trend reversals, It is very important to identify the right trend reversal, to do that, first we need to have a trending market, then we use RSI divergence to identify weaknesses of the current trend and then we can use that information to catch the trend reversal at the right time.
Have a look at the forex chart below,
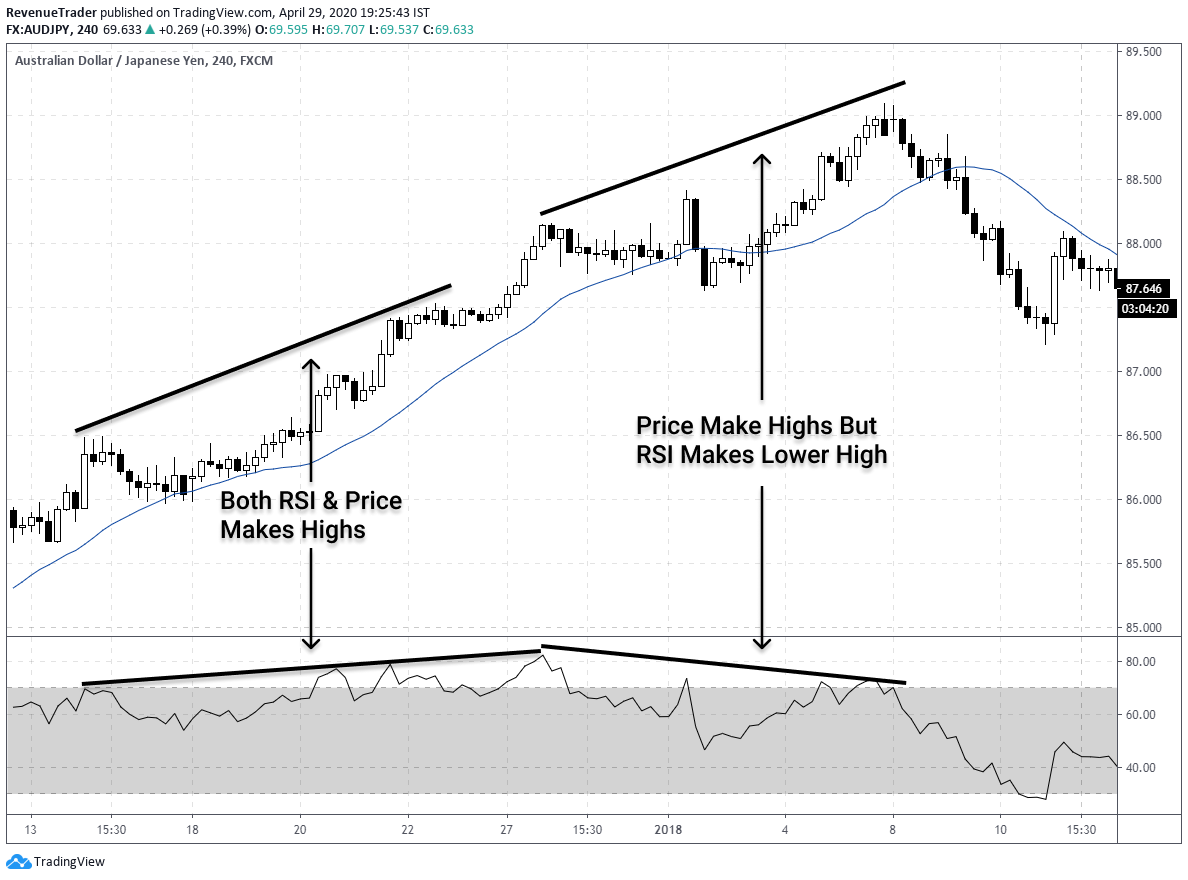
At the beginning of the uptrend, both RSI indicator and Price Action did the same thing by forming higher highs. This typically indicates that the trend is strong.
But at the end of the trend, Price makes higher highs but the RSI indicator formed lower highs which indicate there is something worth watching in this chart.
This is where we need to pay attention to the market, because both the indicator and price action are out of sync, which means an RSI divergence, right?
In this case, the RSI divergence indicates bearish trend rotation. Have a look at the chart above and observe what happened after the RSI divergence.
See, the RSI divergence is very accurate when it comes to identifying trend reversals. But the question is, How to actually catch the trend reversal, right?
Well, Let’s talk about 4 practical trade entry techniques that provide higher probability entry signals when combined with RSI divergence.
Trade Entry Technique #1 – Combining RSI Divergence with the Head and Shoulders Pattern
RSI divergence helps forex traders to identify market reversals, right?
So what if we combined RSI divergence with other reversal factors like the Head and shoulders pattern, we can increase the probability of our trade, That is great, right?
Now let’s see how to time our trades by combining RSI divergence with the head and shoulders pattern.
Related – How to Trade Head and Shoulders Pattern in Forex – A Reversal Trading Strategy.
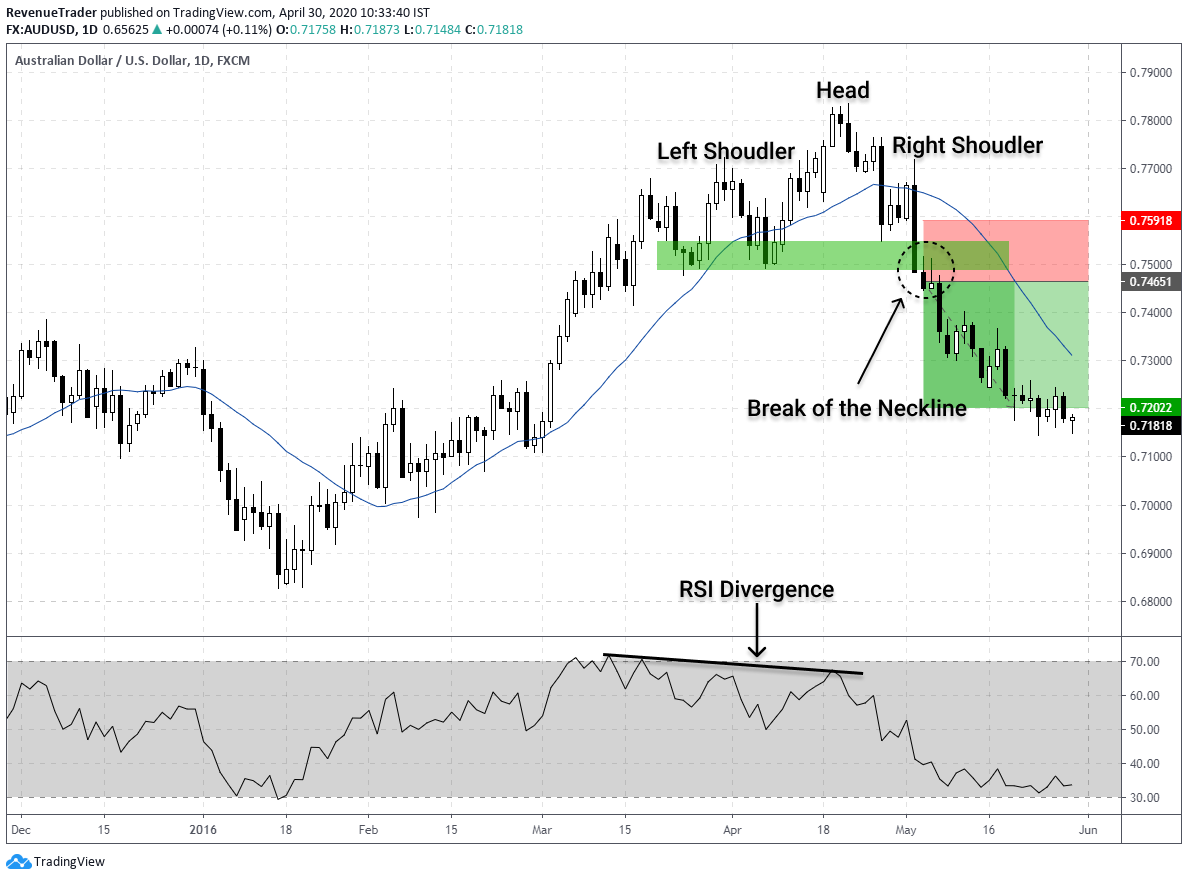
Before thinking about trade entry, we need to have a favourable market condition. Since we are looking for a trend reversal, It is better to have a trending market. Have a look at the chart below.
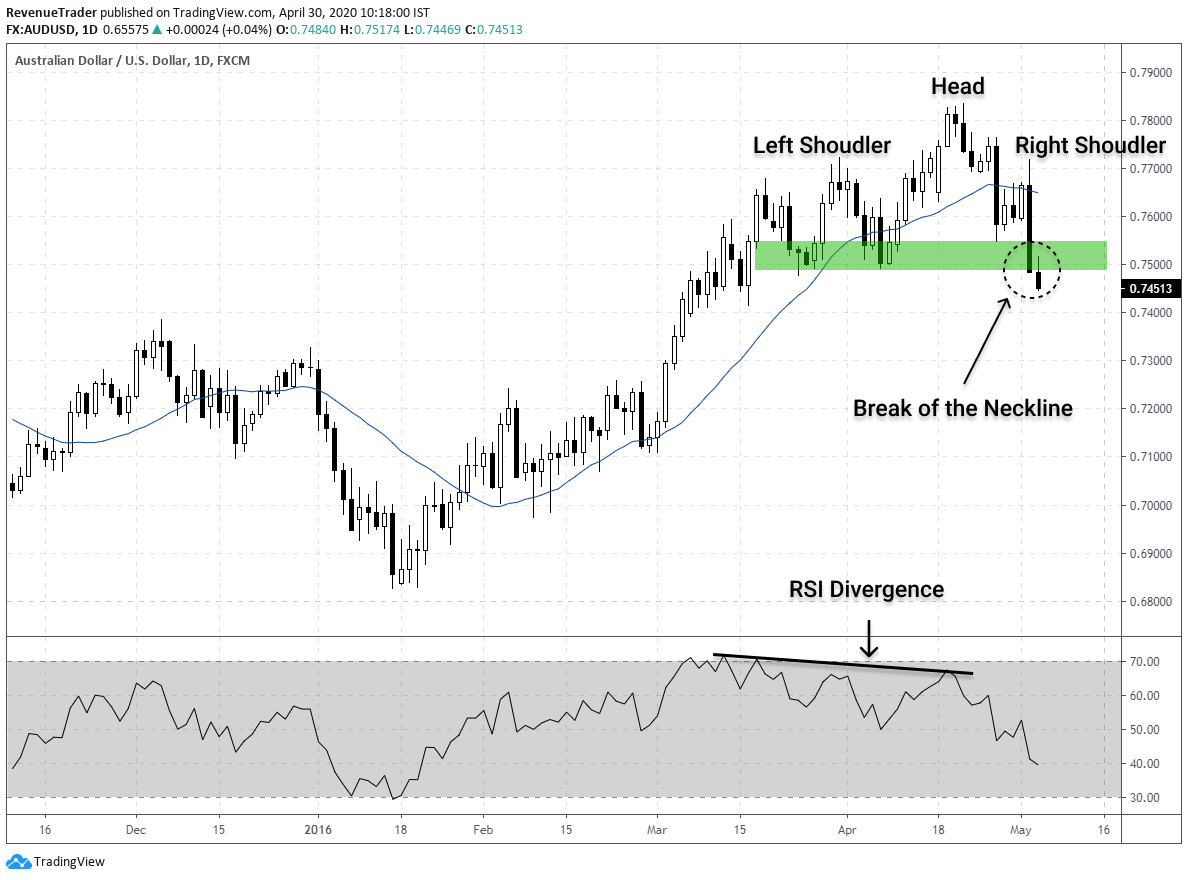
According to the above chart, you can see that the market was in a strong uptrend but right now the price action starts to slow down. Have a look at the RSI divergence marked in the chart above, this indicate weaknesses of this uptrend.
Now we confirmed the weakness of this uptrend. Now all the technical factors are aligned. But the question is where to place our sell orders?
This is where the head and shoulders pattern marked in the chart above comes into play. Head and shoulders pattern has reversal characteristic hence combining it with the RSI divergence is a great way to improve odds in our favours.
In this case, we used the break of the neckline as our entry trigger. Have a look at the chart below to see what happened after the breakout.
Now let’s move into the second trade entry technique and see how to trade RSI divergence with the triangle pattern.
Trade Entry Technique #2 – Combining RSI Divergence with the Triangle Pattern
Triangle chart pattern comes with two variations, One is Ascending triangle pattern which is works as a reversal pattern in a downtrend.
The second one is the descending triangle pattern which acts as a reversal pattern in an uptrend market.
Now, Have a look at the descending triangle pattern marked in the forex chart below.
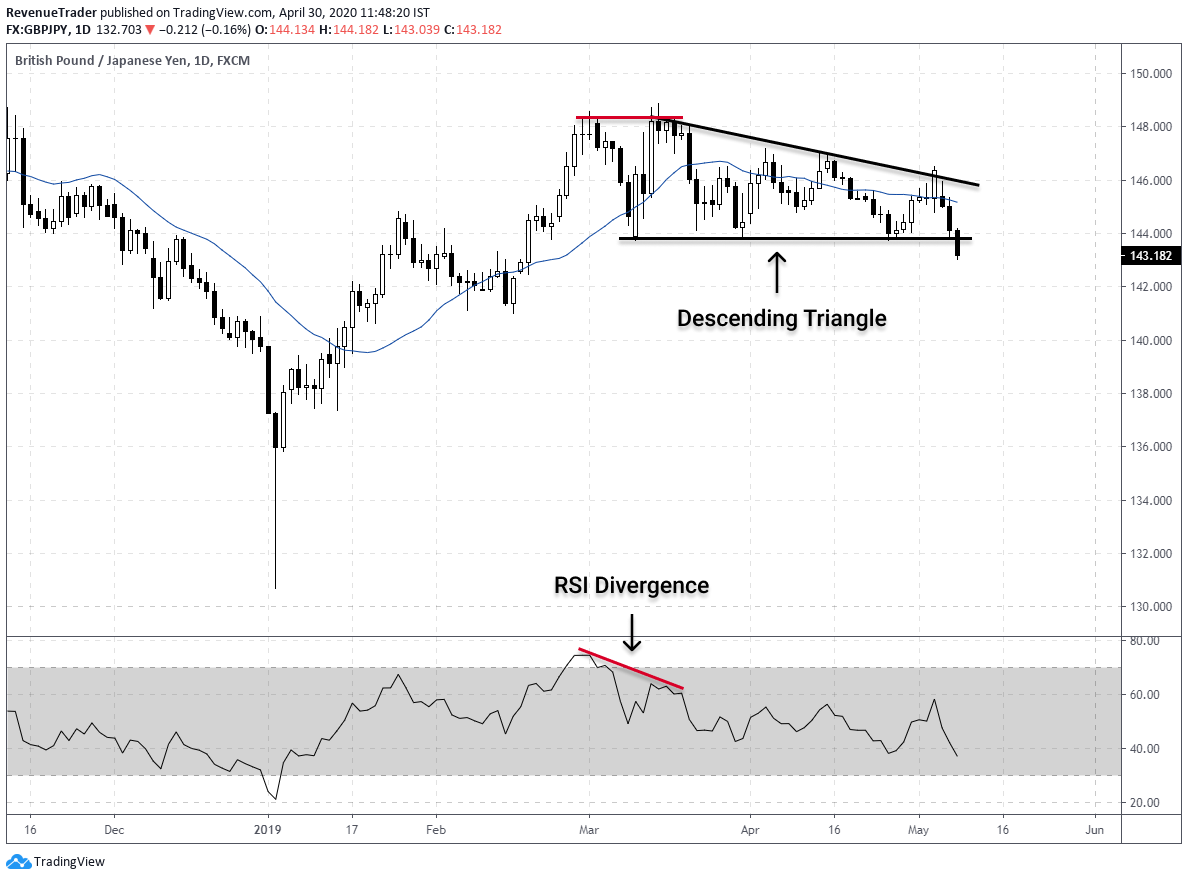
Just like the previous example, the market was in an uptrend and eventually the price start to slow down. At the same time, RSI also signals the divergence. These clues indicate the weaknesses of this uptrend.
Now we know that the ongoing uptrend is losing momentum and result of that the price ended up forming a descending triangle pattern. This even confirms the reversal. Now it is time to execute the short trade.
Just like the previous example, we used the same breakout techniques for this trade as well. Below chart explain how the trade workout after the entry.
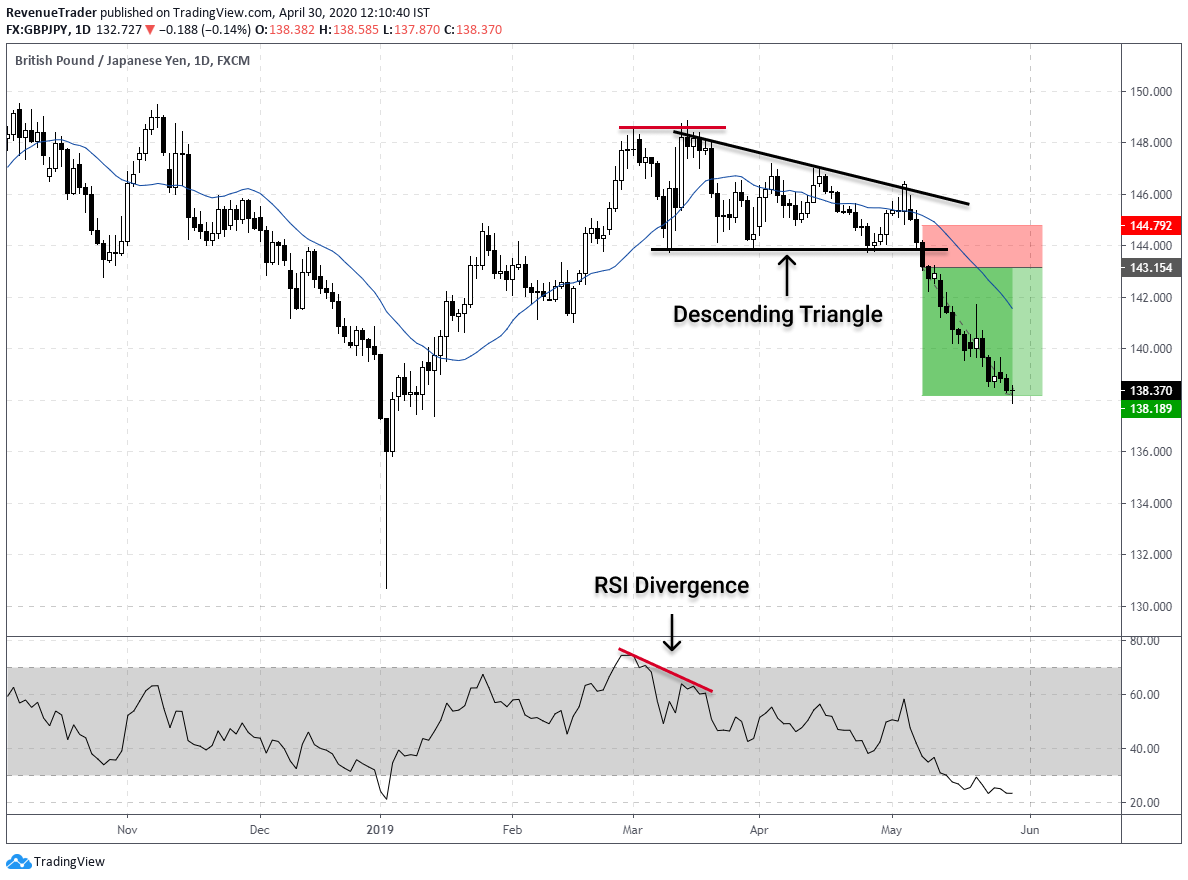
We wait for a break below the descending the triangle and then place the sell order. As you can see pairing RSI divergence with chart patterns resulted in high profitable trades.
Related – Forex Trade Entry Techniques: Learn How to Execute Trades Right Way
Now let’s move into the third trade entry technique. This time we are going to pair trend structure with RSI divergence. Let’s see how to trade RSI divergence when the trend structure is changing.
Trade Entry Technique #3 – Combining RSI Divergence with the Trend Structure
The trend is our friend, right? As long as the market is trending, we need to trade in the direction of the trend. This is how professionals teach us. But the trend is not going forever, at some point it is going to reverse, right?
So let’s see how to identify those reversals in early by observing trend structure and RSI Divergence.
We all know that uptrend is forming higher high while the downtrend is forming lower lows. Now with that in mind have a look at the chart below.
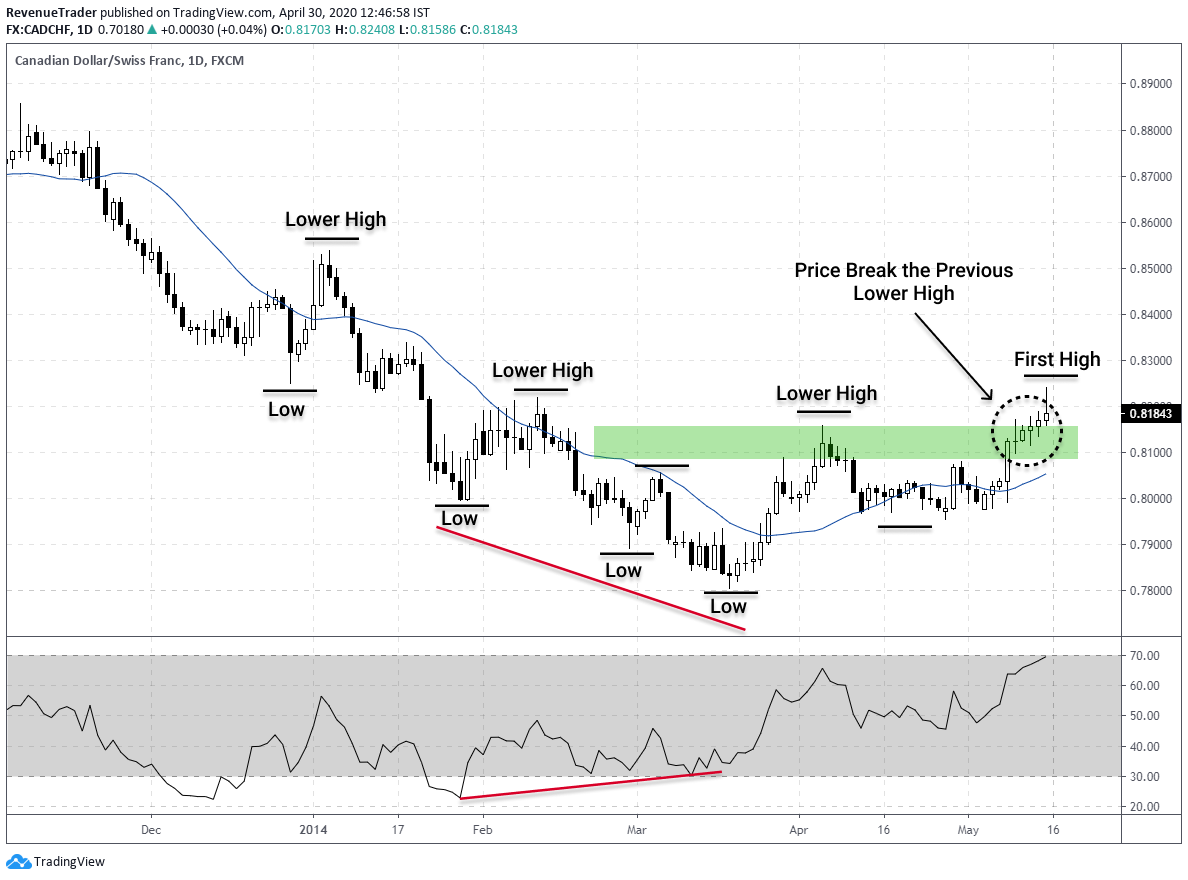
Okay, let’s breakdown this chart step by step.
Now if you look to the left of this chart, you can see that it is a downtrend with a series of lows and lower highs.
Next, have a look at the RSI divergence marked in the chart (Red Line). Price action creates Lows but the RSI create higher lows, right?
What does this indicate? Even though the market creates low the RSI is doing the opposite thing this indicates ongoing downtrend is losing its momentum and we should prepare for a reversal.
Have a look at the black circle marked in the chart, What happened there? Price broke the previous Lower high and start to create the first high. This indicates that the ongoing downtrend is no longer valid.
Now all the technical factor are aligning nicely. Let’s see how to place buy orders. Have a look at the chart below.
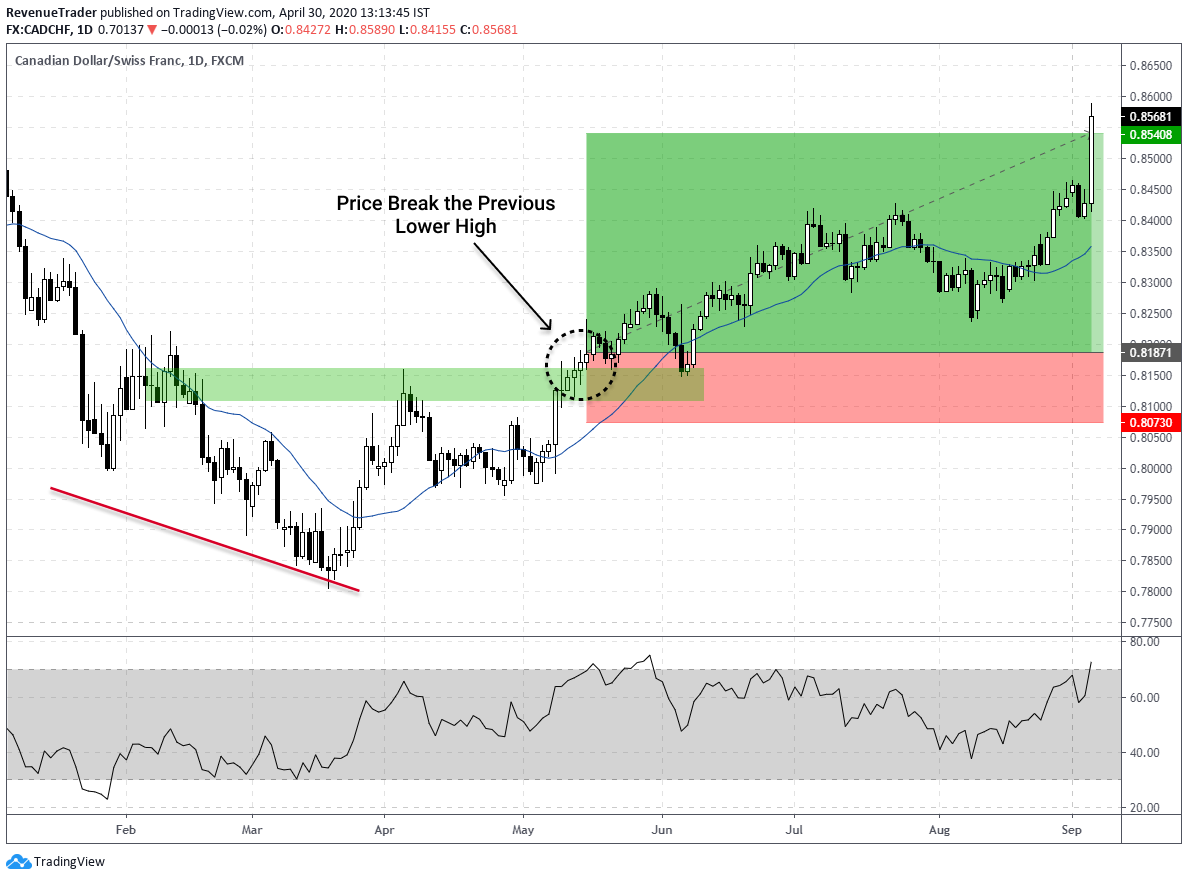
As price broke above the previous Lower high, we execute a buy trade by placing stop-loss few pips below the structure level (Geen zone). As you guys can see this trade works really well.
Now let’s move into the final entry technique which is double top and bottom. Just like the head and shoulders pattern double top and bottom also has the reversal characteristic.
Okay, Let’s see how to trade RSI divergence with double top and bottom.
Trade Entry Technique #4 – Combining RSI Divergence with the Double Top and Double Bottom
Double top or double bottom is a reversal pattern that is formed after an extended move or after a trend.
In the double top, the first top is formed when the price hits a certain level that can’t be broken. After hitting that level, the price will retrace lower slightly but then return back to test the previous level again.
If the price bounce from that level again, then you have a DOUBLE TOP. have a look at the double top below.
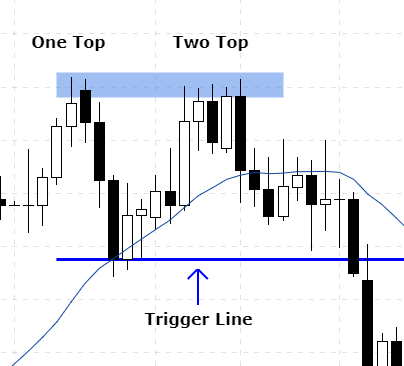
In the double top above you can see that two tops were formed after a strong move.
Notice how the second top wan not able to break above the first top.
This is a strong sign that a reversal is going to happen because it is telling buyers are struggling to continuously go higher.
The same set of principals is applied for the double bottom as well but oppositely. Have look at the chart below.
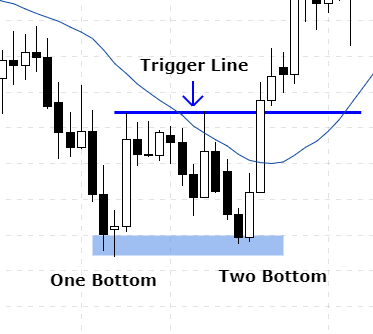
Okay, now let’s see how to trade RSI divergence with double top and double bottom.
Have look at the forex chart below.
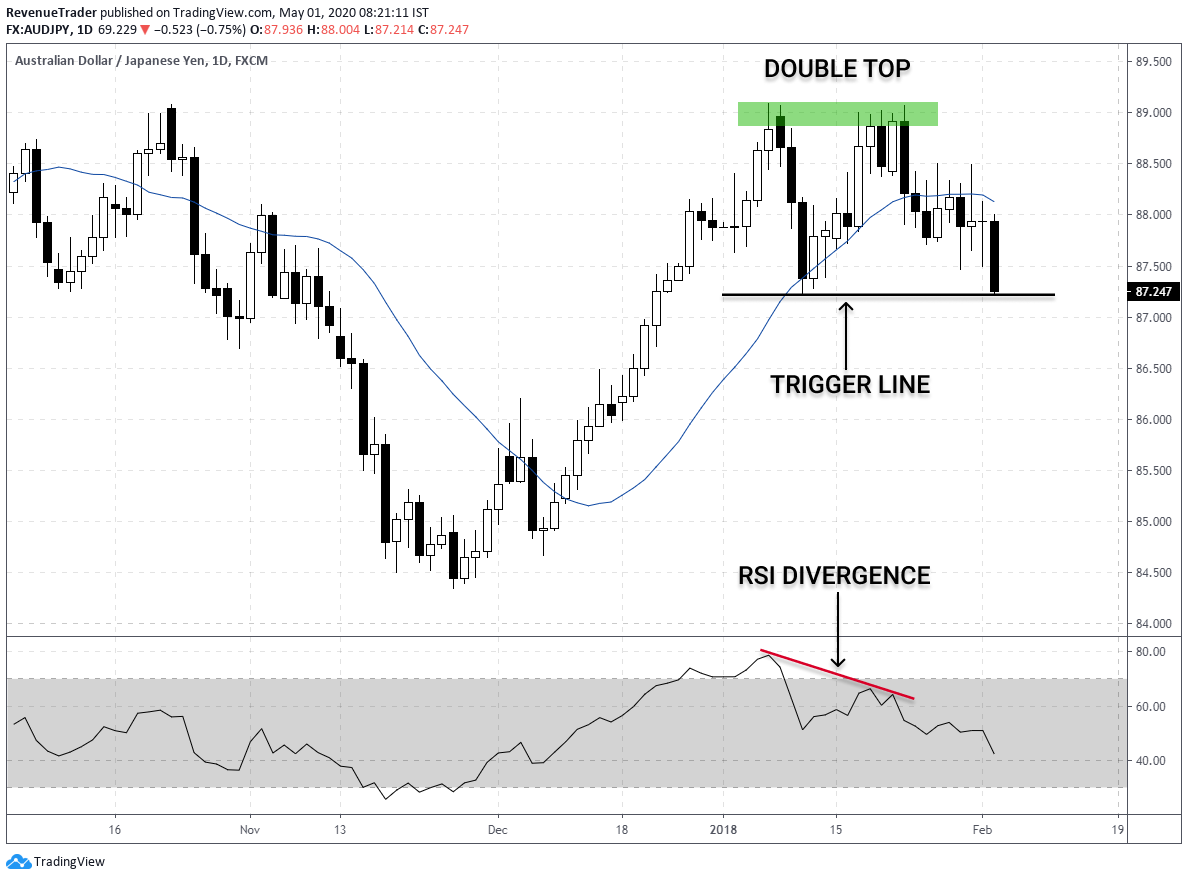
According to the above chart, can see there is a double top that is formed after an extended bullish move. If you look at the RSI can see that RSI also shows divergence at the same time.
If combine RSI divergence and Double top we say that buyers are no longer in control hence we can anticipate a reversal.
Right now all the confluences are aligned. But how to place our orders? Have a look at the chart below.
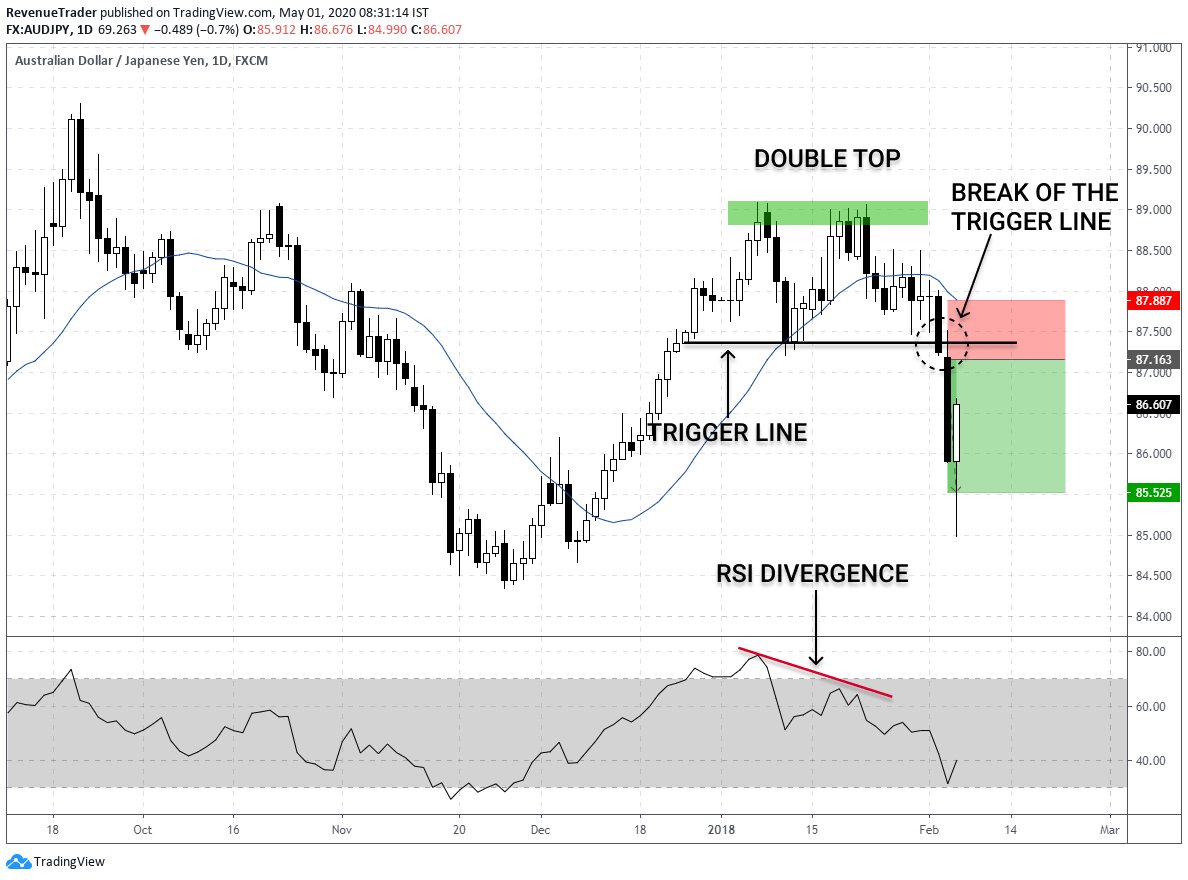
In here we use the breakout entry technique. So, in this case, we execute a sell trade after the price broke below the trigger line. After that price hit our take profit within one day. QUICK PROFIT.
The same trading techniques are applied for the double bottom as well. Have a look at the chart below which describe how to trade RSI divergence with double bottom.
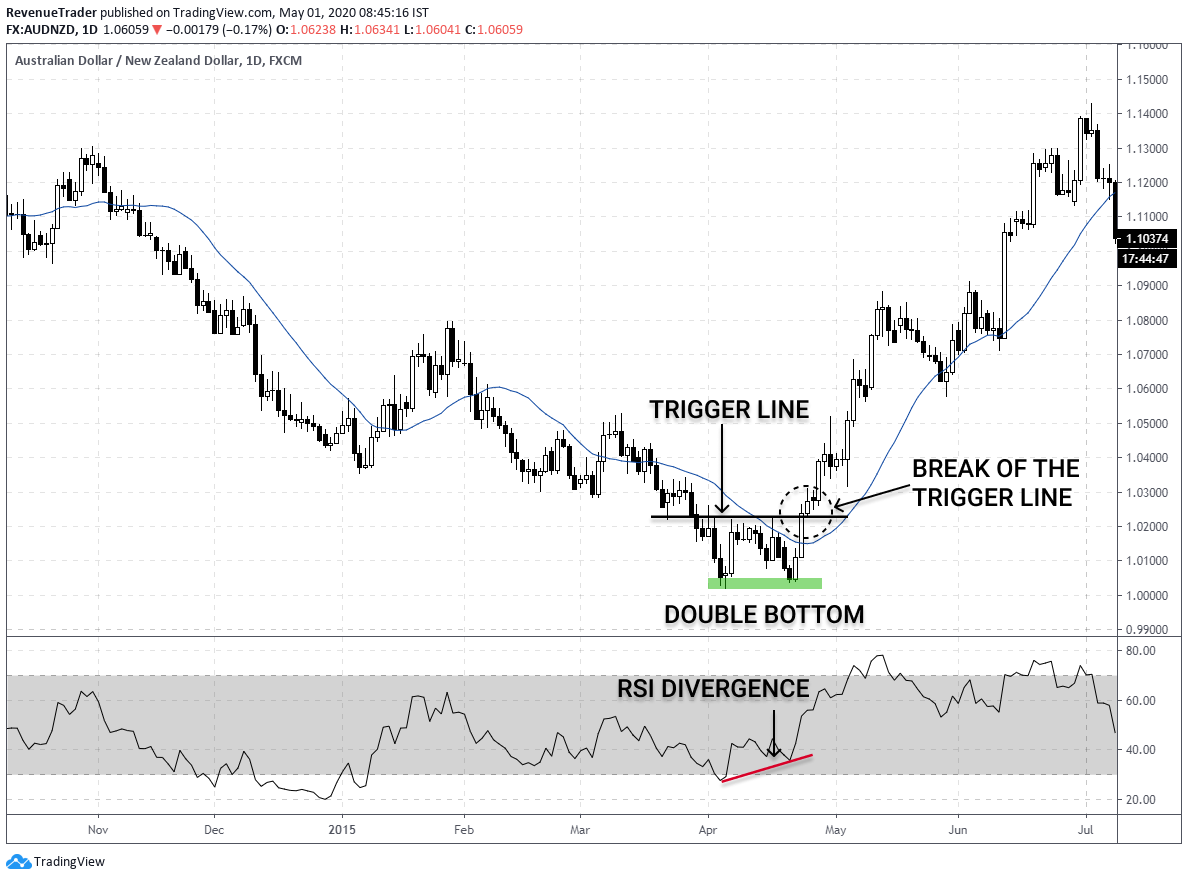
Study the above chart try to break it down. Remember that the same principals apply for the double bottom as well.
So there you have it – 4 Trade Entry Techniques to Combine with RSI Divergence.
But keep in mind that this is not a HOLY-GRAIL trading strategy. There is no such thing called holy-grail trading strategy and all the trading strategy suffer from losses and they are unavoidable.
We earn consistence profit from this trading strategy BUT we are using tight risk management and a technique to cut our losses quickly. That way we can minimize our drawdown and that open the doors for big upside potential.
Read our article on The Art of Cutting Your Losses Short – Forex Risk Management
Now before we wrap this article, I need to talk about one important trading factor.
Trade Location Is Important
Picking right and higher probability trading location is very important. Adding the filter of location can usually always bring your trading strategy to the next level.
Instead of taking just based on RSI Divergence and chart patterns, It is better to combine these two factors with highly profitable trade location like support and resistance.
Why is that? Let me explain.
The chart below explains this concept nicely. According to the chart below, you can see the uptrend with two RSI divergences. However, the first divergence (Red one marked in the chart) is completely failed and the price moved higher. But the second one resulted in a profit. Why is that?
The first divergence occurs in nowhere. But the second RSI Divergence formed right at a Daily Resistance and not only that but Double Top also aligned at the Resistance as well. So basically all the trading confluence aligned at the same location which increases the probability of our trade, right?
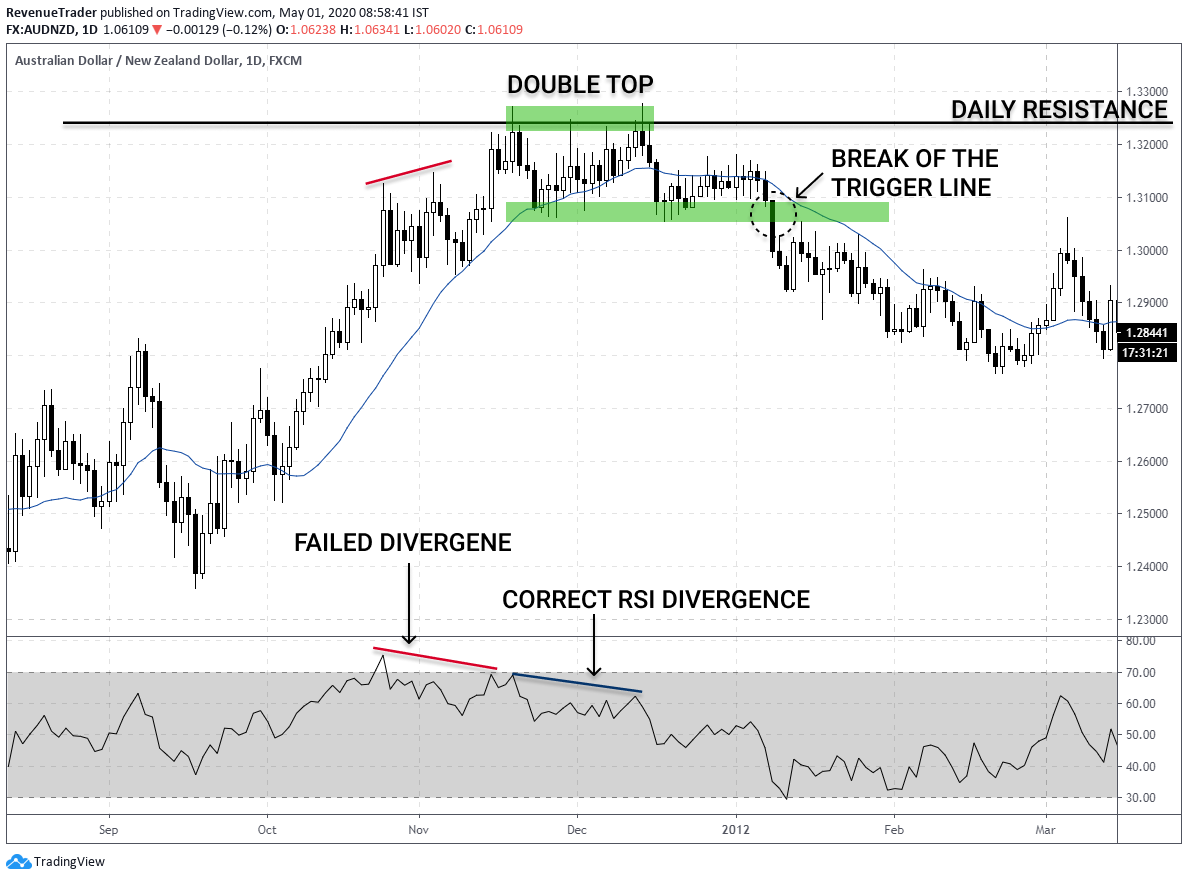
See the difference? So make sure to trade only around higher probability areas.
RSI Divergence is a powerful forex trading signal and the traders who know how to use trade RSI divergence in the right market condition with the right trading signal can build a powerful trading system that will help earn consistent profit month after month.
Now here is the bonus part we promised. Below youtube short videos show a few trades we executed in the past days or months using the same RSI divergence concept we talk so far.
EURUSD Long Trade Example
NZDUSD Reversal Trade Breakdown
EURAUD Reversal Trade Setup
If you are interested in making trades like these, read our article about this exact trading strategy.👇
Reversal Trading Strategy – 5 Step Process to Identify Trend Reversals
Finally, what is your thought about RSI Divergence? Are you already using it or are planning to implement it? Let me know in the comment section.
Do me one last favour by following us in social media – Facebook and Instagram.


One Response
very clearly explanation and good results. Thanks for your great job. Good luck. I also busy with this branch and make demo options and i dont feel myself without the chart.