In the last decads, we have seen lots of indicators were comes and go and only a handful of those indicators or EAs can assist or make consistent gains over the longer term.
Also, there are some indicators that even require trader’s contribution with chart analysis and trade filtering, in order to make a consistent gain.
In this article, we are going to discuss the SRC indicator that comes for Meta Trader 4 (MT4).
So at the end of this article, you will find out, whether the SRC indicator is profitable or not.
With that let’s dive in.
What is the SRC Indicator?
SRC indicator stands for Smoothie RSI Cloud (SRC) and it is a hybrid version of the standard RSI (Relative Strength Index) which is a very powerful momentum indicator that comes default with every MT4 platform.
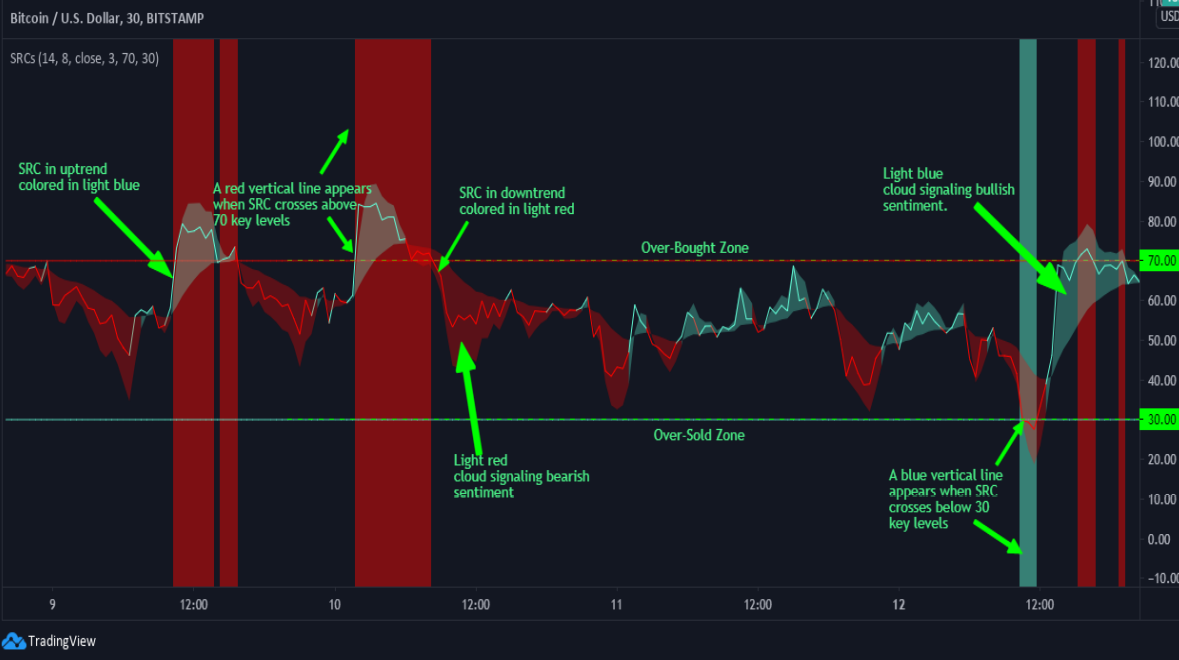
Just like the RSI, the SRC indicator also shows overbought when the indicator plotted above 70 and oversold when the indicator plotted below 30.
When using SRC…
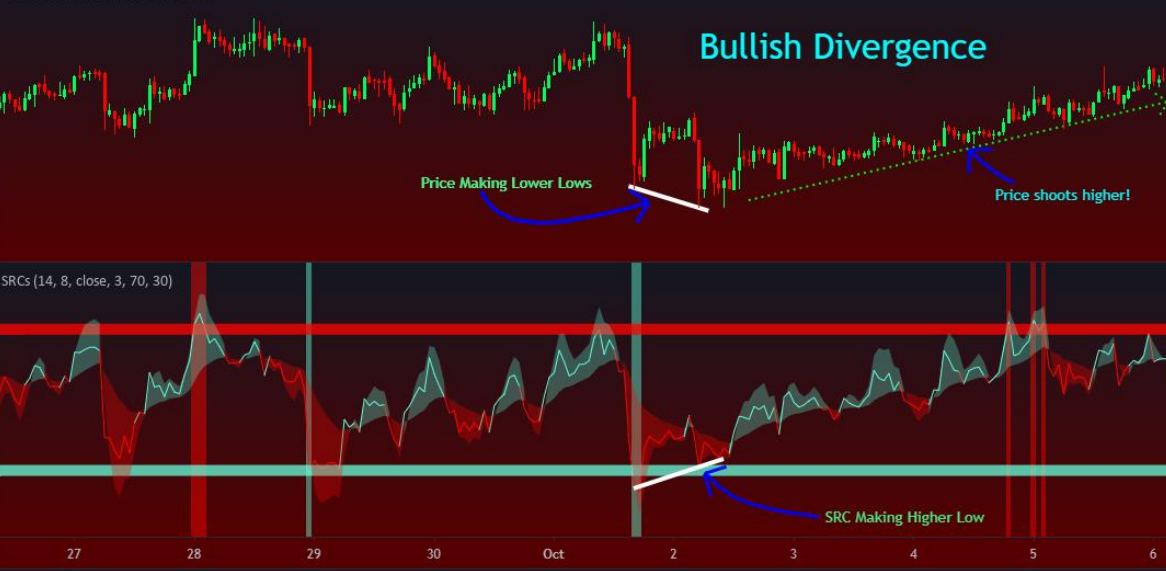
A bullish divergence occurs when the SRC create an oversold reading followed by a higher low that matches correspondingly lower lows in the asset price. This indicates rising bullish momentum, and a break above oversold territory could be used to trigger a new long position.
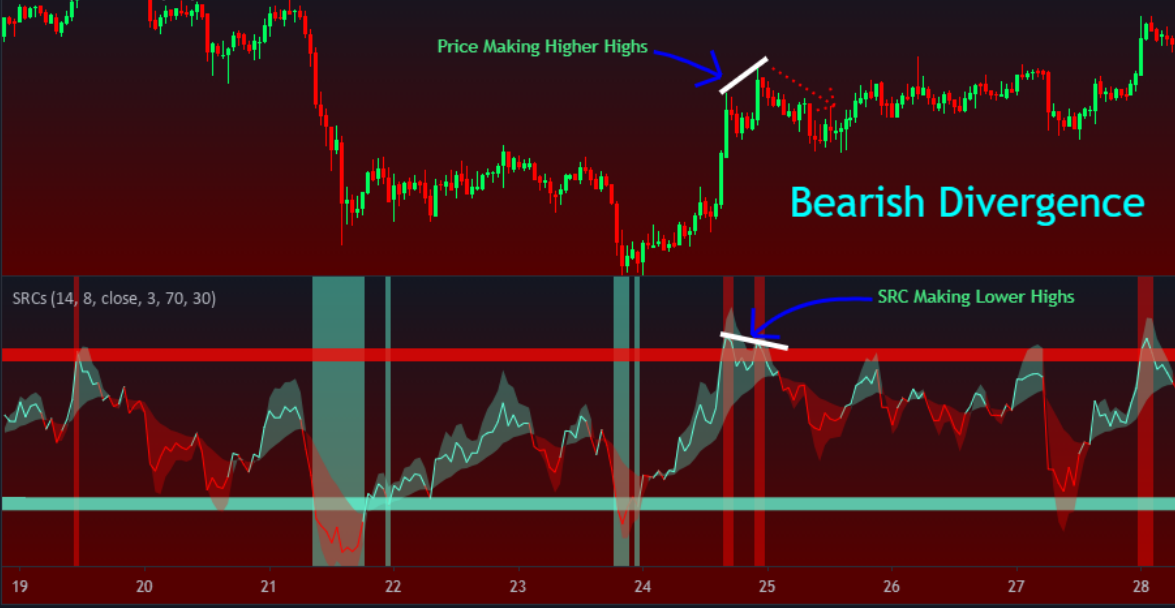
A bearish divergence occurs when the SRC creates an overbought reading followed by a lower high that matches corresponding higher highs on the price. This indicates weakness in the trend and bearish momentum getting stronger which can signal a new short position.
As we said earlier, SRC is hybrid or in other words, I can say that it is an advanced version of the RSI indicator and therefore SRC indicator use other calculations like weighted moving average ( WMA ) which determines trend direction more accurately than the simple moving average ( SMA ), and it assigns identical weights to all numbers in the data set. The smoothed period is also used which we can also set manually from setting and they all are calculated together with the RSI value to make this wonderful indicator work in action.
The picture below shows the setting you can adjust in this indicator.
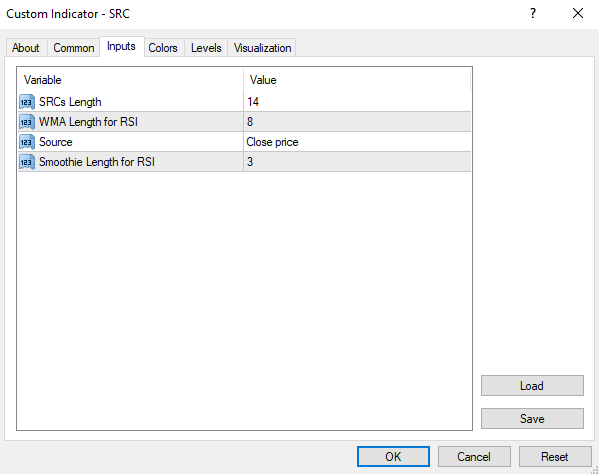
Let’s see what are these settings are stand for,
- SRCs Length: For the formation of the SRC line, the SRCs Length computation is used. It’s the time period that’ll be combined with the Relative Strength Index (RSI) momentum oscillator, which gauges the speed and change of price moves, and the Exponential Moving Average (EMA) to produce our SRC line.
- WMA Length for RSI: A period is required for calculating the Weighted Moving Average (WMA) with a user-selected source (input value ‘3’) in conjunction with the Relative Strength Index (RSI) and a smoothie value. This is how the SRC indicator generates those lovely clouds that notify a trader about market sentiment by combining two Relative Strengths with a sophisticated calculation.
- Source: A source of data (high, low, near, hl2, etc.) that is utilized to generate the second modified RSI that we discussed in the second input value (WMA Length For Rsi) above.
- Smoothie Length For RSI: A value used to provide the smoothie effect for our second modified RSI (WMA Length For Rsi), which we discussed in the second input value (WMA Length For Rsi) above.
Next…
SRC indicator includes beautiful coloured clouds that inform market participants about the current market sentiment and momentum. The light blue colour indicates a bullish sentiment situation or a strengthening of bullish momentum, whereas the light red hue indicates a bearish sentiment situation or a strengthening of bearish momentum.
These can be used to determine whether the whole market was in a bullish or bearish mood at the moment. SRC lines are advanced, and they reflect light blue when the asset’s actual price is increasing, and light red when the asset’s actual price is decreasing. SRC line passing above or below 70 or 75 overbought lines is indicated by the vertical transparent red colour on the indicator. The light blue tint denotes the SRC line passing below or over 30 or 25 of the oversold level, respectively.
The below BTCUSD chart shows how to use the SRC indicator and its trade signal.
Finally, have a look at the two charts below.
The first chart shows how to spot a bullish divergence and the second chart show bearish divergence.
Bullish Divergence 👇
Bearish Divergence 👇
Main Features of the SRC Indicator
- Measures the magnitude of recent price fluctuations to determine if a financial asset is overbought or oversold.
- Provides technical traders with insight on potential price momentum, both bullish and bearish.
- Divergence can be detected in any financial market.
- Calculation of the standard RSI using the weighted moving average (WMA) and smoothing period functions.
- Beautiful coloured clouds that inform market participants of current market sentiment or asset price momentum.
- SRCs line crossing above or below a specified threshold of two extreme levels of the oscillator indication is indicated by vertical transparent colours over SRCs line.
What is Our Thought About SRC Indicator?
The SRC indicator, in our opinion, can really assist traders to simplify their trading strategy when it comes to spotting trade setups, and the visual depiction of the trade signal can truly help us as traders recognize trend weakness and current momentum.
Although the indicator generates the trade signal on its own, the traders’ involvement is critical in determining factors such as trade location, probability, and risk/money management.
Also, remember to utilize the SRC indicator as a guide rather than following it blindly.
Finally, what is your thought on the SRC indicator? Are going to use it, or are you considering it or are you ignoring it?
Let me know in the comment section.


