Most of the newbie forex trader come into forex trading with the mindset of earn quick bucks over a short period. As a result of this most of these traders gravitate toward to lower timeframes and they don’t even think about the trading daily chart.
Because the trading daily chart is not as exciting as the 5 Minutes chart or lower timeframes. Because it is slow and it has less trading opportunities.
However…
The trading daily chart is the answer for many traders, especially if you start to trade with a full-time job.
In this article, we list 9 ways how the trading daily chart will help you to improve your self as forex traders.
And if you have a full-time job or any other source of income great. In this article, We also discuss how having another source of income can be used as a boost to grow your trading account quickly.
Trading Daily Chart Will Help You To Become A Consistently Profitable Trader
You have lots of spare time if you choose to trade on the daily chart. That is one benefits come with the daily chart.
But how this helps you become a consistently profitable trader?
Let’s assume that you are going to trade forex fulltime which mean you have to rely on your trading profits, right?
So basically you’re trying to live on trading at the early stage of your trading career. This will cause you lots of trading mistakes like over-trading, breaking your own trading rules and there is more. And eventually, you will give up on trading.
So, how trading daily chart help to stop this?
A daily candle opens in every 24 hours, which mean you have 24 Hours in between candle. So, you can keep on the job while trading the forex market, right?
This will helps you to focus on growing trading capital while relying on your day job.
Let’s say you have a losing month in trading, No problem, your job will pay bills. You’re no longer rely on your trading profit.
See, this is a very important concept especially if you are a just getting started. You cannot expect consistently profit every month, there are some losing months you have to face.
So don’t rely on trading profit at the early stage of your trading career instead focus on trading education and growing your trading account into a big one that you can rely on.
You are No longer Slave to the Market
In trading, we make trade decision based on closes of every candle, that help us to filter out false breakouts.
Assume that you’re trading on the 1-hour timeframe which means in every one hour a new candle formed, right? So what that means? It means you have to watch the market every one hour.
However, on the daily chart, you have to watch the markets you trade once a day, that’s all. Think about the freedom you gain by trading the daily chart.
Compound Interest Become your Best Friend
As we talked earlier we do not need to watch the charts all day when trading with the daily chart. What does that mean?
That means we can keep our full-time job and use it as a boost to grow our trading account.
Let me show you how…
Let’s assume two forex traders who have a $10,000 trading accounts. Both traders make a 30% ROI annually.
Let’s take these traders as examples and talk about two scenarios,
- Trader A – He trades full-time
- Trader B – He trades while doing a full-time job. He also contributes $5000 that he earned from his job to his trading account annually.
Who will be earned more?
Let’s use compound interest calculator from money chimp to find out who will be earned more money in the 10 years.
Okay, first of all, Let’s find out how much money Trader A will make in 10 years.
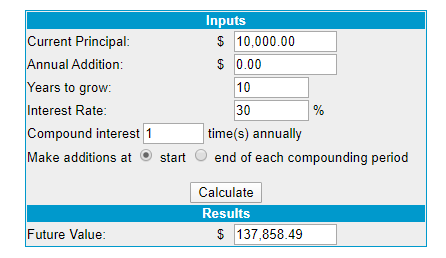
As you guys can see he turned $10,000 into $137,858.49 within 10 years.
Now Let’s see how much Trade B can earn in 10 years.
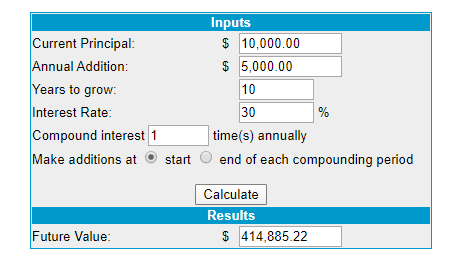
As you guys can see Trader B’s performed 2X compared to the Trade A. He turned $10,000 into $414,885.22 in a matter of 10 years.
Both the Trader A & Trader B had the same ROI (30%). But Trader B able to contributes the $5000 into his trading account annually because of his full-time job. By contributing that amount annually he will be able to over-perform than Trader A.
See if you have another source of income while trading forex part-time, you can use that income to boost your trading income dramatically. This is the fast way to quit your job and achieve financial freedom.
Next, let’s talk about another very important benefit that helps us to improve our self as forex traders by trading daily chart.
You’re More Relaxed And Make Better Trading Decisions
Let me ask you a question?
Have you ever traded on lower timeframes such as 5-Minutes or 15-Minutes? What is your experience? Let me know in the comment section.
For me, It is very stressful, I have got to make quick trading decision to buy and sell while managing the right position size in a very small time period.
Not only that, but it is also even more stressful to monitor two or more trading opportunities at same time.
However, on the daily chart, a new candle formed in every 24-hours. Which mean the time is on your side, right?
That allows you to have more time to Analyse, Think and Plan your trades.
As a result of that, At the end of the day, you will end up making good trade decisions which ultimately lead to fewer trades but quality trade opportunities.
Let’s talk about another way trading daily chart helps us to improve our selves as forex traders.
Say Bye to News Events
Another factor, that we need to focus on the lower timeframe is that the major news releases like NFP (Non-Farm Payroll), FOMC (federal open market committee), etc.
Impact of these major news events on the lower timeframe is considerably high. Have look at the effect of Non-farm payroll in 15-Minutes timeframe on EURUSD.
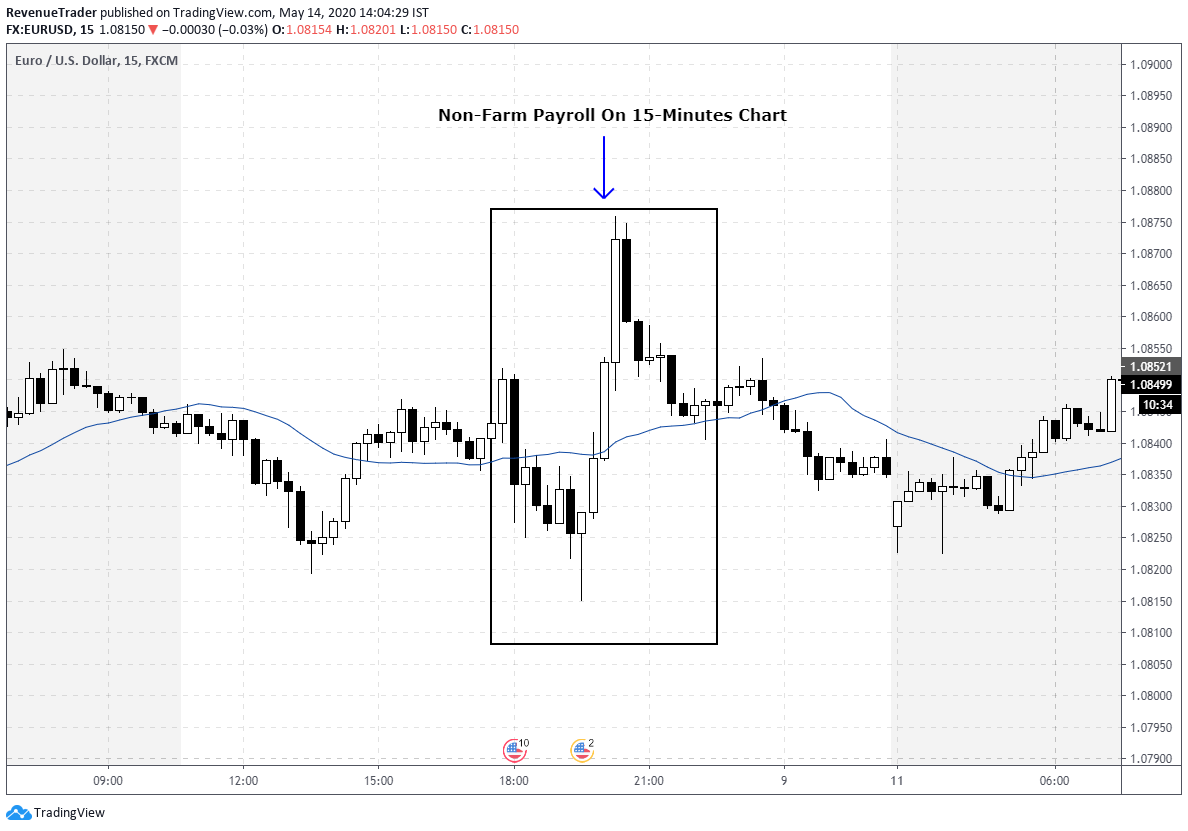
So, when trading lower timeframe you have to keep eyes on major news events or, you will easily end up hitting your stop-loss.
However, on the daily chart news events are less impactful. Have a look at the EURUSD on the daily chart.
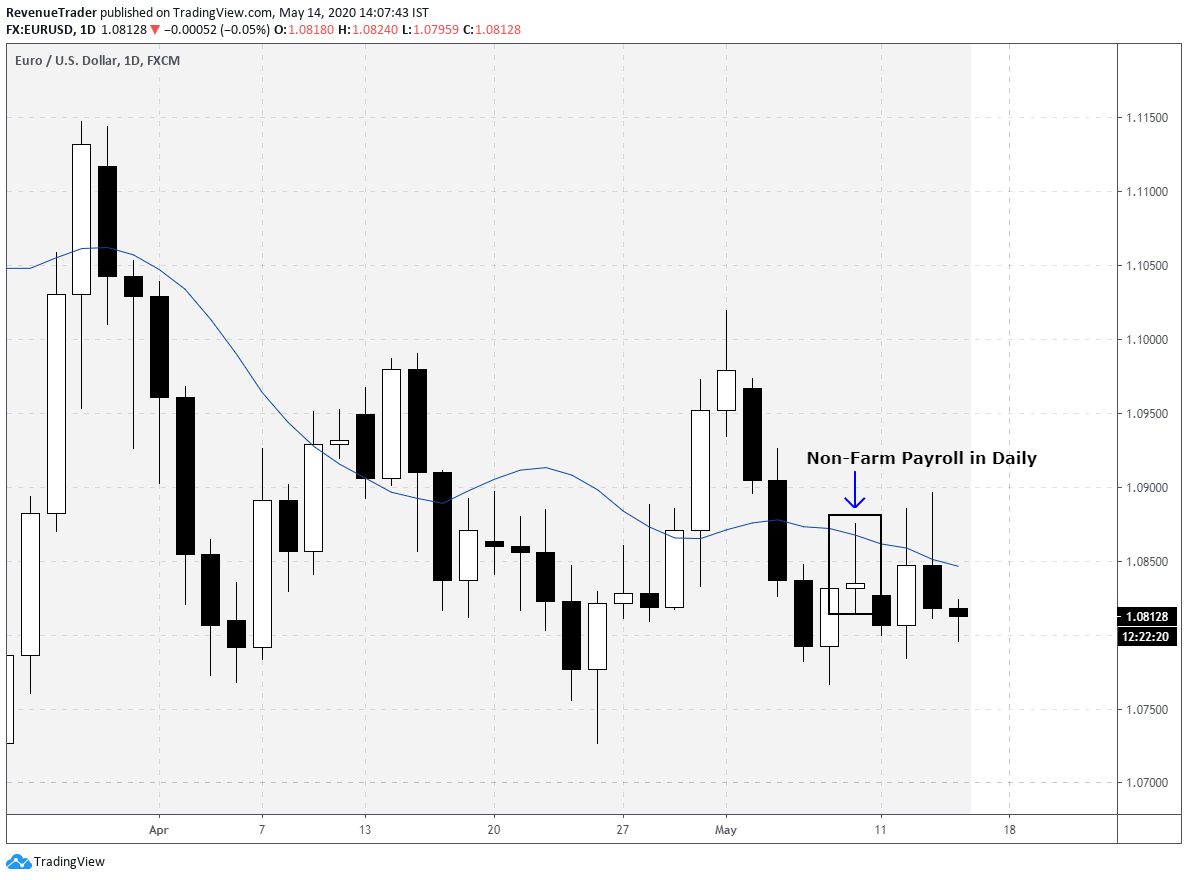
On the daily chart, it is just a wick with a small body and comparing to the other candlesticks on the daily chart, Non-farm payroll is just a spinning top, right? and there is no chance of getting stopped out on a trade.
So the bottom line is, the higher the timeframe is the lesser the impact of the news event.
You Have Lots Of Time To Focus On Your Trading Process
We all know that time is in our favour if we choose to trade on the daily chart, right?
That helps us focus on many other aspects that traders should focus on if they want to treat trading as a business.
So, open and closing a trade is just one part of trading, But journaling your trades, review your trade day or week, managing your risk and money, evaluating the trades you executed, continuous learning – these all are mini-jobs that traders should pay attention to.
By trading daily chart you have lots spare time, right? Why not use this time to focus on something helpful like Risk management, or analyse your trading day.
As an example, I review all the trades I executed throughout the week on Saturday morning every week – this helps me filter out bad trade or the mistakes I did on the previous week.
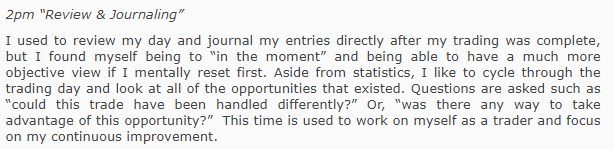
Here is the great reference for this – I found a great article written by Akil Stokes (Co-founders of Tier One Trading) on FX Trader Magazine about his trading routine. On that article, he explained about his trading routine that he used. After reading that article I realize that his trading routine covers all the aspect of his trading.
Have a look at the snippet from that article. In here Akil is talking about how he reviews his trading day.
Click here to read the full article.
You Can Manage Your Trades Precisely Once You Enter A Trade
Just like the trade entry and exits trade management is also a very important part of a profitable trade.
After entering a trade you only have two option, either a win or a loss. Whatever the outcome, we have to agree with that, right? because we can’t control it.
But there are factors we can control after we placed a trade like Risk management, Cut your losses or scale-in and more.
Now let’s see how trading daily timeframe can help us to manage our trade precisely.
First of all, let’s talk about why it is hard to manager trade on lower timeframes? There are two reasons why trading lower timeframe makes it harder to manager trades.
- In lower time frame there are lots of unnecessary price movement – This makes it hard to read price action to manage our trades.
- The trading lower time frame involved lots of emotions – in lower timeframe price move up and down very quickly this makes it hard to manage our trades in the face of the ever-changing market.
However, on the daily chart, every candle summarizes the trading activities of the whole day. This is what makes daily candle is so meaningful.
So, we can use daily candlestick patterns as a guide to managing our trade in various way such as moving the stop loss to break-even, cut our losses early or scale in. have a look at the EURJPY trade example below,
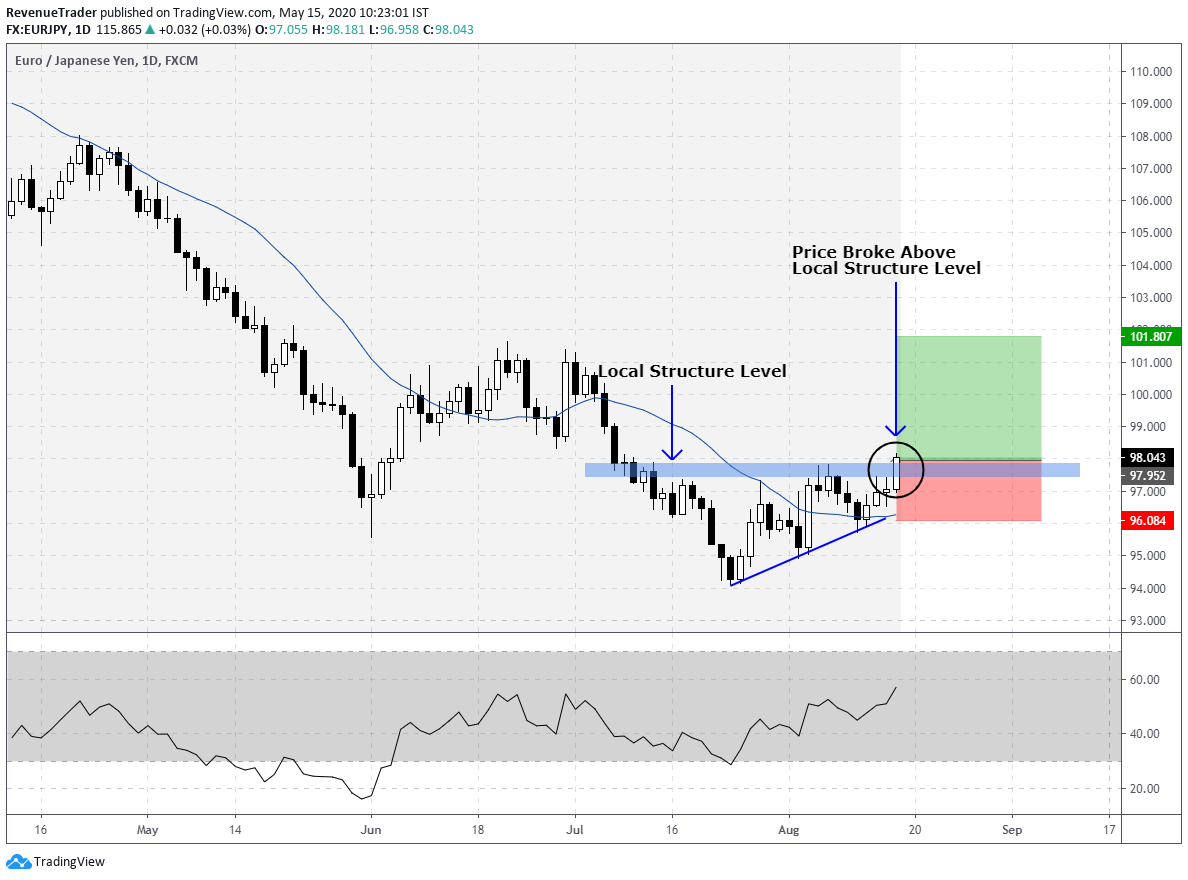
As you guys can see we just placed a long trade as price broke above the local structure level. Now it is a matter of waiting, right? No. It is always better to manage our trade in term risk or we called in at cut losses early. Now have a look at the same EURJPY trade after a few days later.
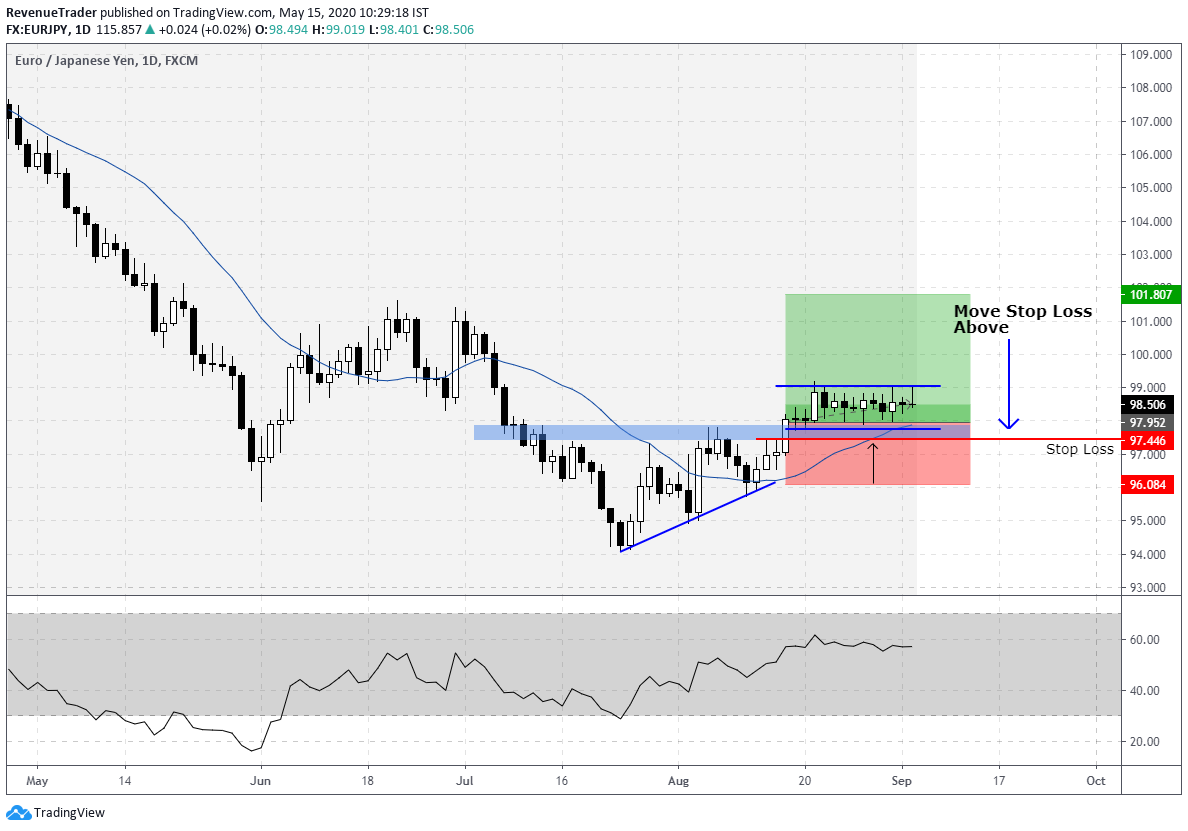
In the above chart, you can see the price start to consolidate after the breakout, right? This indicates the lack of buying pressure after the breakout and also this signal comes from the daily chart which means this is very important, right?
So, what you do in a situation like this? Are you waiting for to hitting your initial stop loss or Are you cut your losses just like the above chart?
See, unlike the lower timeframe, trading daily timeframe allow you to think and manage your trades precisely. This all because of time is in our favour, right?
Now let’s move to the next advantages we get from the trading daily timeframe.
Daily candlestick reflect three trading sessions
A daily candlestick operates 24hours. That means it consists of all the trading sessions – New York, London, Tokyo and Sydney.
At the end of the day, we get summarize report of trading activities happened during those trading sessions as one candlestick patterns, right?
So think how crucial is the one candlestick pattern in the daily chart.
Less is More
Everyone knows that in the daily chart you have less trading opportunities when compared with the lower timeframe. This comes with many advantages and disadvantages.
The main downside is that we have less trading opportunities and we need to have lots of patience to take advantage of this low trading frequency.
But it is worth to wait.
Because by trading the daily chart, you always wait for the quality trading opportunities and that ultimately increase odds in favour. That is the beauty of trading daily chart.
Keep in mind that QUALITY OVER QUANTITY.
Related – How to Effectively Trade Daily Chart in Forex
So, is trading daily chart is for you?
In forex trading, you have to choose your timeframe base on your trading goals. If you need consistent income from forex trading, to be honest, the daily chart is not for you.
Because it takes a few weeks or months to play your trading edge.
So when choosing timeframe, please consider what are your trading goals and find a time frame that suits your day to day life.
Okay that all. so what is your favourite tip and why let me know in the comment section.
I hope you guys enjoyed this article & if you want to stay up to date with what We are doing, feel free to follow us on Facebook and Instagram.


