The Forex market is constantly changing, giving you an opportunity to trade each second.
Yet it doesn’t give you high-probability trade setups every second, right?
Then how do we filter out only the high-probability trading setups between these infinite streams of opportunities provided to you every second?
This is exactly what we are going to talk in this article.
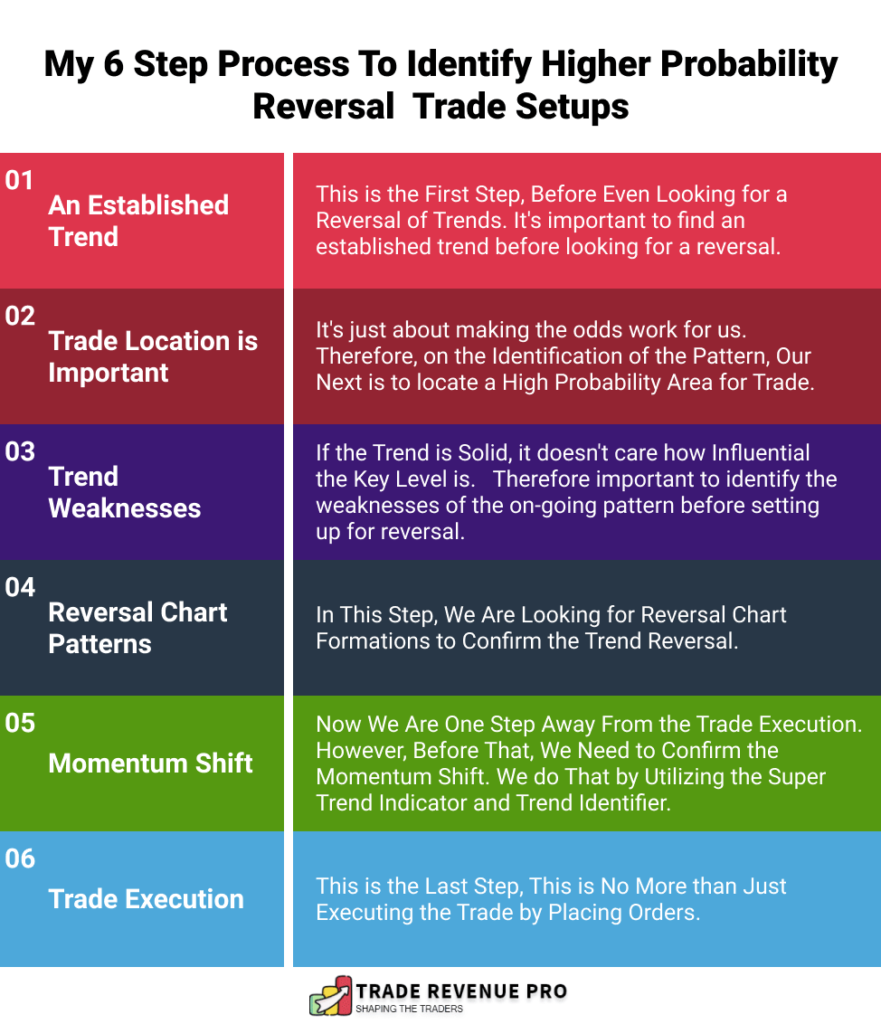
Specifically, the below infographic explain my 6-step process to identify higher probability trade setups consistently.
With that let’s move into the first step.
Important Note
Keep in mind that we utilizing 2H, 1H and the 30 Minutes for these trading techniques.
Step 01: An Established Trend
This is the very first step of identifying a high probability reversal trade setup. Think of this step as a foundation of the whole reversal trading setup.
Now we are looking for reversals of trends, right? But for that, we need to have an established trend (Uptrend or downtrend) in our hand.
In Forex trading, there are various trading methods we can use to identify a trend. Some traders are using moving averages, trend lines and market structure. We use pure price action context method. It is simple and straightforward.
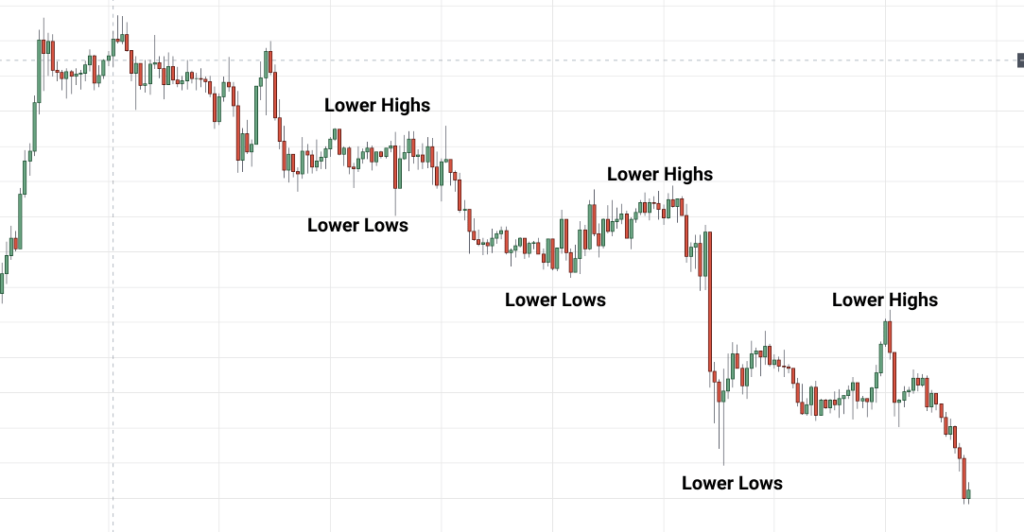
Take a look at the image below, which illustrates how uptrend and downtrend markets are shaped.
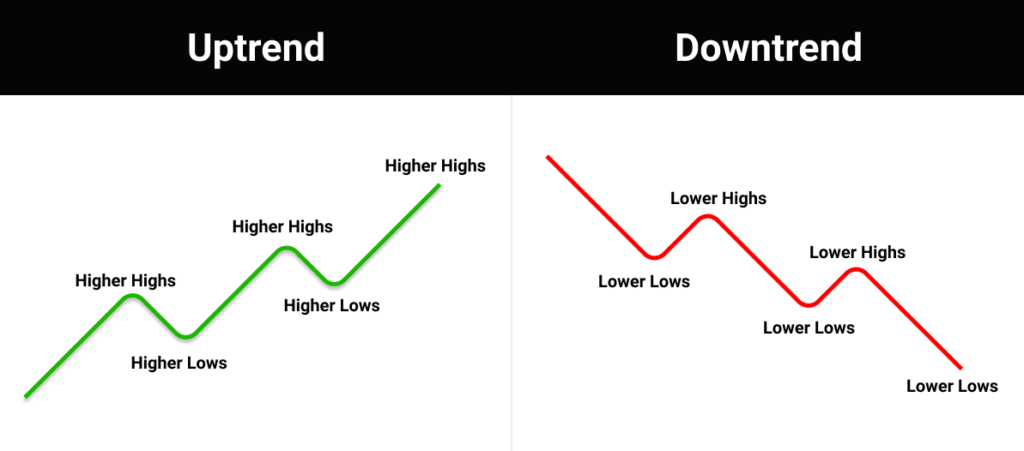
On the left, you can see an uptrend. It is easy to identity. As long as price making higher highs followed by higher lows, it is an uptrend, and vice versa as long as price making lower lows and lower highs it is a downtrend.
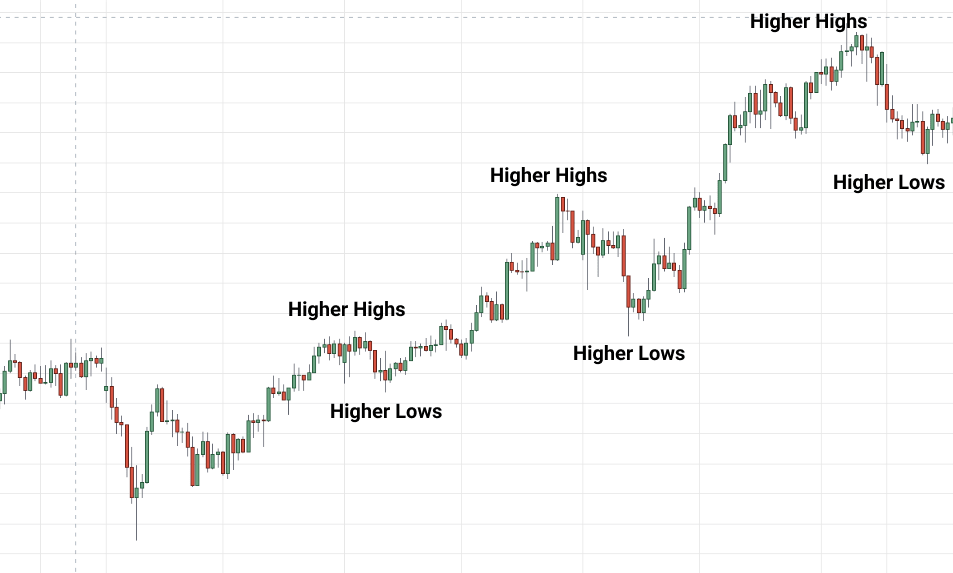
In real forex chart, this is how an uptrend looks like. 👇
… and a downtrend looks like this. 👇
Note
Pay very close attention to every step we’re taking. At the end of this article, we will take a few examples of trade and will apply these steps to them. This way, you can understand the process behind these steps.
Okay, let’s assume that we have an established trend in our hand. Next, let’s move into the second step where we are going talk about trade location
Step 02: RSI Condition & Trade Location (Picking Best Trade Location)
Step 02 is all about finding the higher probability trade area to look for a market reversal.
Personally, I’ll do this by using 2H RSI and the key levels.
First, let’s talk about how the RSI indicator helps us to find higher probability trade areas. Keep in mind that we use 2H timeframe with the RSI indicator.
Now, this is easy. All we have to do is to find RSI oversold and overbought signals in the 2H timeframe.
Why looking for overbought and oversold signals in 2H? Have a look at the chart below.
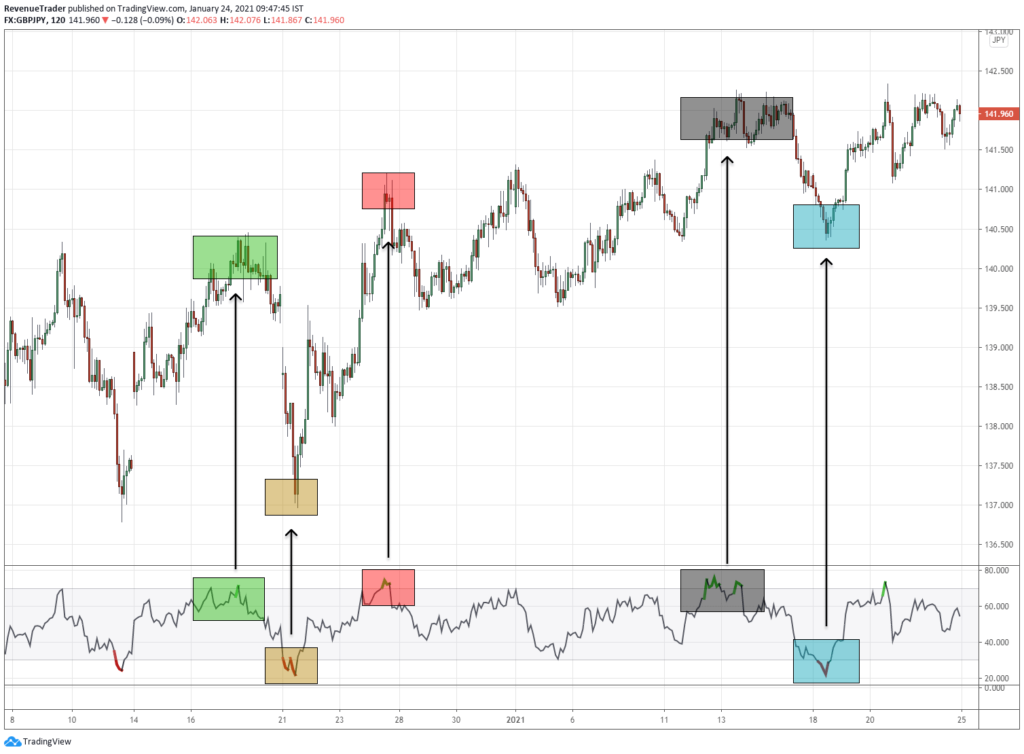
According to the above chart, you can see that every time RSI in oversold or overbought, the market is either going up or down. (Observer the coloured box in the above chart). This is an easy and objective way to pinpoint highs and lows in the market. But keep in mind that this is not always going to work.
For that, we need to confirm these RSI overbought and oversold signals.
This is where key levels like support and resistance come in to play.
Upon the recognition of the RSI oversold & overbought in the 2H time frame, our next task is to confirm this RSI signals. Basically, we can do this by identifying high probability trade areas.
This can be accomplished by recognizing the right support and resistance, while at the same time RSI showing overbought and oversold signal.
Keep in mind that I only use 2H and 4H timeframes to define these levels. Since support and resistance from 2H and 4H timeframes tend to draw big market players, the potential for massive reversals is always high.
With that in mind, let’s see how I draw these support and resistance level.
My approach is quite straight forward. The first thing I do, starting with a naked chart, is to check if the market is at the support level or at the resistance level. If it’s at a certain level, I’m going to bookmark the specific pair and search for reversals in the future, and that’s not the case, which means that the market is at a NO MAN’S LAND, I just ignore such currency pairs.
Let’s take a few examples to clarify this, Have a look at the EURJPY 2-hour chart below,
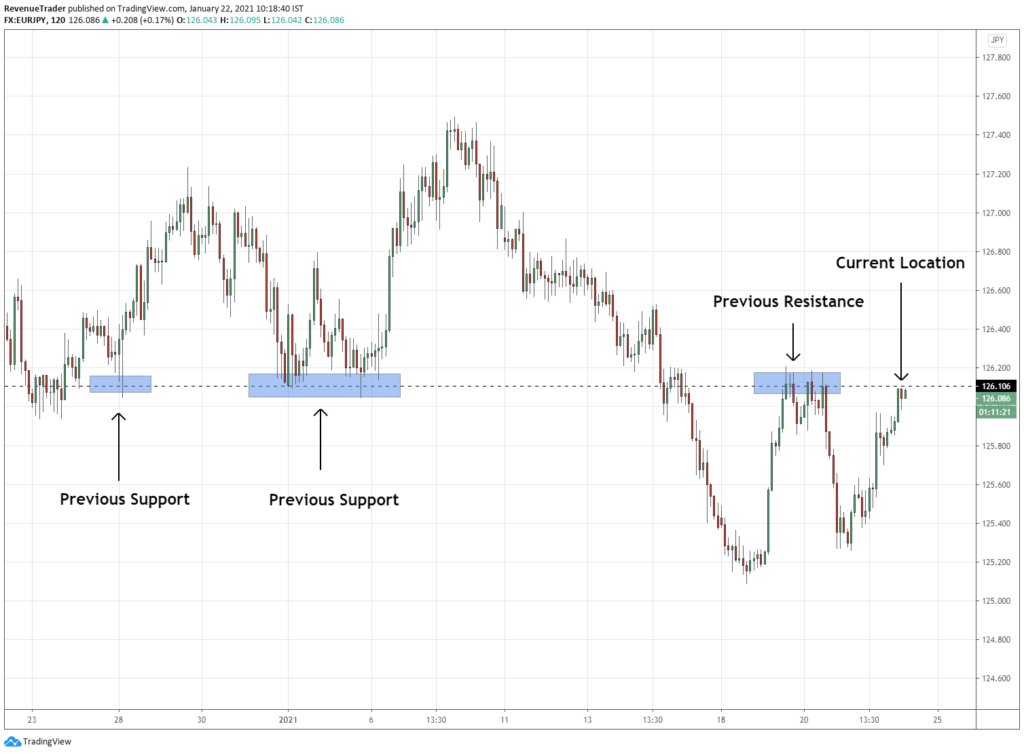
Have a look at the current location of the market. It’s at a very crucial level, isn’t it? If we look left, there are three big bounces on this level, and this makes this a zone of value to me, and I’m sure I’m going to keep this pair on my radar.
Next, have a look at the GBPAUD 2H chart below,
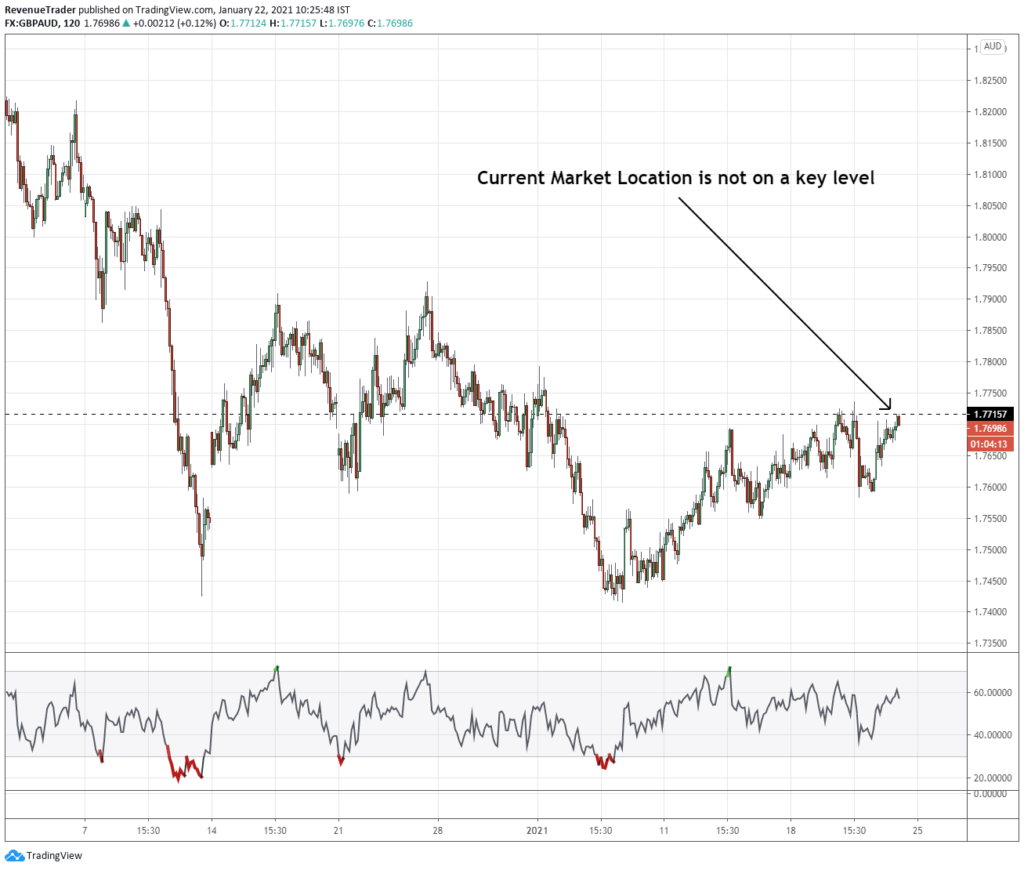
In this chart, the market is in no man’s land, and even if you look left, you can’t see a simple bounce off that level. Therefore GBPJPY is not in a high probability area and we should avoid trade on pairs like this.
Awesome, Now you know why RSI overbought and oversold signals are important. Also, you’re now familiar with identifying support and resistance level.
Now before move into step three, let’s see how to combine the RSI and Key levels to identify ideal levels to look for potential reversal opportunities. And also combining these two, we can avoid lots of losing trades as well.
Now have a look at the chart below.
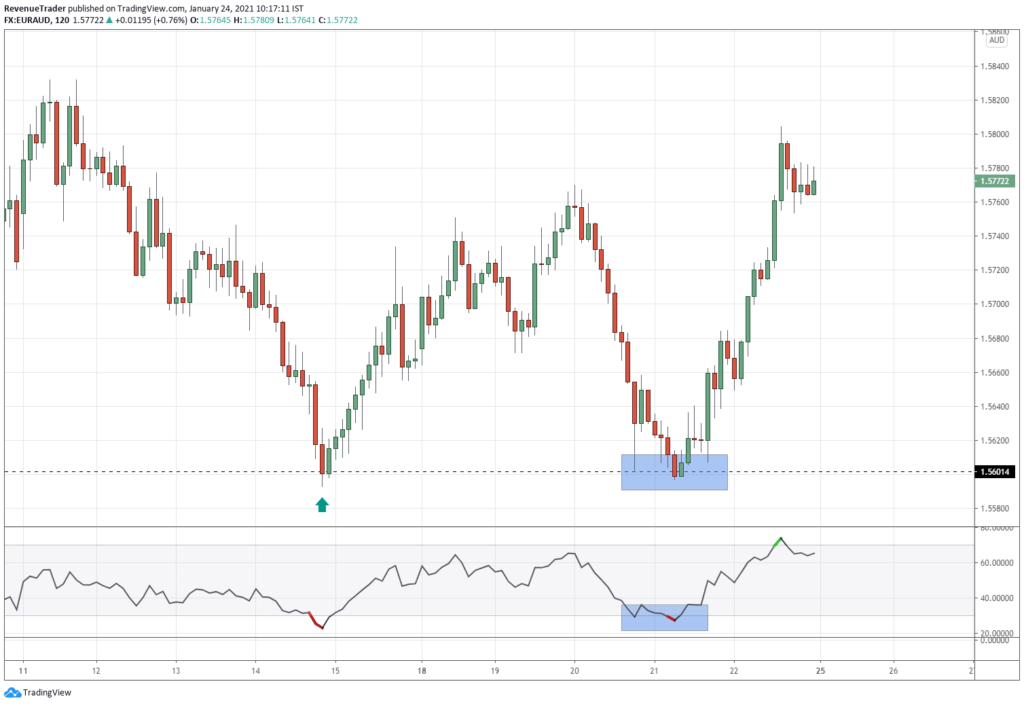
In the chart above you can see that, RSI oversold and support level aligned nicely at the same time which increases the probability of a reversal. See afterwards price shoot like a rocket.
Now let’s see how these two trading confluences helps us avoid most of the losing trade. Have a look at the USDJPY 2 hour chart below.
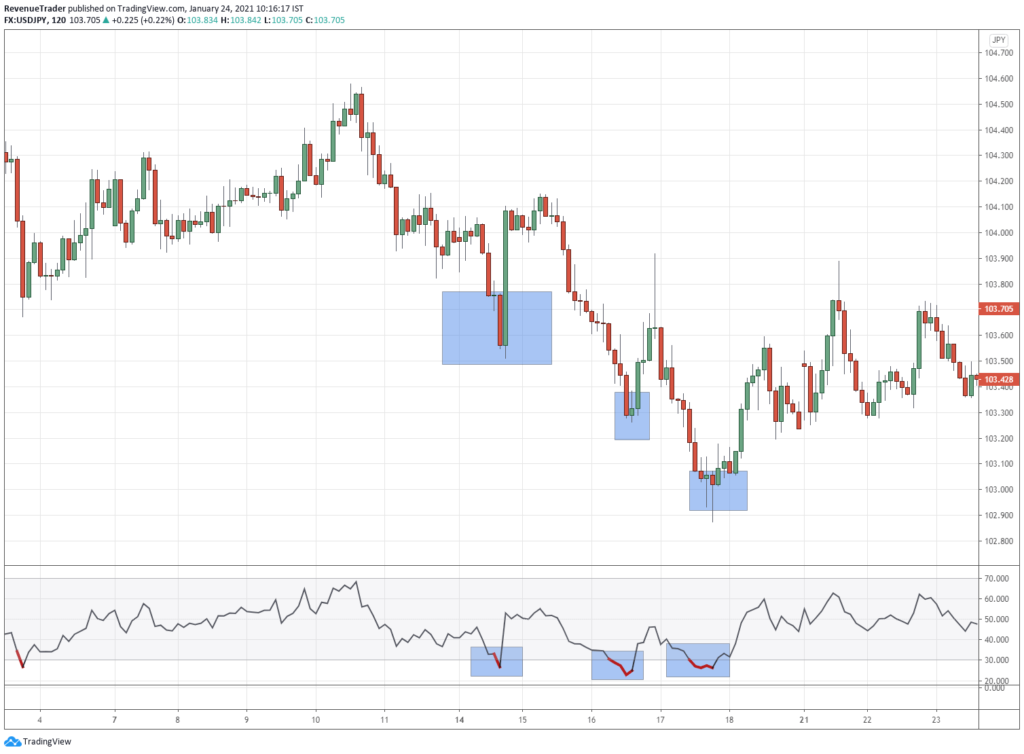
At a glance, you can see that RSI generated three consecutive oversold sold signals which lead to unprofitable trading, right? But since these oversold signals are not aligned with the key levels (support, resistance, round numbers) we simply ignore these level due to the low probability.
Just like that in my trading career, trading locations such as support/resistance levels, round numbers and swing points are the best trading filter. These levels are very useful, particularly when it comes to identifying high probability trade areas.
With that step 02 is also complete. Now you have a trending market with a high probability trade location to look for a reversal.
Next, let’s go on to step three and examine the current trend to recognize the weaknesses and strength of the trend.
Step 03: Observe the Trend to Recognize the Weaknesses of the Trend
Until now,
In Step 01 – We identified a well-established trend on a 30-minute and 1-hour chart. then,
In Step 02 – We identified a high probability trade area utilizing RSI and key level in 2 hours and 4-hour timeframes.
Now is the time to identify the weaknesses of the trend we defined in the first step.
For that, we use 4 trading techniques which are proven to be profitable in the long run.
- Size of the Trend Wave
- Size of the Retracement Move
- Break of the Previous Higher Low or Lower High
- Trend Line Bounce Failure
Head over our guide on Reversal Trading to learn about these 4 trading techniques. In that article, we explain these techniques with comprehensive examples.
I highly recommend you guys to read that article before continuing from here.
As an example, let’s see how to use Trend Wave to gauge the weaknesses of an on-going trend. Have a look at the chart below,
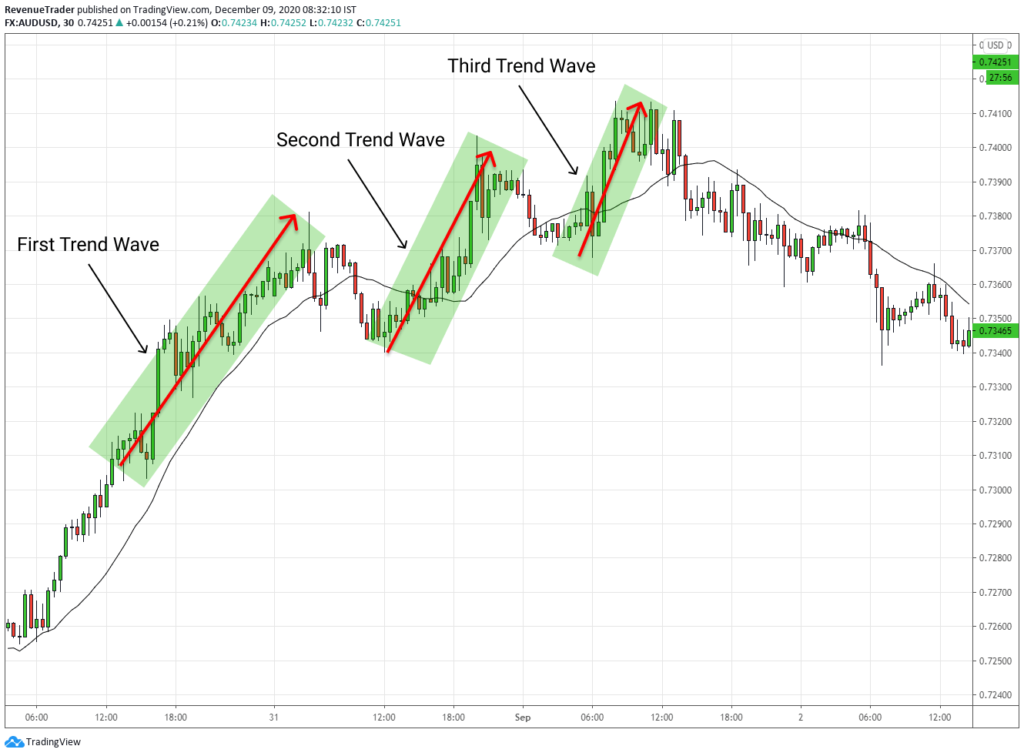
In the above AUDUSD 30-minute chart, you can see that market was in a strong uptrend with price making series higher highs followed by higher lows.
Now have a look at the three trend waves marked in the above chart. Have you noticed anything important? Yeah! It is the size of the waves. They are getting smaller and smaller indicating lack of bullish momentum. Just like that, you can use trend waves to understand the momentum behind the trend. You can also use the other three factors we mentioned earlier as well.
With that, before move into step 04, let’s combine what we learned in these 3 steps so far. For that study the CADJPY 30-minute chart below carefully.
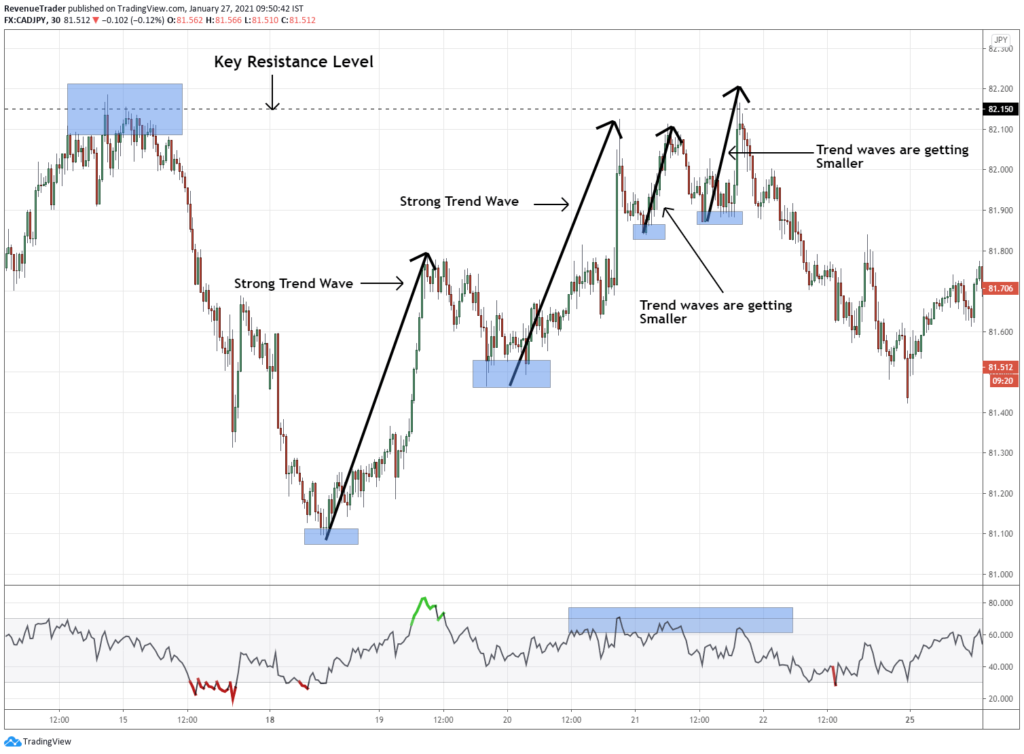
Let’s go step by step,
01 – First we can see a strong uptrend with price making series of higher highs followed by higher lows.
02 – Second, as price approached the key resistance level marked in the chart, the RSI indicator started to show over-bought condition. Now price action is sitting just below the key resistance level while the RSI showing over-bought signal. So, we can consider this is a high probability area.
03 – Now have a look at the trend waves. First trend waves are strong and long indicating heavy bullish momentum. But as price approach to the key resistance level, trend waves are getting smaller and smaller suggesting lack of bullish momentum.
At the moment we have a weak uptrend trading around the high probability area. Specifically, when considering the trend waves, it clearly defines the take-profit happened in the marked resistance area. When considering these factors, we can conclude that there is a higher probability of market reversal.
But, we can’t just blindly place orders on the market assuming they’re going reverse. This is a quick way to go broke.
Then how do we anticipate and catch the reversal on right time?
This is where reversal chart patterns come into play.
Step 04 – Use Reversal Chart Pattern to Confirm the Trend Reversal
In the world of forex trading, there are lots of reversals patterns. Some of them are proven to be profitable and some of them are not.
In my trading, the best reversal pattern that worked for me are:
- Double Top and Double Bottom Pattern
- Head and Shoulders Pattern
- Break of the Local Structure Level
- Break and Retest Pattern
- Momentum Drive Pattern
Keep in mind that, I used 1-hour or the 30 minutes chart to identify these patterns.
Once again you can learn how we utilizing these pattern in reversal trading including trade entry in this article – Reversal Trading: The Definitive Guide.
If you are familiar with these patterns keep on reading, but if not I highly recommend to read the above article before continuation from here.
Let’s see how these patterns worked in the real chart. Now have a look at the chart below.
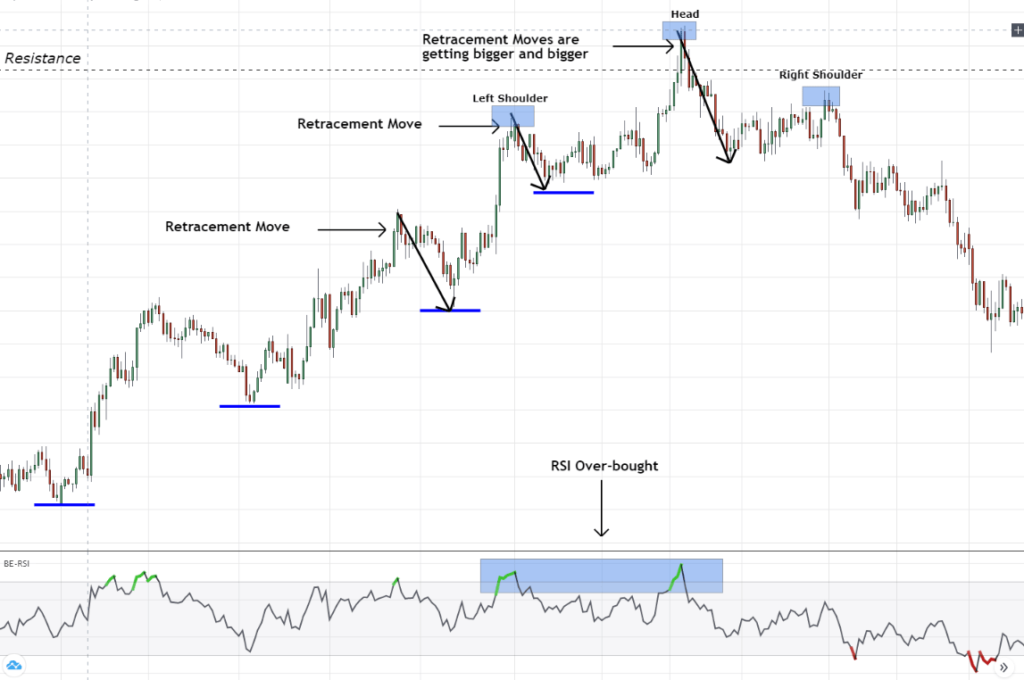
01 – First we can see that the market is in a strong uptrend with price making series of higher highs followed by higher lows.
02 – Next have a look at the resistance level marked in the chart. It is a high probability area to look for a market reversal. Also at the same time, the RSI is also showing overbought signals which is a plus point.
03 – Now have a look at the retracement moves. They are getting deeper and deeper suggesting lack of bullish momentum.
04 – And finally have a look at the head and shoulders pattern formed at the resistance level. This is what confirms the trend reversal.
Have you seen how the trade setup builds from nowhere to a higher probability trade setup? It’s easy, straight forward, and most importantly, it’s highly systematic, which essentially allows you to be consistent in the forex market.
Now the all the technicals are aligned perfectly, next it is all above placing the orders and catching the reversal, right?
But, what if you caught in a retracement?
This is where step 05 comes into play.
Related – Reversal Trading: 5 Practical Entry Strategies
Related – Head and Shoulders Pattern in Forex – A Reversal Trading Strategy
Related – How to Trade Double Bottom Pattern: A Step-By-Step Guide
Step 05 – Wait for Momentum Shift Before Executing
Even if we have taken all the steps listed above, there is always a risk of being trapped in a retracement, not a reversal.
According to my backtesting results, I know that if I follow the above steps in a systematic approach, I will minimize the amount of time I have been stuck in the retracements.
So to keep me from being stuck in a retracement or in another degree, I would say that, in order to get an ideal trade entry, I decided to level up my trading strategy by adding two technical indicators that help me evaluate the momentum shift behind buyers and sellers in an objective way and eventually help me get involved in reversal moves at the right time.
The two indicators are:
- Super Trend Indicator, and
- Custom Build Trend Identifier
With the combination of these two indicators, I can execute trades in an objective way and on the right time.
Now, What is the Super Trend Indicator? Let’s clarify this by using the below chart.
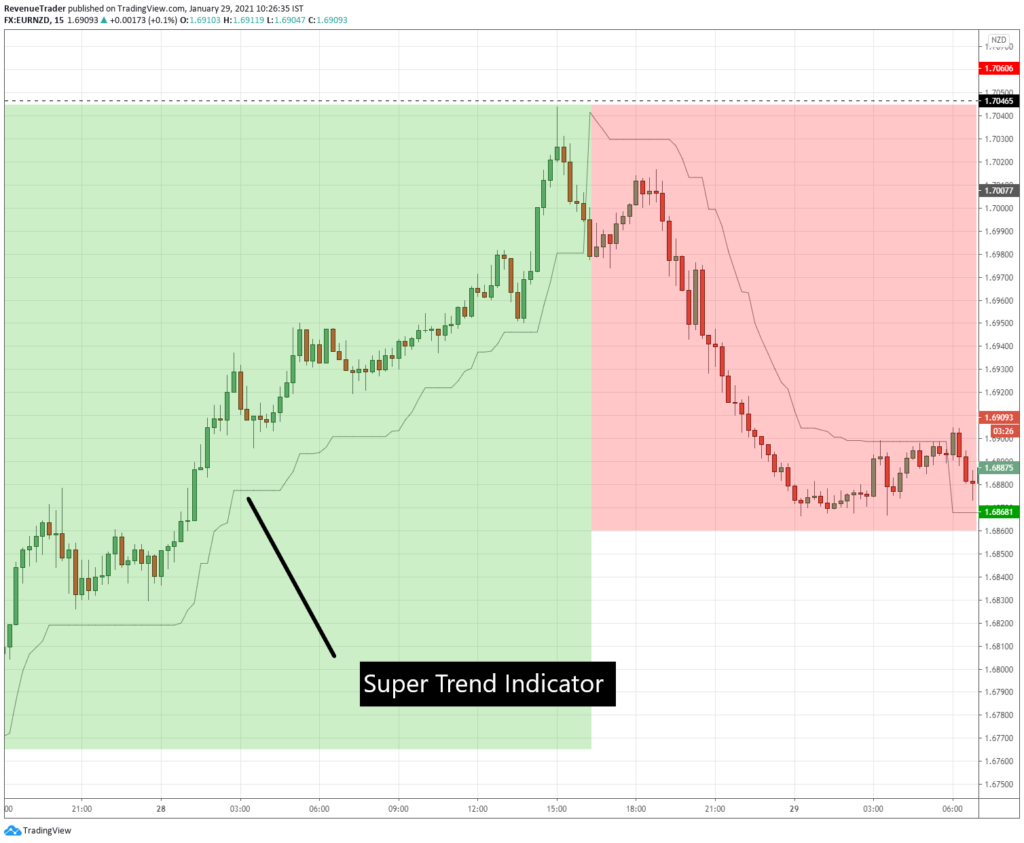
In the above chart, the staircase like line in the grey colour is the Super Trend Indicator. In an uptrend, it plots below the price and in a downtrend, it plots above price.
Now have a look at the green box. It represents an uptrend with price making higher high while Super trend indicator stepping upward along with the price actions.
Next, have a look at the beginning of the red box, on there the super trend indicator just move above the price action indicating the momentum shift from bullish to bearish. Look what happened after that, the price actually ended up reversing, right?
Now, I hope you got the idea here. The super trend indicator helps us to define the momentum shift in an objective way.
Now let’s talk about the next indicator which is our custom build trend identifier. When combining these two indicators, they help me to get the best possible trade entries every time regardless of the trade outcome.
Now have a look at the chart below.
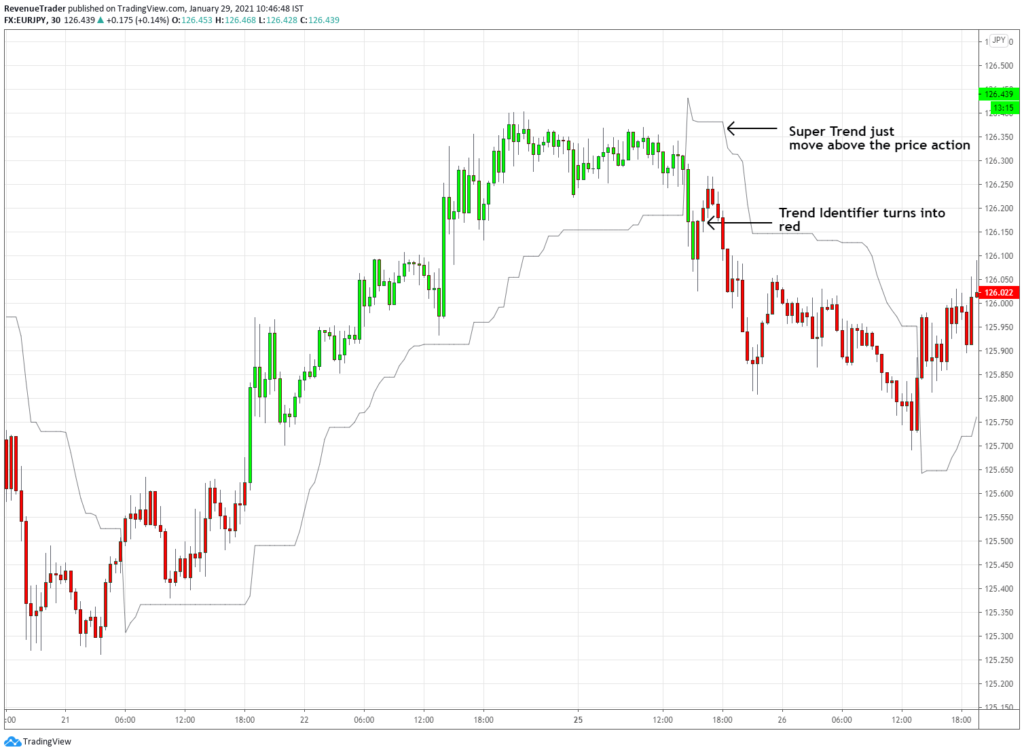
Observer the above chart. Noticed any change?
The way candle changed it’s colour is totally changed. In conventional candlesticks, the color is change in every candlestick base on how it closed (bullish or bearish).
But in the above chart, when buyers are strong, candlesticks are green and when the sellers are strong candlesticks are red. That is the Trend Identifier worked in the backend.
Now as a reversal trader, I use this indicator to identify the shifts in trends. For example during an uptrend where the green candles are printing, a colour change into red indicate bullish to bearish momentum shift or in another word it is shift from uptrend to downtrend.
That is what exactly happened in the above chart. In the above chart, first we can see that the super trend indicator started to plots above from price actions and after withing two candles, the trend identifier also turns into a red indicating momentum shift of the on going uptrend.
For me this is the best time to catch the reversal.
With that this is how I use these two indicators to find out mometums shifts and with these two indicator there no early or bad entry, only optimal reversal trading entries.
With that let’s move into the last step and after that let’s talk few trade examples to clarify these steps.
Step 06 – Trade Execution
This is where we integrate all the steps we’ve taken so far to bring them into action. Now the trade setups are being established, and all we have left is to place orders and actually ride the reversal. Let’s clarify this last step by making use of the few trades we have closed.
Now let takes the GBPJPY 1 hour chart below and talk about trading scenario step by step.
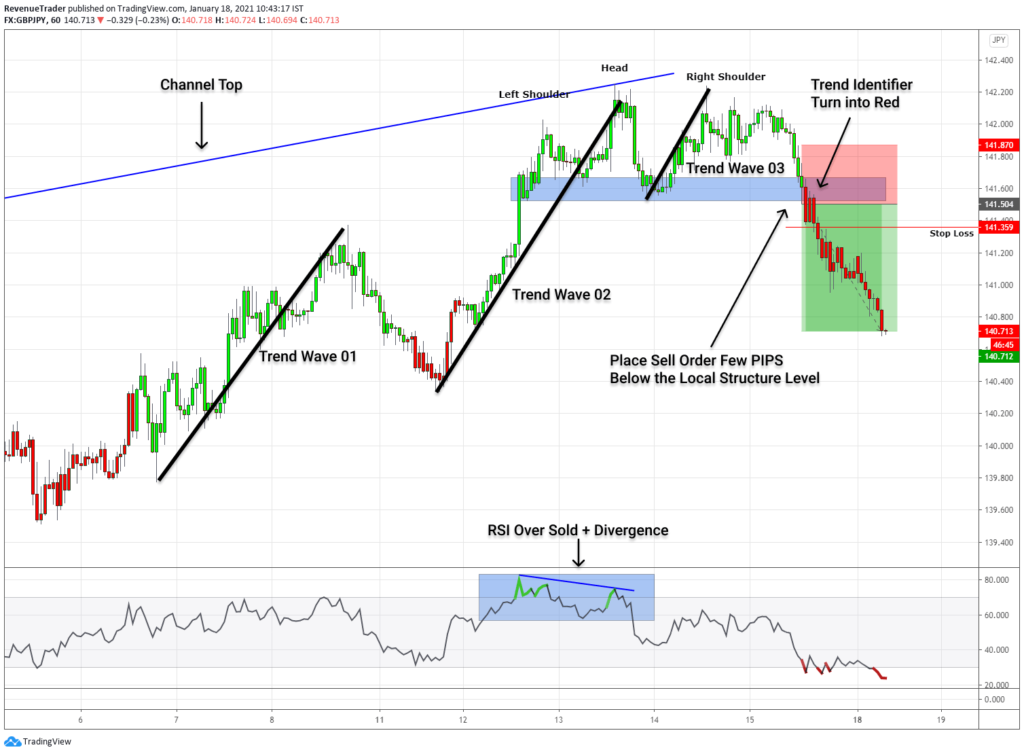
Step 01 – This is where we look for an established trend. In the above GBPJPY chart, we can see that the market was in a strong uptrend with price making higher highs and higher lows.
Step 02 – Now have a look at where is the trend stop. It stops at the channel top which is coming from the higher timeframe. Also at the same time, the RSI indicating overbought with divergence. These two trading confluences together make this area a higher probability area.
Step 03 – Let’s observe the trend a little bit. Have a look at the first and second trend wave. They are big extension moves which indicate strong bullish momentum. But have a look at the trend wave 03 – it is considerably small when comparing to the other two waves and also it failed to form another higher high. This price behaviour indicating lack of bullish momentum.
Step 04 – Finally because of the lack of bullish momentum at the area we chose on step 2, the price action eventually formed a head and shoulders pattern confirming the higher probability of trend reversal.
Step 05 – This is where we looked for a momentum shift, in order to prevent us from getting caught in a retracement. Have look at the trend identifier, it turns into red which allows us to ride the trend.
Step 06 – Finally we had a trade with all the step are aligned and now it is a matter of executing the trade. Simply we placed a sell order and price filled us and hit take profit in a matter of a single trading day.
Now I think you got the idea of why these steps are important. The main benefit is that it helps us to stay consistency by following this systematic trading approach.
With that here is another trade, which is a breakeven trade.
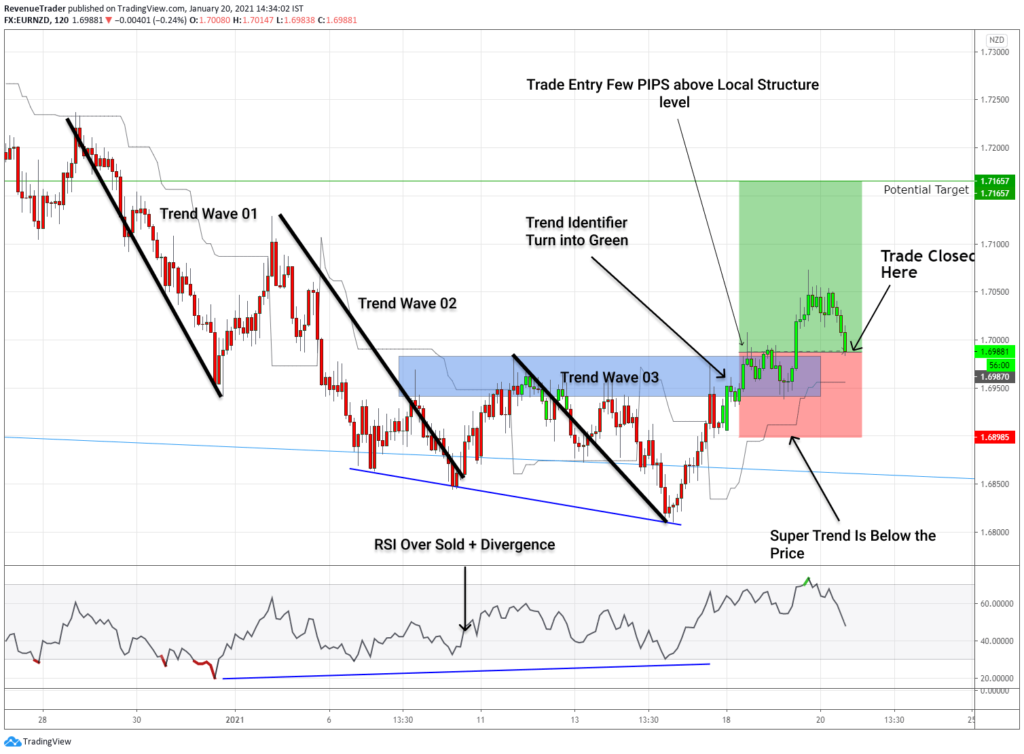
Now you can explain this trade, right? With that here is another trade which not worked in our favour.
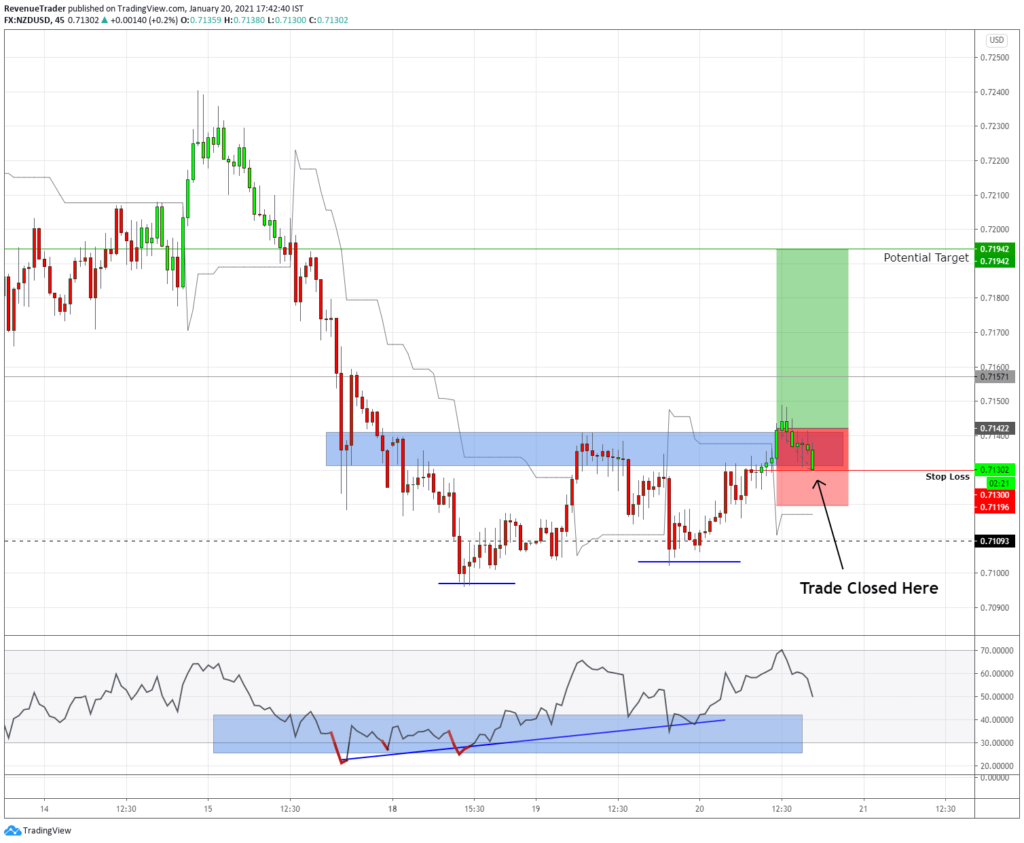
As Mark Douglas said in his book, the market is random distributions of winners and losers. So the same thing is applied for this trading strategy as well.
So this is not a magic bullet nor a get rich quick trading strategy. Keep that in mind when you use these trading techniques we talked in this article.
With that, I hope you learned something valuable from this post. If so, give us small support by sharing this with your friends.


