In Trade Revenue Pro, One of our primary trading approaches for trading in the lower timeframes is the intraday reversal trading strategy.
The main advantage and the main reason why lots of traders in our community is obsessed with this trading strategy is the trading tactics and approaches we use in this strategy.
These trading tactics will allow anyone to capture trend reversals at the perfect time with a huge profit potential while still limiting the losses.
Here’s an example of a recent intraday reversal trade we made.👇

By the end of this article, you will learn the exact methods and trading techniques we use, to identify high probability intraday trend reversal trading opportunities like this one.
Specifically here is what you will learn…
- What is an intraday reversal trading strategy and how can you benefit from it?
- Trading methods and techniques to identify and catch the trend reversal at the right time.
- A method to cut your losses early and a way to maximize your profit potential.
- Finally, You will break down a few trend reversal trade examples with us.
Are you ready?
Then Let’s Begin…
What Is Intraday Reversal Trading Strategy?
Before going into the strategy part…
What is the meaning of trend reversal?
In a nutshell, a trend reversal is when a price trend changes its overall direction.
For example, a reversal on an uptrend would be to the downside, and a trend reversal would be to the upside in a downtrend.
Now by using this trend reversal trading strategy, we are going to catch those trend reversals which occur on lower timeframes such as 1 hour and 30 minutes.
To do that we are going to use certain trading techniques and indicators, most of the time we will combine these indicators with the trading techniques to come up with perfect trade setups.
Here is what we are going to use;
- RSI indicator – to identify high-value areas in the market.
- Price Action – to identify the current trend.
- Reversal Chart Patterns – to identify weaknesses of the ongoing trends.
- 50 EMA – to identify the momentum shift.
- Market Structure – to catch the trend reversal at the right time.
Next, we will use a checklist to monitor our trade opportunities and it will help us focus on the most important trade opportunities so that you will never miss a trade opportunity.
With that let’s see how to identify trend reversal in intraday by using a checklist
Related Reading: Reversal Trading Strategy – 5 Step Process to Identify Trend Reversals
How To Identify Trend Reversal In Intraday
As I told you earlier, we will use a checklist to find reversal trade opportunities and the same checklist will help us to monitor our trades as well.
Here is the checklist. 👇
Figma checklist
Think of each element of this list as steps we should follow to identify intraday reversal trade opportunities.
Next, what are the benefits of following this checklist?
- Your approach to the market will be the same. This means the checklist prevents you from trading in No Man’s Land and it always encourages you to find trades with the highest probability.
- No panic or confusion. This means you don’t have to be concerned about trade validity; if all of the criteria in the checklist are met, you can simply execute your trades without second-guessing them. This simplifies the execution process.
- You can conveniently keep track of your trades. This mean, you can use the checklist to prioritize your trades. Trade opportunities that meet all of the criteria should be closely monitored, while those that do not are still trading opportunities but are not ready for execution.
In a nutshell, the whole purpose of the trading checklist is to make your charting routine easier to follow and to ensure that you take the same approach to the market every day.
With that let’s talk about these steps in the checklist in a step by step manner.
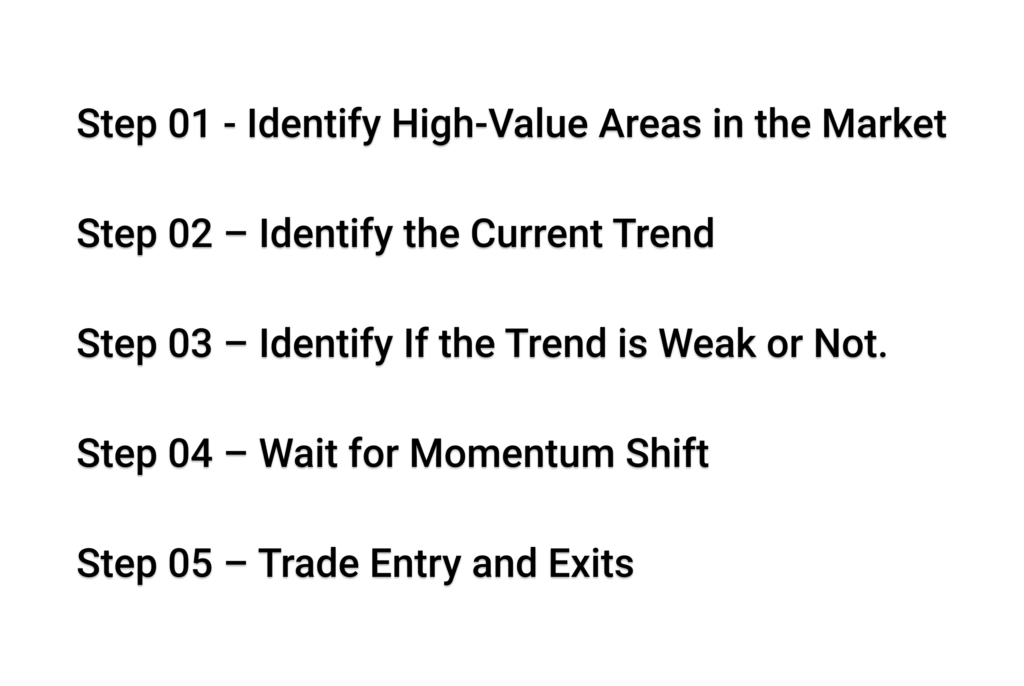
Step 01 – Identify High-Value Areas in the Market
We cannot place reversal trades everywhere in the market, right?
For that, we need a high probability trade location.
But why?
Because we can increase the probability of the trade working out in our favour by simply trading only in the high-value areas.
Now, how to find these high-value areas?
This is where RSI OB/OS and the RSI divergence comes into play.
For example, if we can identify RSI over-bought with divergence during an uptrend, that would be a high-value area to look for a potential trend reversal trade.
Okay, have a look at the chart below.
According to the above chart, you can see that the RSI shows an overbought signal and divergence. This is an indication of a possible trend reversal.
So this is how you can identify high probability areas in the market and avoid all other low probability areas.
Okay now we are in an area of value, right?
With that let’s move on to the next step and see what more we can find in the above chart.
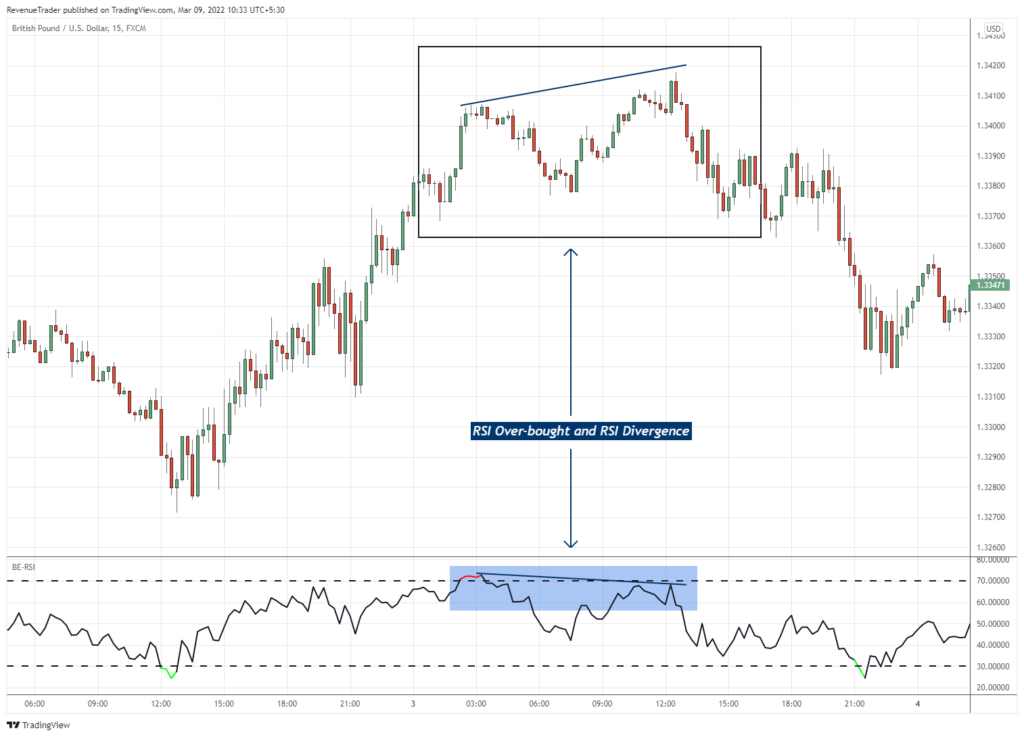
Step 02 – Identify the Current Trend
Let me ask you a question.
What is the whole purpose of this intraday reversal trading strategy?
It is to catch trend reversal on intraday timeframes, right?
Which mean an ongoing trend in mandatory. without a trend, there is no trend reversal.
That is what we are going to do in step 02.
After identifying the high-value area (step 01) we need to confirm that we are in a trend or not.
If we are in a trend, then the trade idea is still valid. But if not, the trade idea is invalid even if we are in a high-probability area.
Now the question is how to know whether we are in a trend or not. This is where price action comes into play.
If the price makes a series of high highs when moving up, it is considered as an uptrend and if the price makes a series of lower lows when moving down it is considered as a downtrend.
Now let’s see if we are in a trend or not by using the same chart we use in step 01.
According to the above chart, you can see that we are indeed in a strong uptrend with the price action making a series of higher highs.
Which mean both step 01 and step 02 are fulfilled.
So far we know that we are in a strong uptrend and also we are in a high probability area where the potential for the trend reversal is high.
Now what?…
Now is the time to analyze whether this trend still has enough momentum to move higher or if it is becoming weaker.
Step 03 – Identify If the Trend is Weak or Not.
As the topic says this step is all about identifying the weaknesses of the current trend.
We are going to use 4 reversal chart patterns to identify the weakness of the current trend.
Now, what are the reversal patterns we are going to use?
- Double Top and Double Bottom Pattern
- Head and Shoulders Pattern
- Break of the Local Structure Level
- Momentum Drive Pattern
I hope you’re familiar with these chart patterns. If not please go ahead and read the article: Reversal Trading: The Definitive Guide.
If we can identify one of these patterns at the high-value area which we found on step one, it means we are in a weaker trend and if not we can conclude that the current trend still got some momentum to move higher.
Let’s take the above chart and see if we can find any reversal chart pattern on there.
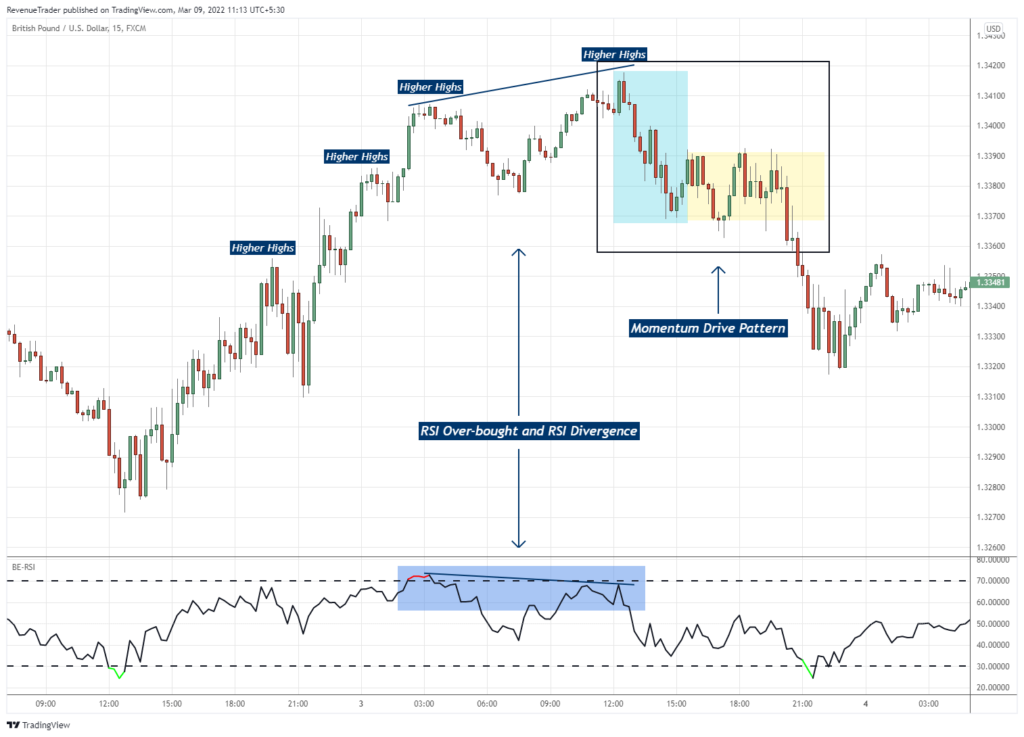
Now have a look at the above chart, on there we can see that a Momentum Drive pattern formed right at the high-value area which indicates the weaknesses of the current trend.
So which mean we have a reversal chart pattern as well.
Now think about, first three steps are in our favour which means we are in a high-value area and also we got a weaker trend which indicates the potential of a trend reversal is highly possible here.
Now it is time to wait for momentum to play out in our favour and the next step is all about that.
Step 04 – Wait for Momentum Shift
This is simple.
All you have to do is to wait until the price break below the 50 EMA.
If the price break below the 50 EMA after identifying the reversal chart pattern (step 03) it indicates that the momentum is in your favour and if not you have to wait until the price breaks below 50 EMA.
Now let’s see if we have a momentum shift in the above chart.
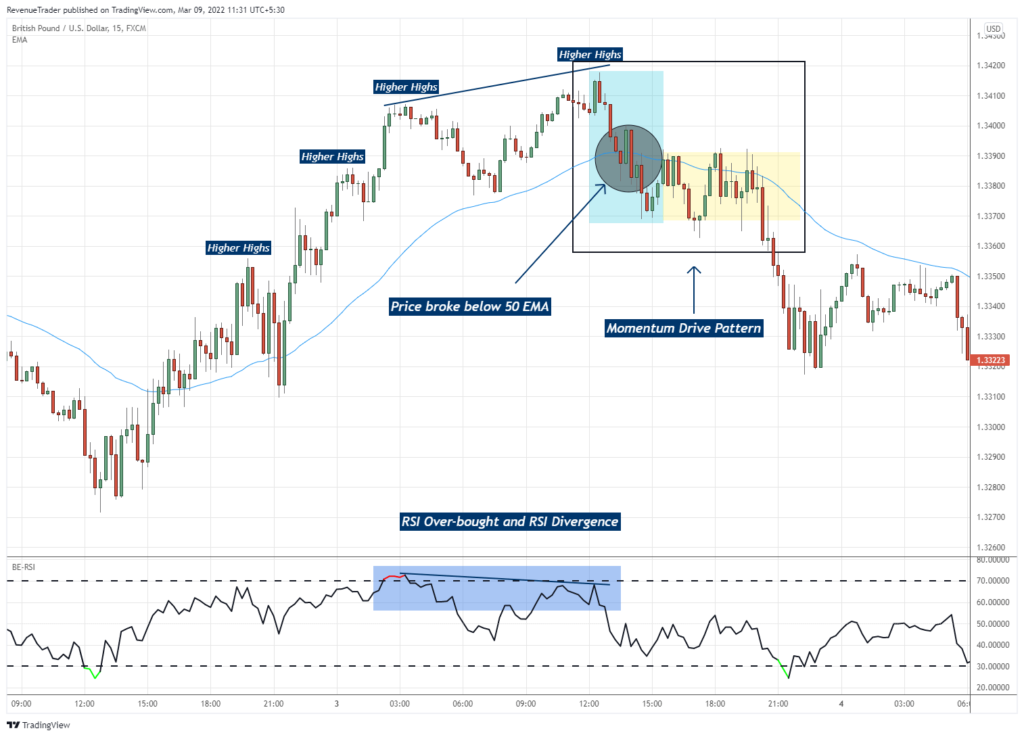
According to the above chart, we can see that the price broke below the 50 EMA and it broke that before the pattern even begin to form.
This is the momentum shift and this indicate that we have momentum in our favour or simply the probability of the momentum is in our favour.
By the completion of step 04, we have enough trading confluences to support our trade idea, and in this case, it is an intraday trend reversal trade setup.
Also, the more confluence increases our confidence as well.
Now it is time for the final step and it is all about trade entries and exits.
Step 05 – Trade Entry and Exits
Now you know how to identify high probability intraday reversal trade setups, right?
Now it is time to place orders.
But how we are going to do that?
This is where the Local Structure Level comes into play.
Wait, what is the local structure level?
Well, a local structure level is a zone in the chart drawn by connecting the latest or short-term market structure.
Break of this zone will help us to time our trade as well it help us to place stop levels as well.
Now let’s take the same chart we break down in the above steps and see how to draw and local structure level and place a sell trade.
Have a look at the chart below.
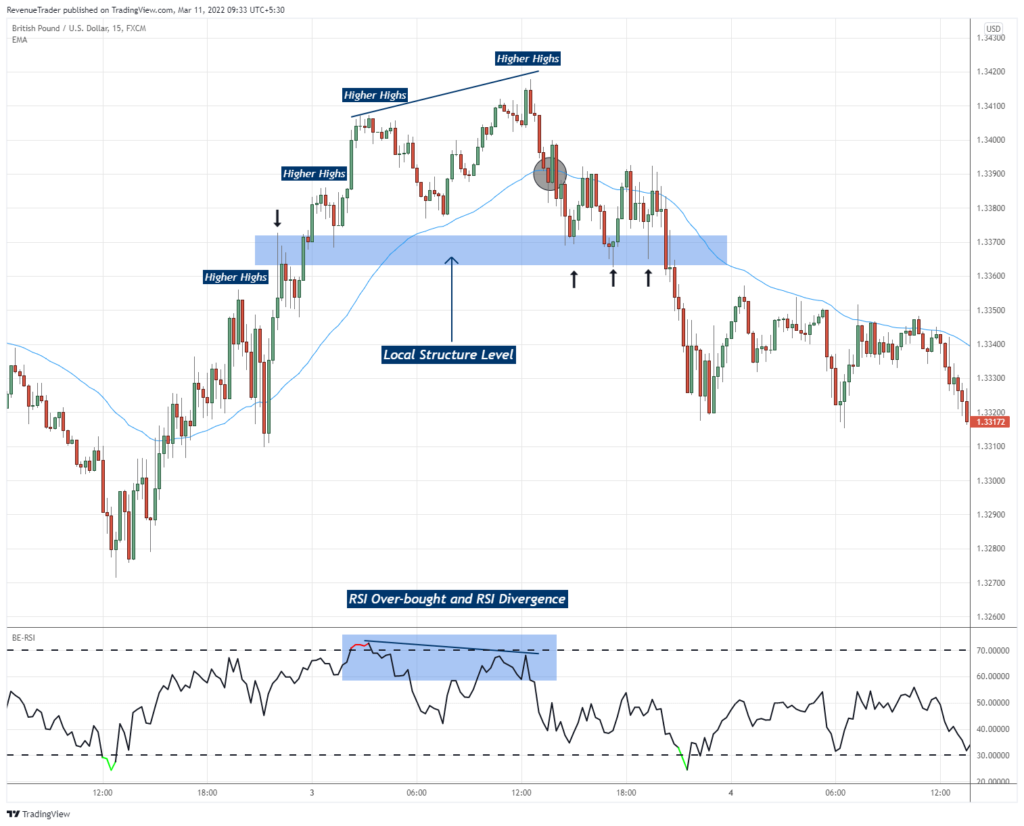
According to the above chart, you can see that by connecting all the short term structure levels (black arrows shows the structures), we were able to draw a zone where the price action has a high tendency to react.
Since the price action strongly reacts to this zone, the break of this zone is significant, and that is what we use to place our sell order.
Have a look at the chart below.
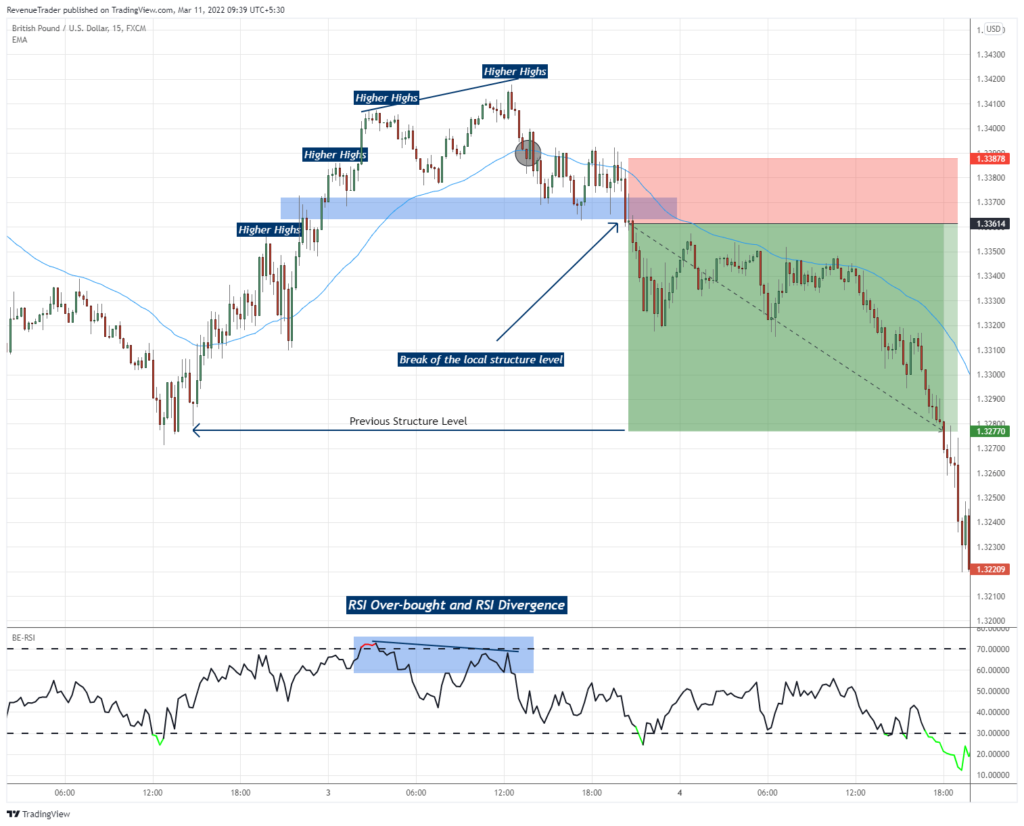
According to the above chart, you can see that we placed a sell order as the price broke below the local structure level.
This is the power of the local structure level. This makes our execution process so easy.
Next, you can place your stop-loss a few pips above the 50 EMA.
And…
You can place the take-profit level at the previous structure level.
Okay, this is the whole process you need to go through in order to place intraday reversal trades that have a higher potential to works in your favour.
This may seem hard on the first try, but believe me, you will get used to it with practice.
For the moment you know how to focus on quality reversal trades and execute. In the next chapter, we will talk about how to cut losses if the trade is not going in your favour.
With that let’s move into the next chapter.
Here is a practical article on reversal trading: Reversal Trading: 5 Practical Entry Strategies
The Art of Cutting Losses Early and Letting Winners Run
Think about it for a moment…
By following the above steps, you already know how to focus only on higher probability trade setups, right?
Now, what if we can cut losses on those trades if it does not move in our favour, and let the trades run if the price move in our favour?
By doing that, quality and the outcome of the profitable trades will impact the growth of our trading account and more often we can see a steady growth of our equity curve.
And this is exactly what you will learn in this chapter.
First here are two main methods we use to cut losses in our trades.
- 4 Closed Candle Method – this is the first method and in this method, you will wail until 4 candles closed right after you placed a trade and as the fourth candle closed you cut 50% of the losses by moving SL to 50%.
- Breakeven Method – This is simple. all you have to do is to move your SL to breakeven when the trade moves in your favour and hit the 1R profit level.
Have a look at the chart below.
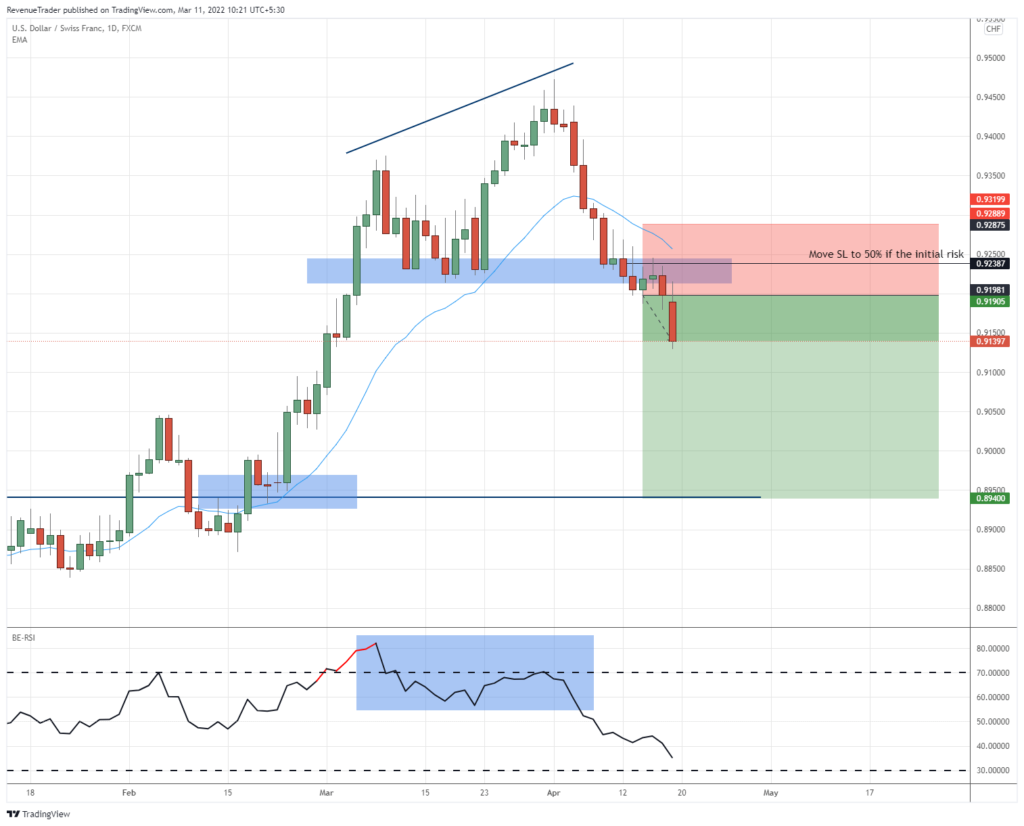
According to the above chart, you can see that we place a sell order as the price broke below the local structure level.
Also, you can see that 4 candles were closed after the trade entry and now we should cut 50% of the losses according to method one.
If you observe the above chart, you can see that we did cut the losses by moving SL and now we have only half of the initial risk is available.
The next question is, Why Should We Cut Losses After 4 Candle Formation?
The thing is we are trading intraday reversals. Which mean we expecting a strong and quick reversal after the price broke below the local structure level.
And if we did not get that strong reversal momentum even after the closed of 4 candles, the probability of the trend reversal will get low and therefore we should cut losses by half of the initial risk.
In the next method, you should move your SL to breakeven when the price reaches 1R profit. Have a look at the chart below.
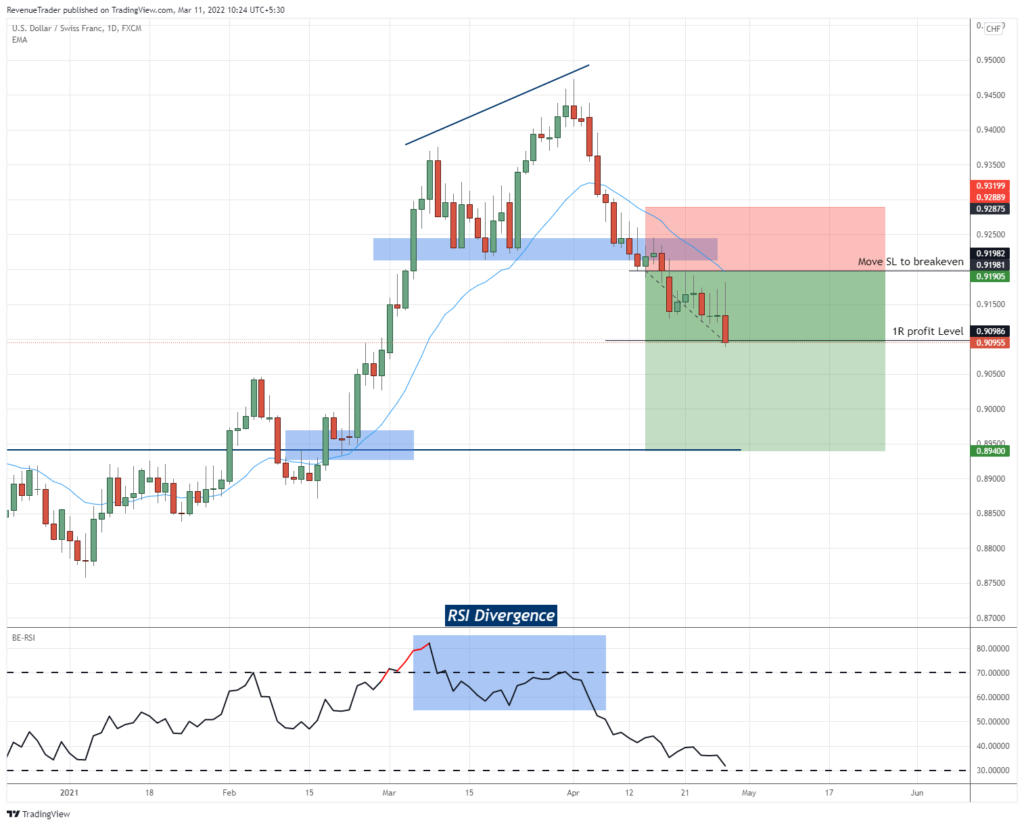
According to the above chart, you can see that we move SL to breakeven as the price reached the 1R profit level.
Now, this is how you are going to make your trades risk free.
Next, after cutting the losses, you should let your trade run until it reaches the take-profit level or the SL.
By doing that you can maintain a positive risk to reward ratio which leads to steady growth of your trading account and don’t let your emotional impulses affect a winning trade.
This is how you manage your trading in the intraday reversal trading strategy.
With that let’s move into the next part and breakdown a few trade examples so that if you have any cloudy thoughts about the steps we talked about earlier, you can clear them
Related Reading: A Complete Guild to Risk Reward Ratio & R-Multiple in Forex Trading
AUDNZD Long Trade – Double Bottom Leads to Quick Reversal Trade
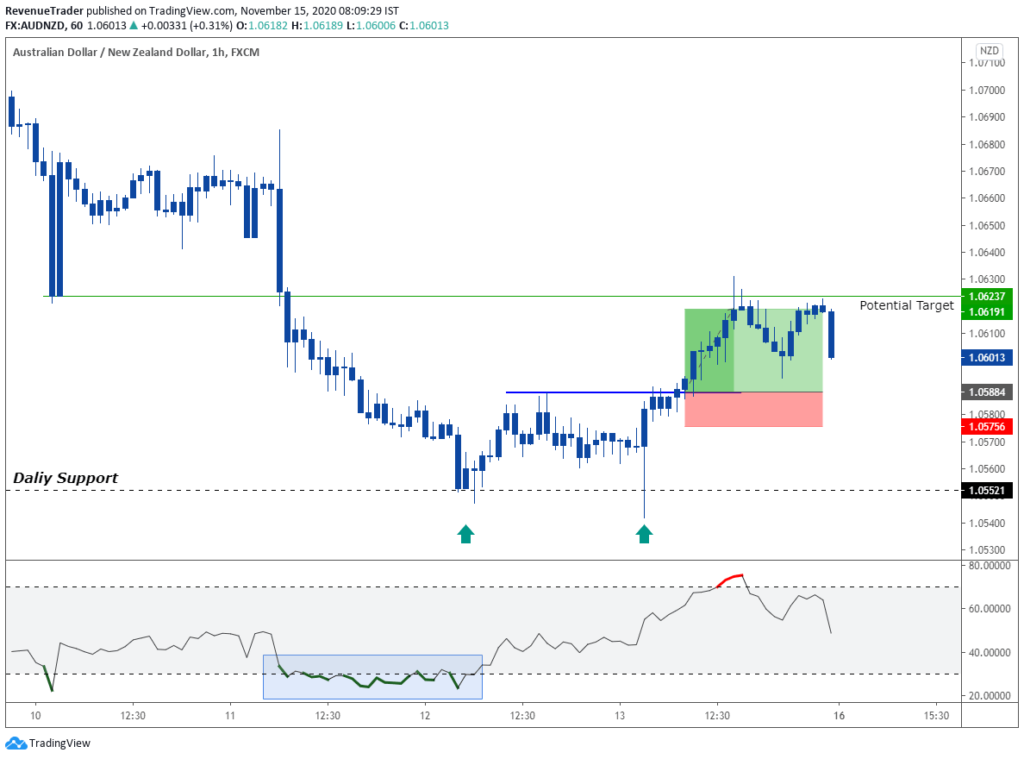
According to the above chart, you can see that price formed a double bottom at support level comes from the daily chart. Additional we had RSI over-bought and RSI divergence. After we identified all of these confluences we wait for a break above the local structure level to place our orders. As we expected price ended up breaking above the Local structure level and easily hit our target in no time.
CADCHF – Perfect Combination of the Ascending Channel & the Divergence at the Daily Support

Okay, have a look at the Ascending channel formed around the daily resistance level. This indicates buyers are losing their control over the market with this we also had RSI divergence. Just like the previous trade, we placed our orders after price break below the local structure level and as the chart showed above, we ended up having a quick profitable trade.
Finally here are some short videos from our youtube channel.
NZDUSD Intraday Reversal Trading Opportunity
EURUSD Intraday Reversal Trade Example
If you need more trade breakdowns like these: Head over to Trade Idea Section.
Are Intraday Reversal Profitable?
Trend reversal trading can be a profitable way to trade the markets. However, like any other trading strategy, there is a correct and a wrong way to do it.
If you follow the steps we talked about in this article and practice by putting in hard work, I’m sure that intraday reversal trading will make you a profitable trader.
Also, make sure that you master your trading psychology and by doing that you can get the maximum potential from this trading strategy.
Related Reading: The Art of Cutting Your Losses Short – Forex Risk Management
Finally, what do you think about this intraday reversal trading strategy?
Let me know in the comment section.


