
You’ve probably heard the phrase “buy low, sell high.”
This is easier to say, but buying the depths and selling the top in the real market is quite challenging.
What is even more difficult is consistently picking highs and lows in the forex market.
Here’s the truth: if you’re having trouble anticipating potential highs and lows in the forex market, capturing a market reversal at the right time is nearly difficult for you.
Sure, you might catch a few reversals here and there, but reversal trading will be tough for you to profit from consistently in the long run.
So, what is that secret formula for catching a market reversal at the right time?
This is exactly what we are going to talk this article.
In this article, we going to talk about complete reversal trading strategy including topics like how to identify trend reversal, how to enter the reversal at the right time and many more exciting topics.
Specifically here is what we are going to talk about in this article 👇.
Now, before we move right into these steps, let’s define what is reversal trading and how this reversal trading strategy will function.
What is Reversal Trading?
Let’s start with the definition:
A Market Reversal Is When A Price Trend Changes Direction. A reversal on an uptrend would be to the downside. A trend reversal would be to the upside in a downtrend.
Furthermore, trend reversals are usually based on shifts in the overall price context instead of one or two candlesticks.
The chart below shows how a typical trend reversal would look.
Keep in mind that when we are talking about steps we going to use the same chart for the step. Simply we are going to break down this trade using the steps with in-depth explanations.
Finally, at the end of this article, we are going to quickly break down 4 trade examples.
With that in mind, let’s take a look at how this reversal trading strategy we’ll be discussing in this article can help you achieve consistent gains while only having minor drawdowns.
What is this Reversal Trading Strategy & How it Will Help You?
The simple answer is to catch big swings or, to put it another way, to catch the trend as early as possible.
Is that all? No!
There are lots of advantages that come with this reversal trading strategy.
Specifically, let’s talk about 3 major areas that this trading strategy will help you.
- Effectively Pick Market Highs and Lows
As I said previously, picking the market high and low is not an easy thing to do. That is why we create a rule-based method to easily identify those highs and lows. We will talk about this in the first step.
- Trade Timing
This is why I love this trading strategy. By following rules and engagement in this strategy, we will be able to catch the market reversal as early as possible so that we can go for huge returns.
- Cut the Losses
Cut losses early and let profit run. This is what they said and by using this trading strategy we will be able to do exactly that. Simply by using this strategy you will be able to gain massive profit while still minimizing the losses.
These are the three primary advantages of this trading strategy. Let’s move on to step 1 now, where we’ll discuss how to identify a favourable market condition for a reversal trade.
If you want to see what a reversal trade would look like, head over to Trade Idea section of our website. On there you will be able to find plenty of trade breakdowns.
Related: January Third Week 2021 – NZDUSD Trade Idea and Weekly Trade Review
Step 01 – Determine If The Market Conditions Are Favourable For This Reversal Trading Strategy.
Step 01 is all about finding the right market condition or location.
Why trade location is important?
Well, think about this: this is a trend reversal trading strategy, right? This mean, we must wait until the end of a trend before entering a trend reversal. We won’t be able to get into the high-probability reversal movements until then.
Now, what happens if we execute trades whenever the rules of engagements of the strategy were met, without considering the market condition or location?
We will end up executing trades in trends and consolidations, right? This is a quick way to blow our trading account.
That is why trade location is important.
What would be the ideal market condition or location for reversal trading?
To understand that, first, you must understand the 4 market cycles. Have a look at the chart below.
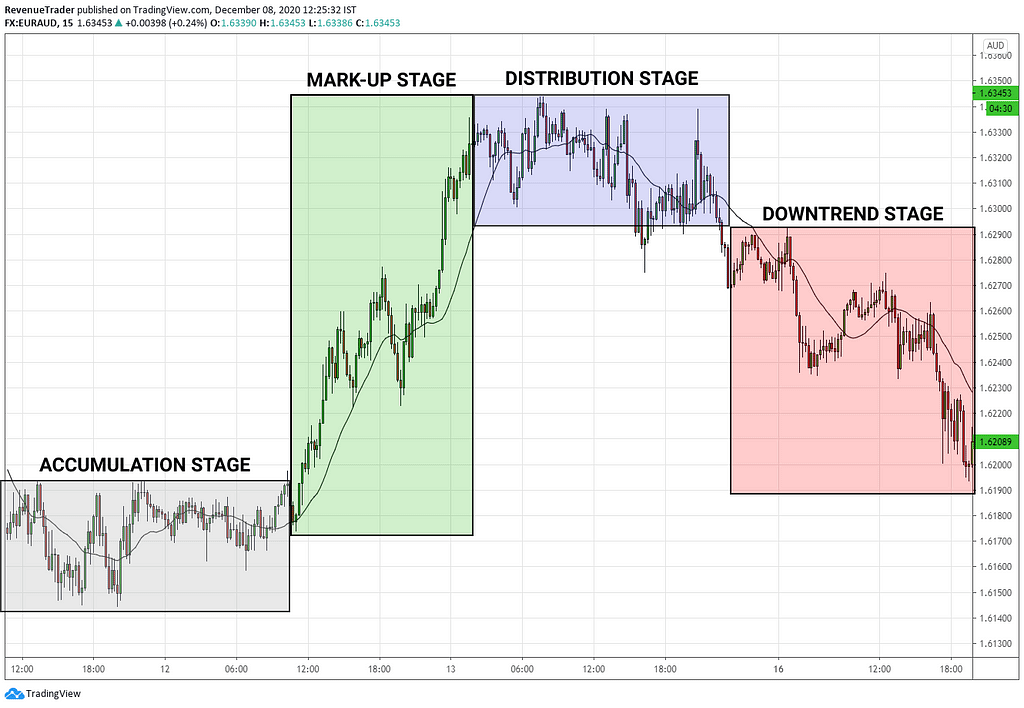
According to the above chart, you can see that the market cycles go through 4 main stages:
- Accumulation Stage – This stage looks like a range market in a downtrend. This stage often tells traders about the lack of selling pressure in the ongoing downtrend.
- Mark-up Stage – This is where the previous downtrend shifts in the opposite direction. Basically, the mark-up stage is an uptrend with price making higher highs and lows.
- Distribution Stage – This stage looks like a range market in an uptrend indicating buyers are losing their momentum over the market.
- Downtrend Stage – This stage is essentially a downtrend with price making lower lows and lower highs.
Read this article if you’re totally beginner to reversal trading 👉: Reversal Trading: The Definitive Guide
Now as reversal traders, we are only interested in finding the accumulation stage and the distribution stage. Why?
Because, in most cases, trend reversals occur immediately following that particular stage. After the accumulation stage, for example, we can expect a bullish reversal. Following a distribution stage, we may expect a bearish reversal.
Therefore when trading reversals we should prioritize our first step to finding those accumulation and distribution stages.
But, there is one question though.
How do we find these market stages (Accumulation and Distribution)?
This is where the 4-Hour timeframe with the RSI indicator comes into play.
What does that mean?
We can combine the 4-Hour timeframe with the RSI oversold and overbought to easily find those accumulation and distributions stages.
To clear understand, have a look at the chart below.
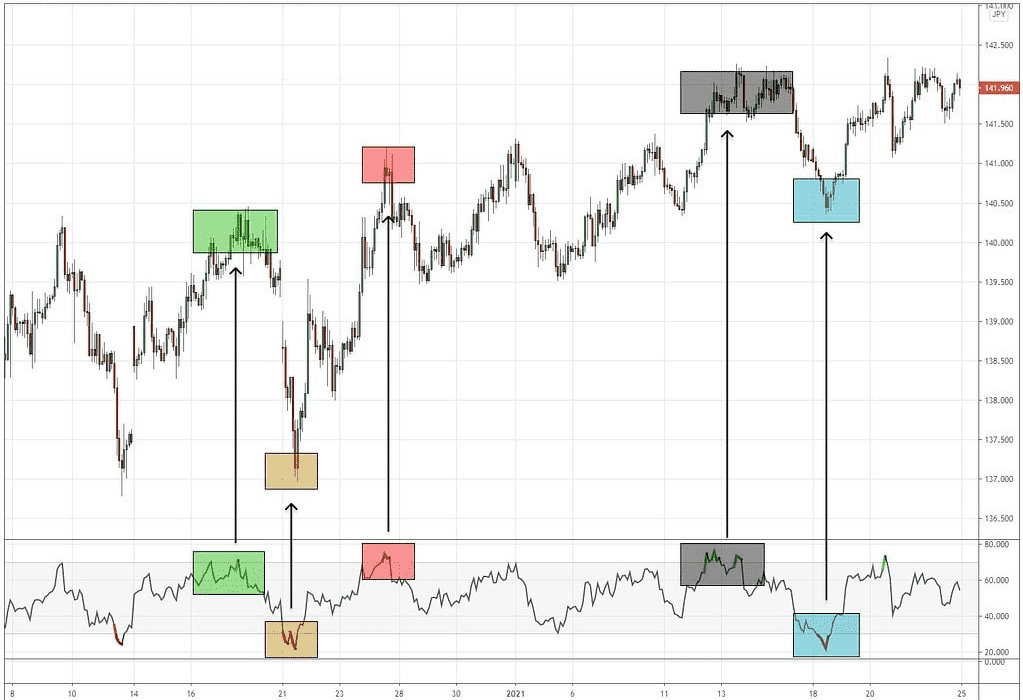
According to the above chart, you can see that every time RSI is oversold or overbought, the market is either going up or down. (Observer the coloured box in the above chart). This is an easy and objective way to pinpoint accumulations and distribution in the market.
Now that is the first step is all about, Pinpointing these accumulations and distribution AKA identifying possible market tops and bottoms.
Okay, the first step is done. You now know how to identify the correct market condition/location which has a higher probability for a market reversal.
With that let’s go on to step 2 to see if the market locations we’ve highlighted have the potential for a market reversal.
Step 02 – Identify the Weaknesses in Current Trends (rule-based and easy way to do it)
Previously we have identified the higher probability area for possible market reversal.
Now it is time to identify if there is a possibility for a market reversal in the same area. In this step, we are going to identify the weaknesses in the current trend so that we can prevent from getting caught in a retracement.
How we are going to do that?
This is where the 2-Hour timeframe and the RSI divergence comes into play.
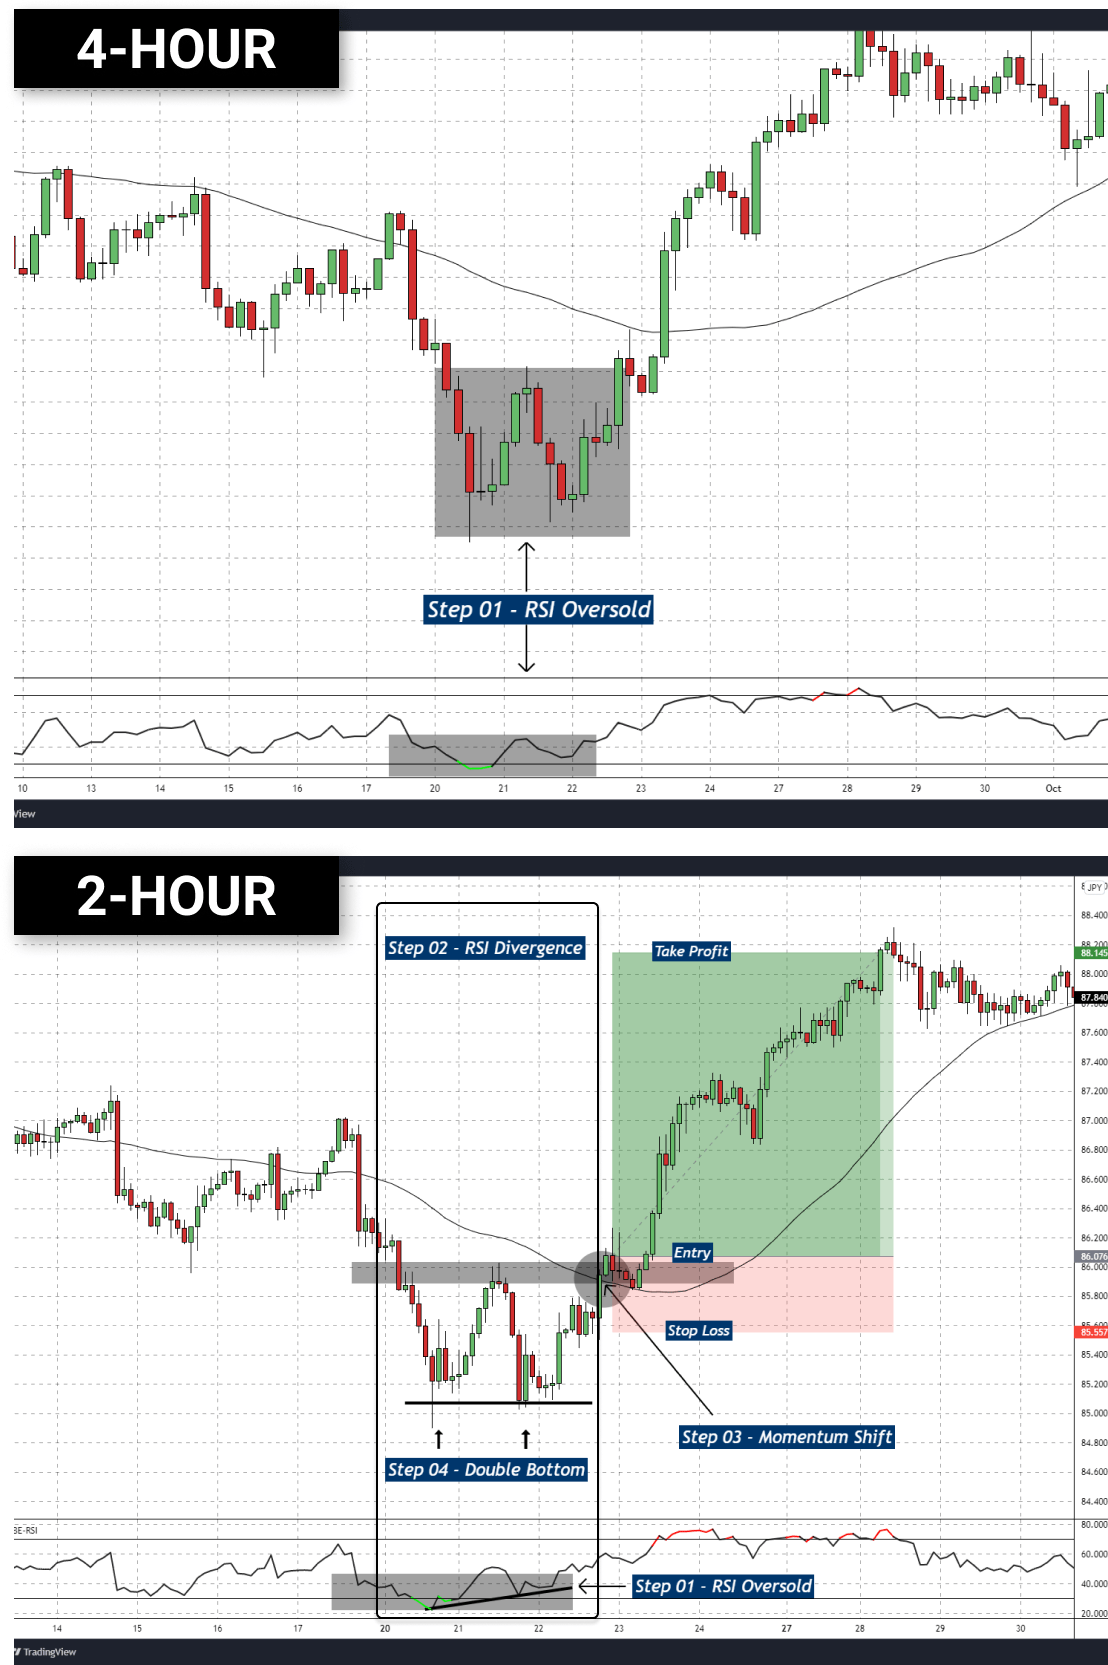
But keep in mind that, this is a step by step process. Therefore, First, we need to identify 4-Hour overbought or oversold then at that same area we need to find if there is any RSI divergence have in the 2-Hour timeframe.
To understand this clearly have a look at the chart below.
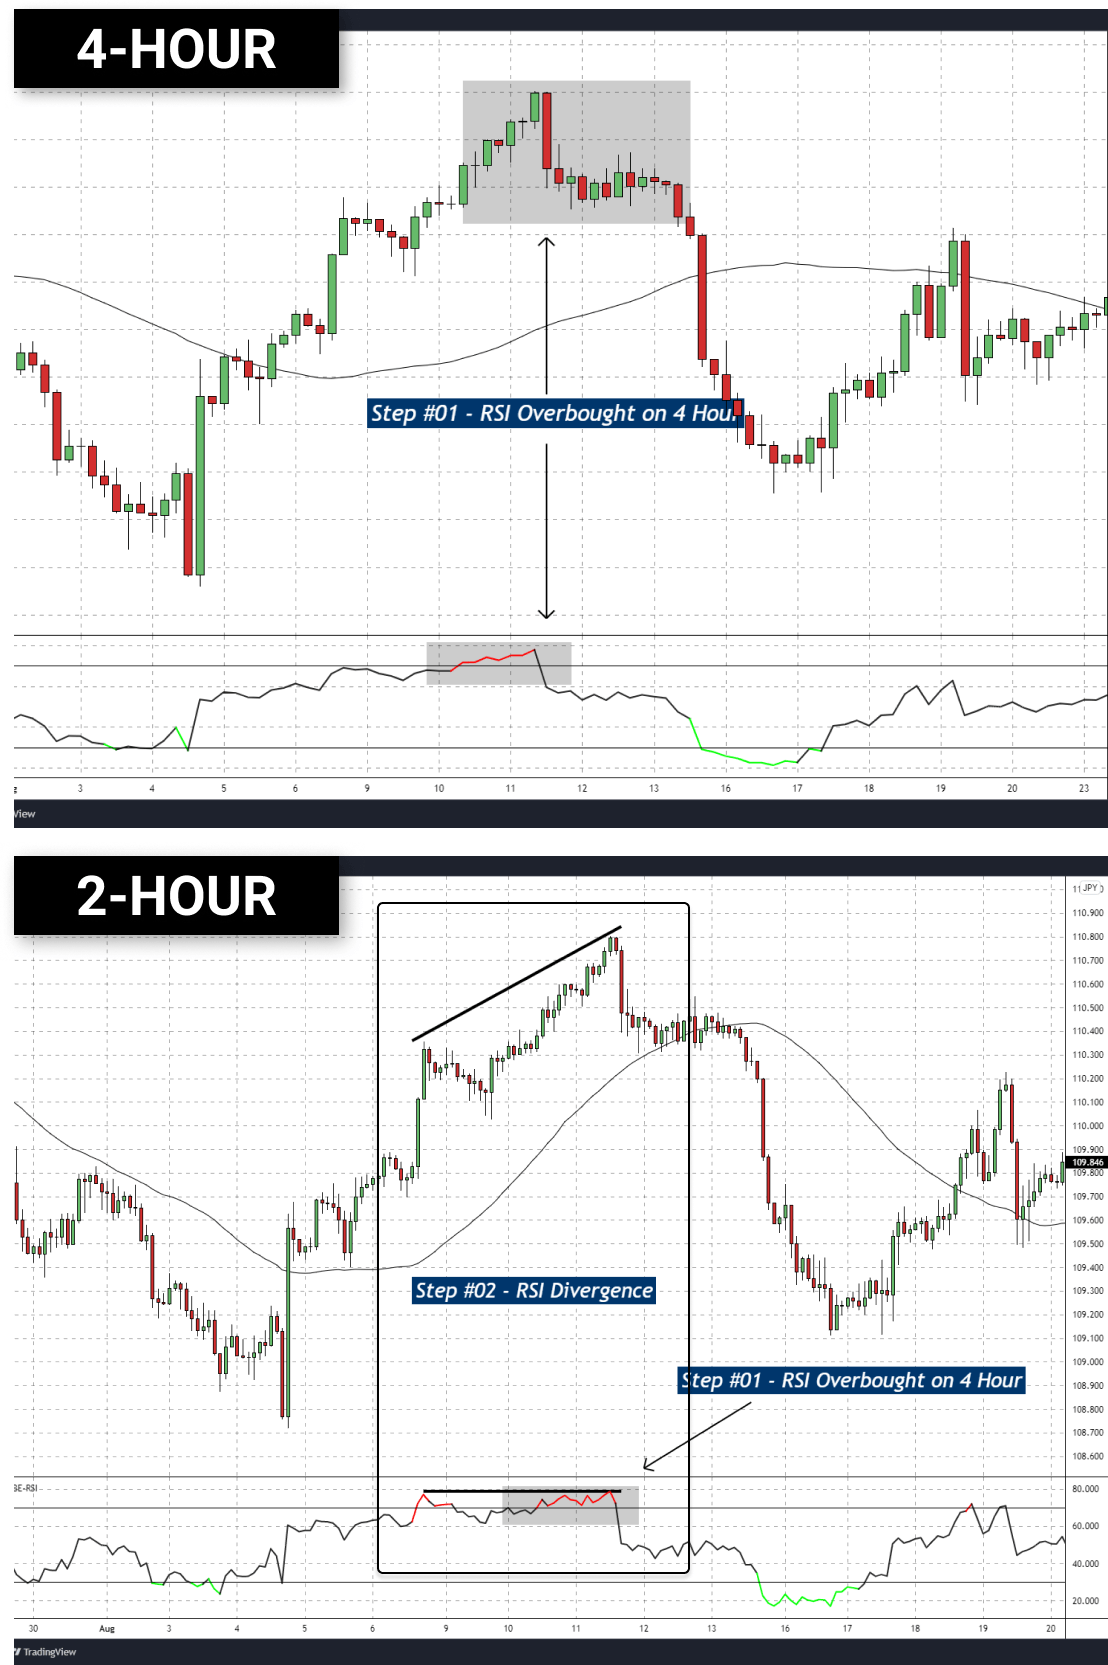
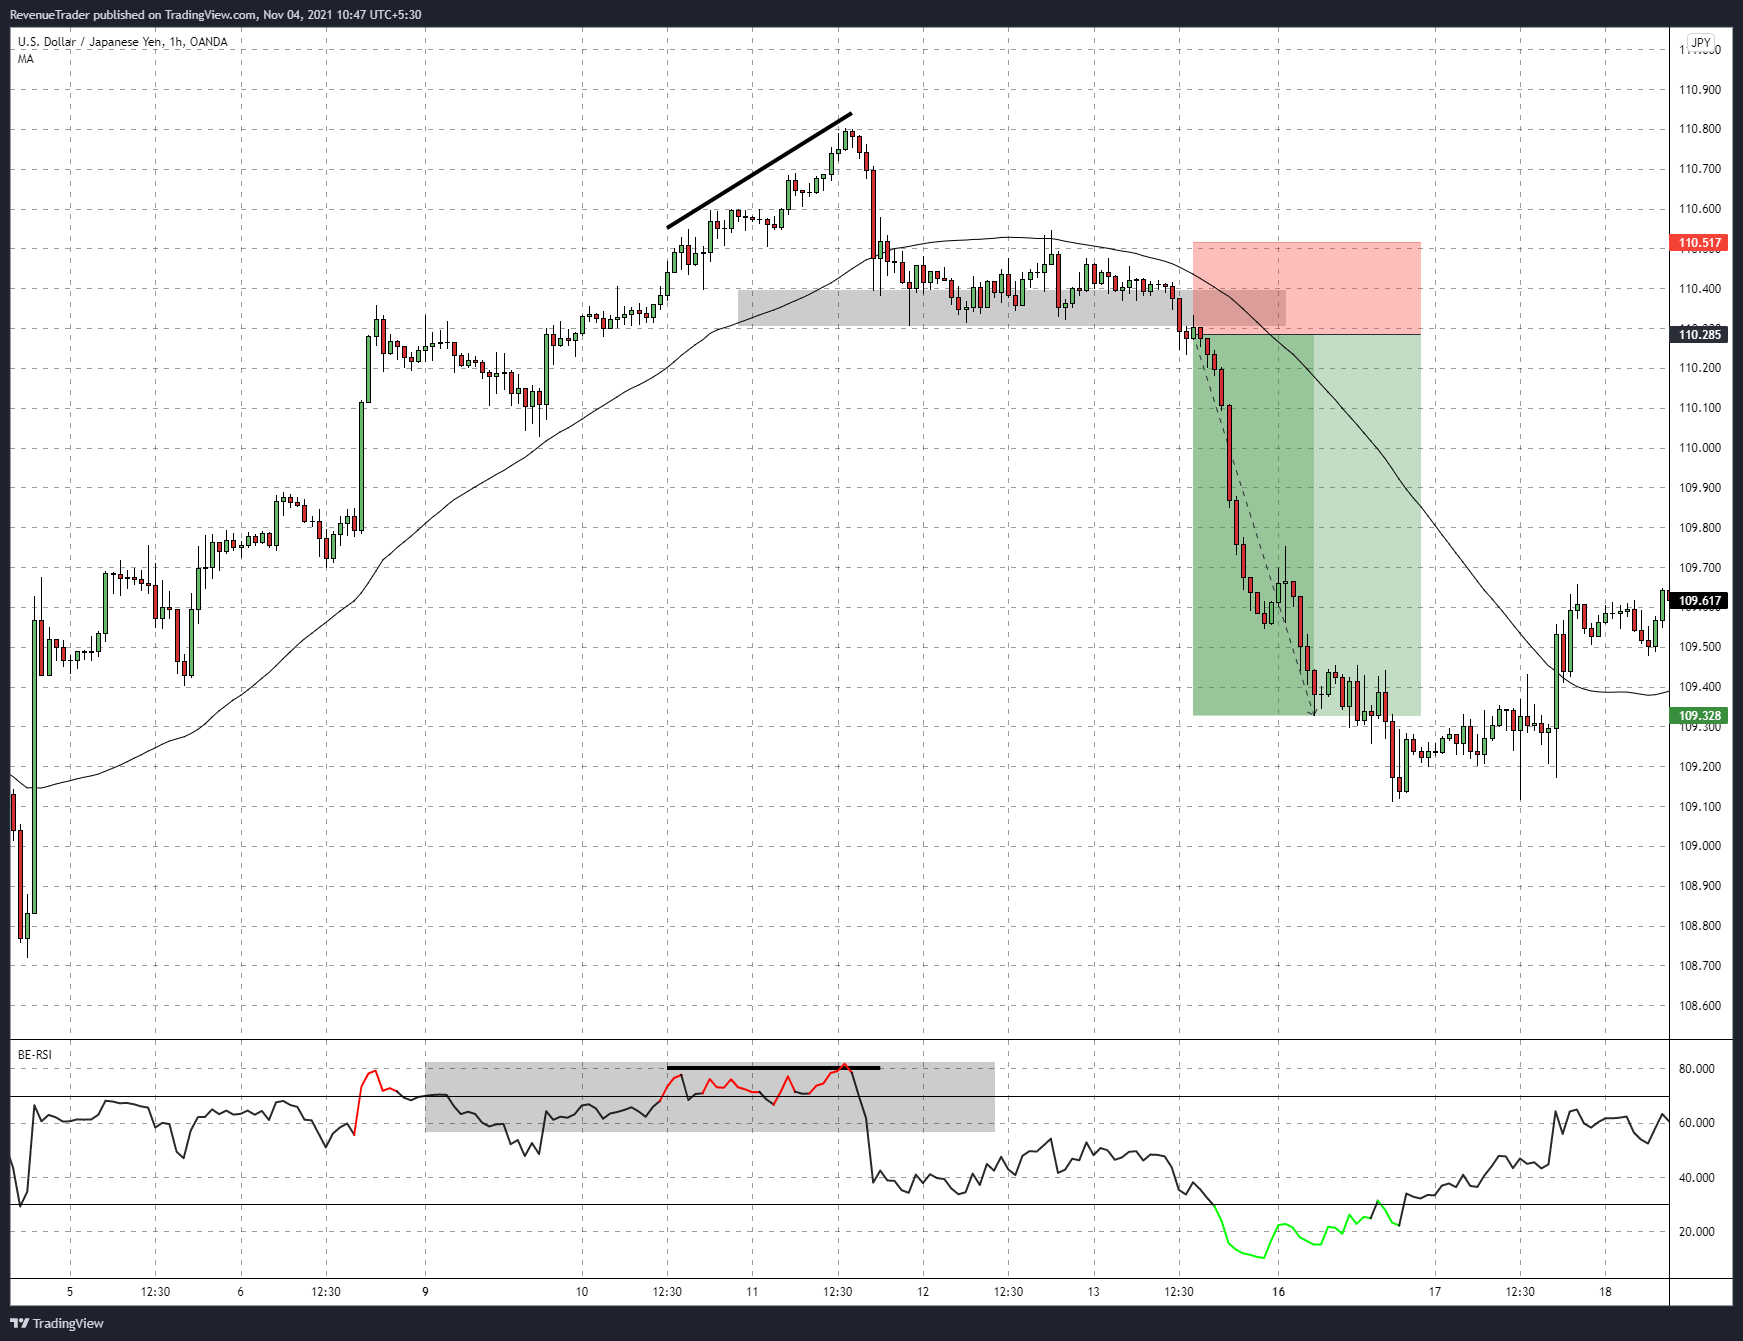
Now according to the above image, we have a 4-Hour chart above and the same 2-Hour chart below.
Have a look at the marked area on the 4-Hour chart, on there we can see that the RSI is over-bought indicating a higher probability trade location for a market reversal.
Okay, Trade Location (step 01) is done.
Next, have a look at the second chart which is the 2-Hour timeframe. Observe that chart carefully.
On there we can see that price makes higher highs but the RSI is making lower highs indicating a lack of bullish momentum. This is what we called RSI divergence.
By using that we can identify possible weaknesses of the ongoing trend whether it is an uptrend or a downtrend.
So far we have identified,
- Higher probability area for a possible market reversal (Step 01), and then
- Confirm the likelihood of the market reversal by identifying rsi divergence (step 02).
Next in step 03, we are going to wait for momentum to shift in the opposite direction so that we can look for trade entries.
Related: How to Trade RSI Divergence – 4 Practical Entry Techniques
Related: The Ultimate Guide to The RSI Indicator + Free Bonus Strategy
Step 03 – Use momentum Shift to Confirm the Trend Reversal.
First of all, what is the momentum shift?
Momentum shift is when the price shows strong opposite momentum against the current trend. When this happen we called it a momentum shift.
Forex example, assume that we are in a strong uptrend and all of a sudden price rapidly started to move against the trend indicating strong bearish volatility. When a scenario like this occurs, we can say that: “Ok, this uptrend is slowly losing its momentum, therefore we can expect a bearish reversal”.
Now how do we find momentum shift in this reversal trading strategy?
This is simple. For that, we can use 50 simple moving averages.
To be exact during an uptrend when the price break below the 50 SMA, we can call it a bearish momentum shift and on the other hand when the price break above the 50 SMA during and downtrend, we can call it a bullish momentum shift.
That is it.
BUT, There is one condition.
That is, price action should respect the 50 SMA. To find that you may need to switch between 2-Hour and 1-Hour timeframes. For example, if the price action respects the 50 SMA on a 2-hour timeframe, then no need to switch down to the 1-hour.
If not you have to switch down to the 1-hour timeframe.
Note that the lowest timeframe we are switching is the 1-hour. Don’t go below that.
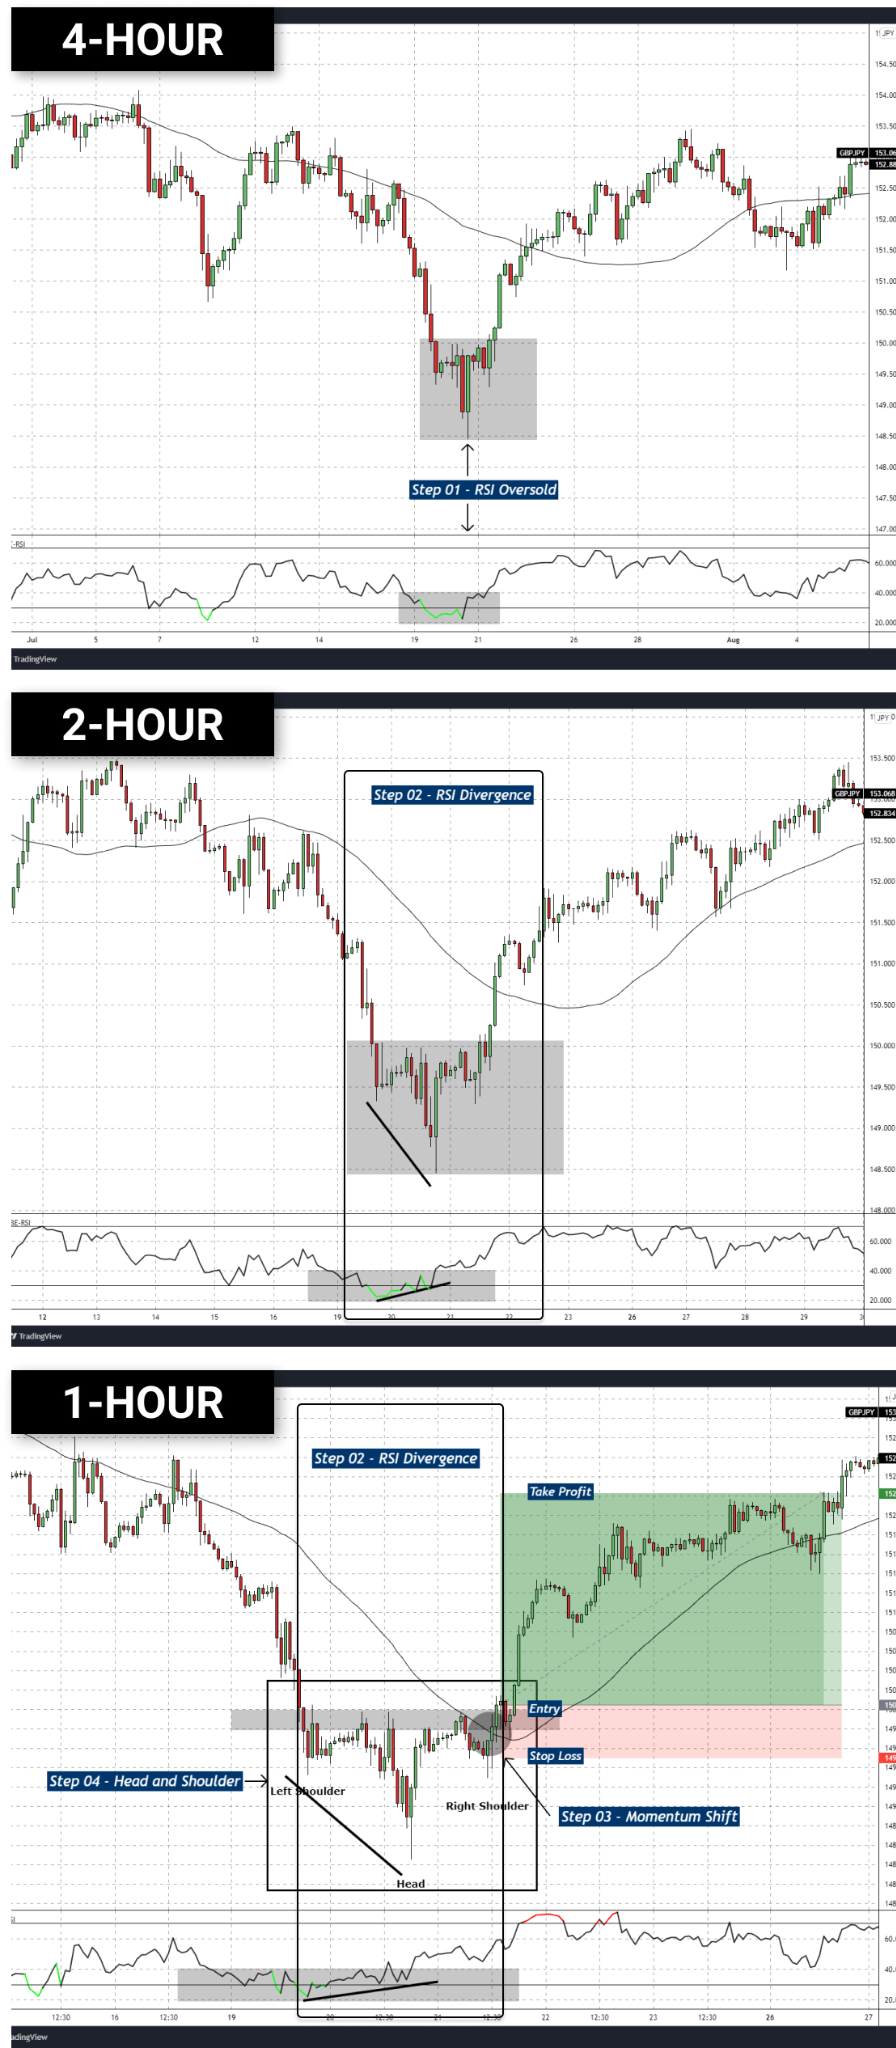
To understand this have a look at the charts below. This is the same chart we are used previously.
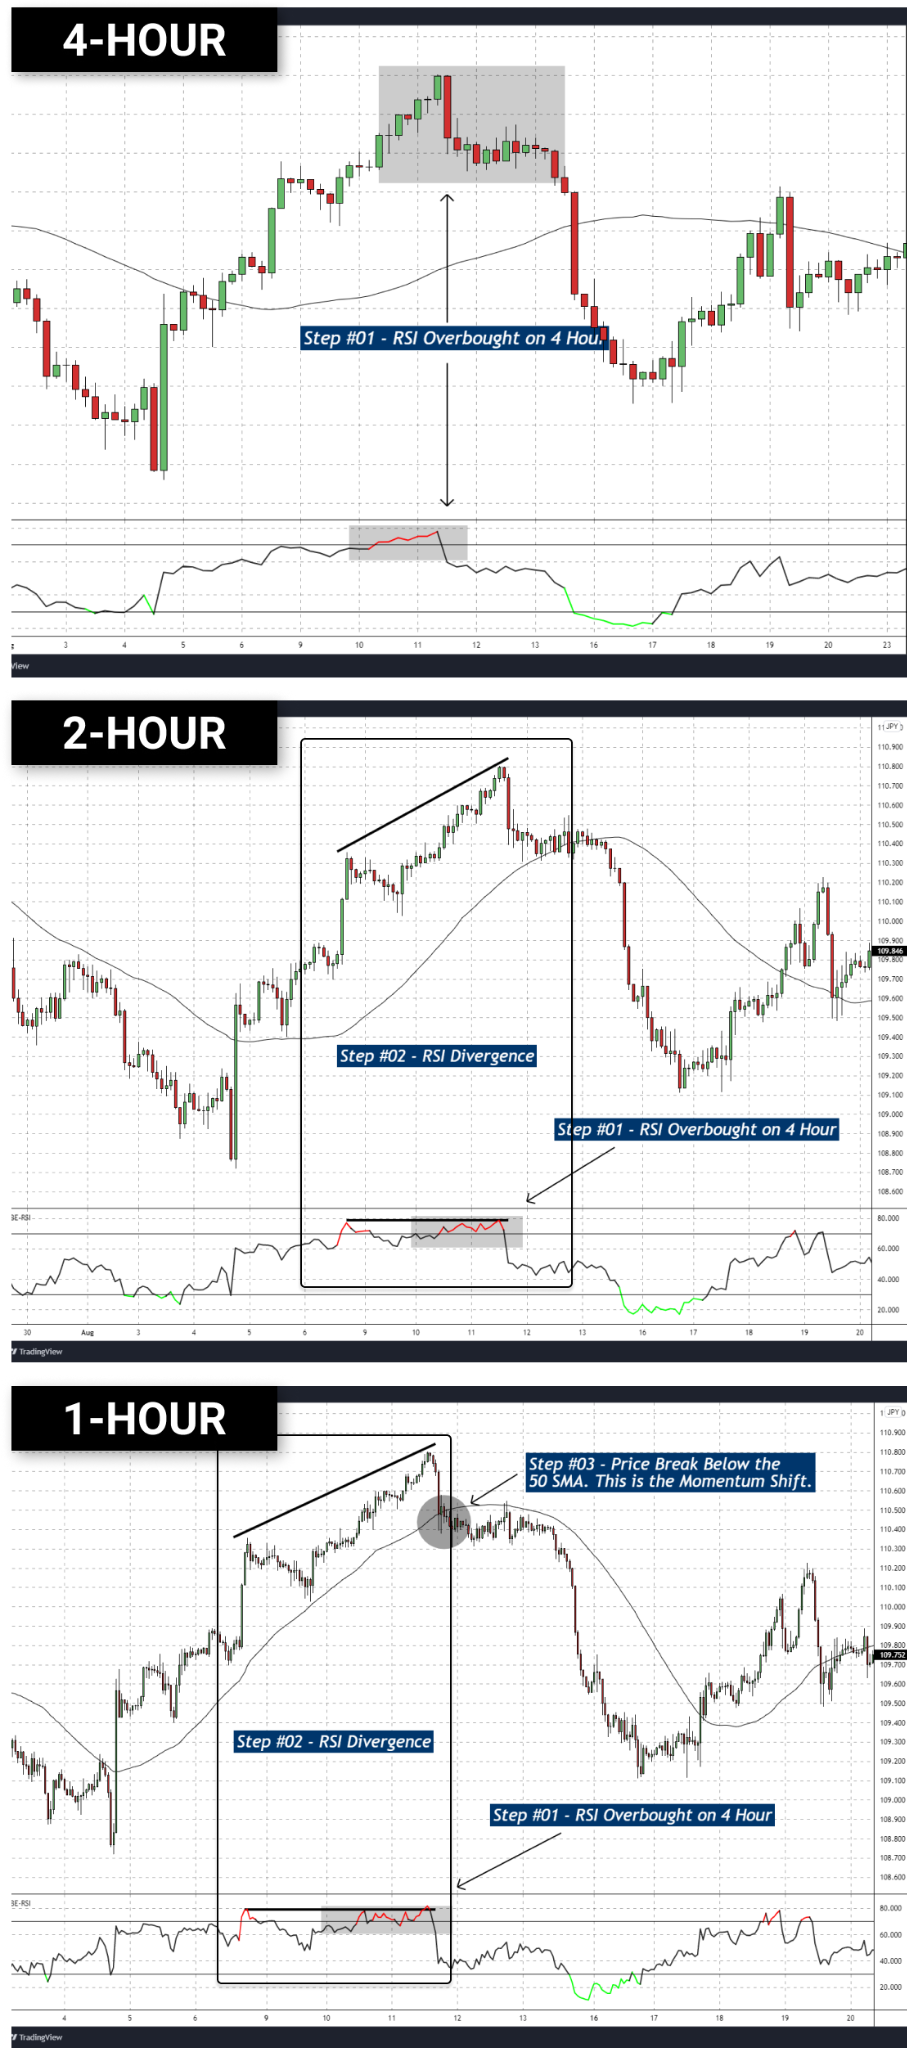
Okay, let’s break the above chart using the steps we learned so far.
On the first chart, which is 4-Hour we have identified trade location using RSI overbought and on the second chart which is 2-hour, we have identified the RSI divergence and confirmed weaknesses on the ongoing uptrend.
In this step, we have to find a momentum shift to confirm the market reversal.
Have a look at the 2-hour and the 1-hour timeframe charts. The 2-hour price is far away from the 50 SMA, which means that price action does not respect the 50 SMA on 2-hour.
But on the 1-hour timeframe price action perfectly respect the 50 SMA therefore we should look 1-hour timeframe for the momentum shift.
With that have a look at the marked circle on the 1-hour timeframe. On there we can see that the price broke below the 50 SMA. That is the momentum shift in this case and this confirms the possible market reversal.
I think you got the idea here.
Now so far we have learned how to identify higher probability trade locations, then we have learned how to find the weaknesses of the ongoing uptrend. Then finally in this step, we have learned about momentum shift which helps us to confirm the market reversal.
At the moment we have a perfect trade area aligned with multiple trading confluences that support our trade idea which in this case is a market reversal.
Next, how do we catch this reversal, AKA how do we get into the trade? This is where reversal chart patterns come into play.
In the next step, we are going to talk about highly profitable reversal chart patterns which allow you to capture market reversal early as possible so that you can go for massive risk to reward ratios.
Step 04 – How to Capture the Market Reversal at the Right Time
In this step, we are talking about trade entries, stop-loss and take-profit.
When talking about trade entries, we need an entry method with a higher probability and maximum profit potential.
How we are going to achieve this?
Well, we are going to use the most profitable reversal chart patterns to increase the odds in our favour and to cut the losses upon the trade entry, when the market is not reversing the way we want, we will also use our cutting losses method.
So that, you can still have massive profit potential with a small bunch of losses.
Now, what are the reversal patterns we are going to use?
- Double Top and Double Bottom Pattern
- Head and Shoulders Pattern
- Break of the Local Structure Level
- Momentum Drive Pattern
I hope you’re familiar with these chart patterns. If not please go ahead and read the article: Reversal Trading: The Definitive Guide.
Next, Let’s look at the same chart example again and see what is the reversal pattern we have there and how can we place our stop-loss and take-profit targets.
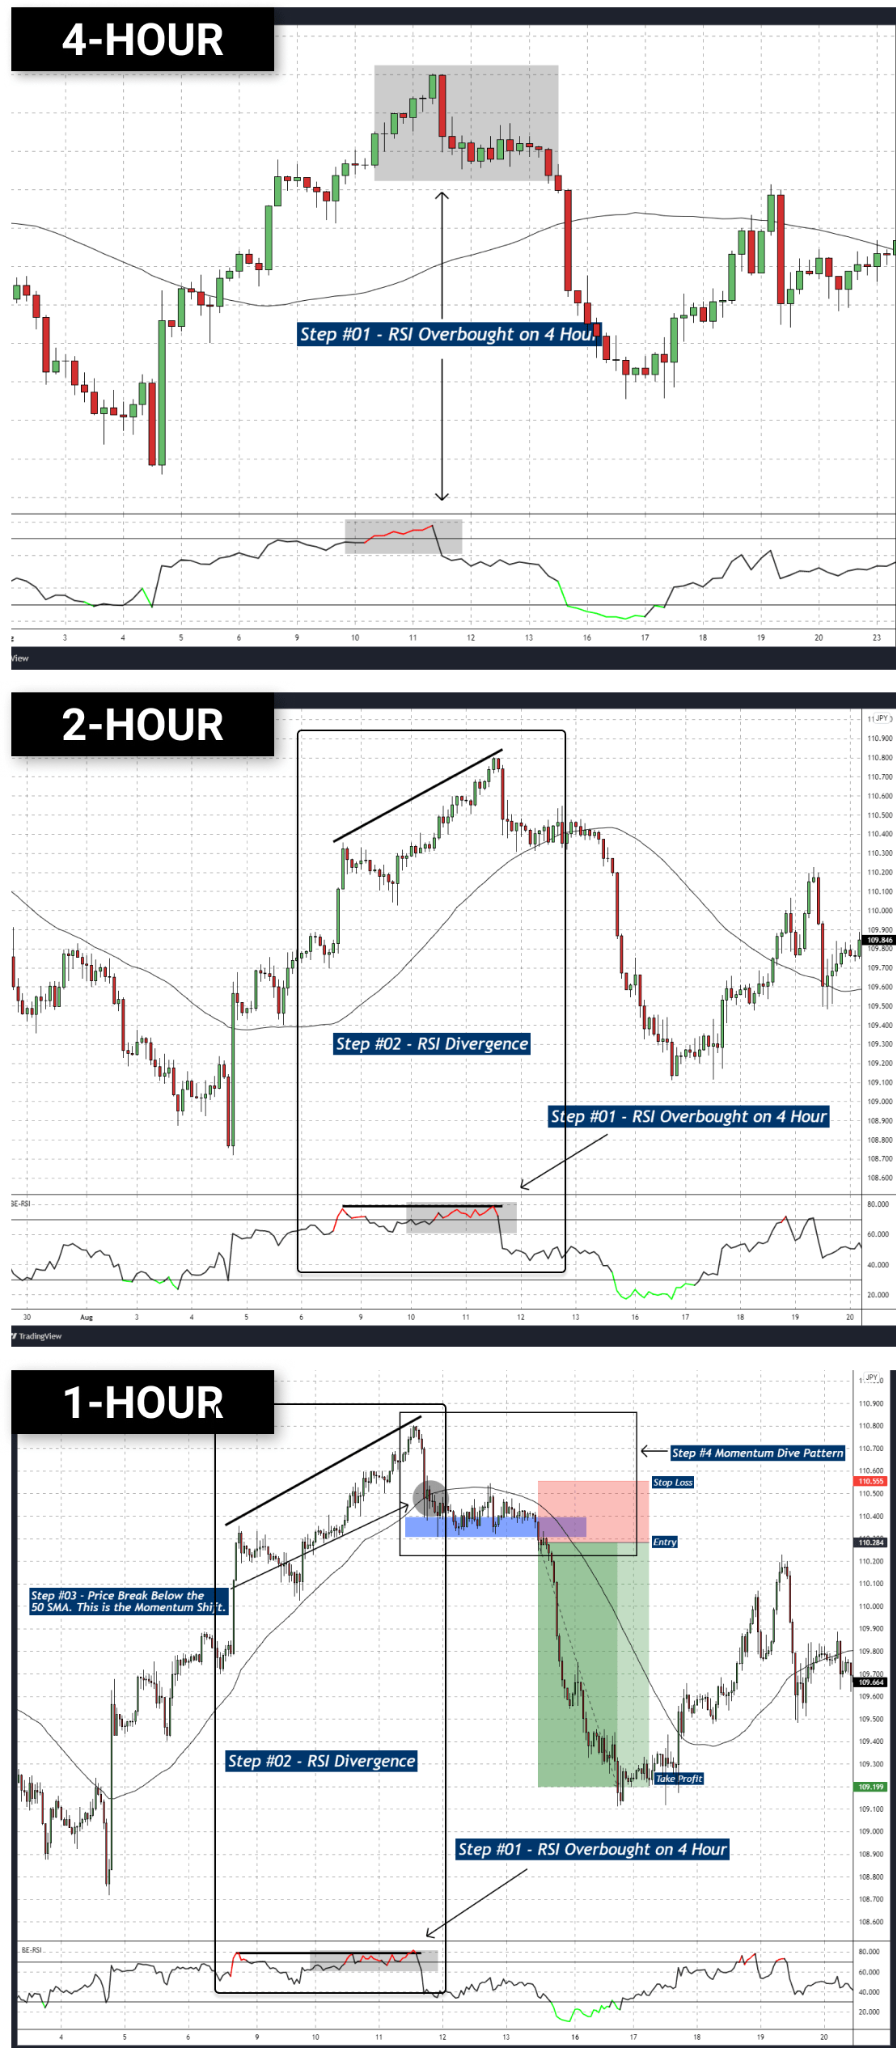
Let’s break down the above chart with the steps we have talked about so far.
Step 01: 4-Hour timeframe is overbought indicating a potential market reversal.
Step 02: RSI Divergence on the 2-Hour timeframe indicates a lack of bullish momentum on the short term uptrend.
Step 03: Price action respecting the 1-Hour 50 SMA. Therefore we were waiting for a bearish breakout of the moving average to confirm the momentum shift and we got that as well.
Okay, at the moment we have a perfect scenario for a market reversal.
Now have a look at the 1-Hour chart above. What is the reversal pattern we have there?
A Momentum Dive Pattern, right?
So the next question is, how do we get an entry here?
Simple, After identifying the reversal chart pattern, in this case, it is a momentum dive pattern, we just have to place a sell stop order a few pips below the marked zone.
Observe the above 1-Hour chart, you can see that we placed the entry a few pips below the market zone.
Next what about stop-loss?
Again it is simple. We just have to calculate the distance of the marked zone and place the stop loss twice that distance.
For example, if the distance of the zone is 15 PIPs, then your stop loss should be 30 PIPs.
If you look at the above chart again, you’ll notice that we did the same thing by placing the stop loss twice as big as the zone size.
For the Take-Profit your go for 4R which mean 4X of your stop loss. For example, if your stop-loss is 20 PIPs then your take profit target should be 80 PIPs.
Study the above chart carefully and you will be able to grasp what we have talked about in step 04.
If you are not clear about the trade entries, don’t worry. We will break down 5 trade examples at the end of this article. Just stay with me.
Related: How to Trade Double Bottom Pattern: A Step-By-Step Guide
Related: Head and Shoulders Pattern in Forex – A Reversal Trading Strategy
When talking about reversal trading strategy, especially trade entries, here is a great reference for traders who are seeking more knowledge 👇
Reversal Trading: 5 Practical Entry Strategies
With that let’s move forward to the last step which on how to grade your trades.
Keep in mind that this is an optional step but by learning how to distinguish between higher probability and normal trade setups, we can effectively go for a massive take profit target passing the 4R.
Step 05 – Extra market confluence to identify trend reversal (this is an optional step)
After we’ve completed all four of the steps we’ve discussed thus far, we can move on to grading our trade setup.
This step is all about grading our trade setup and for that, we just need to find out if there is another trading confluence aligned with our reversal trade setup.
If there are more confluences, then we can mark that particular trade setup as a higher-probability trade setup.
If not it is just a normal trade setup.
The only difference with these two trade setups is that, when we have higher probability trade setups, we will target for more than 4R for take-profit. For example, we can go for 6R or maybe 8R.
On normal trade setups, we will look for only 4R.
That is the difference.
Now, what are these trading confluences?
Well, there are 4 extra trading confluences we are looking for. The below forex chart explains these 4 trading confluences.
1. Size of the Trend Wave
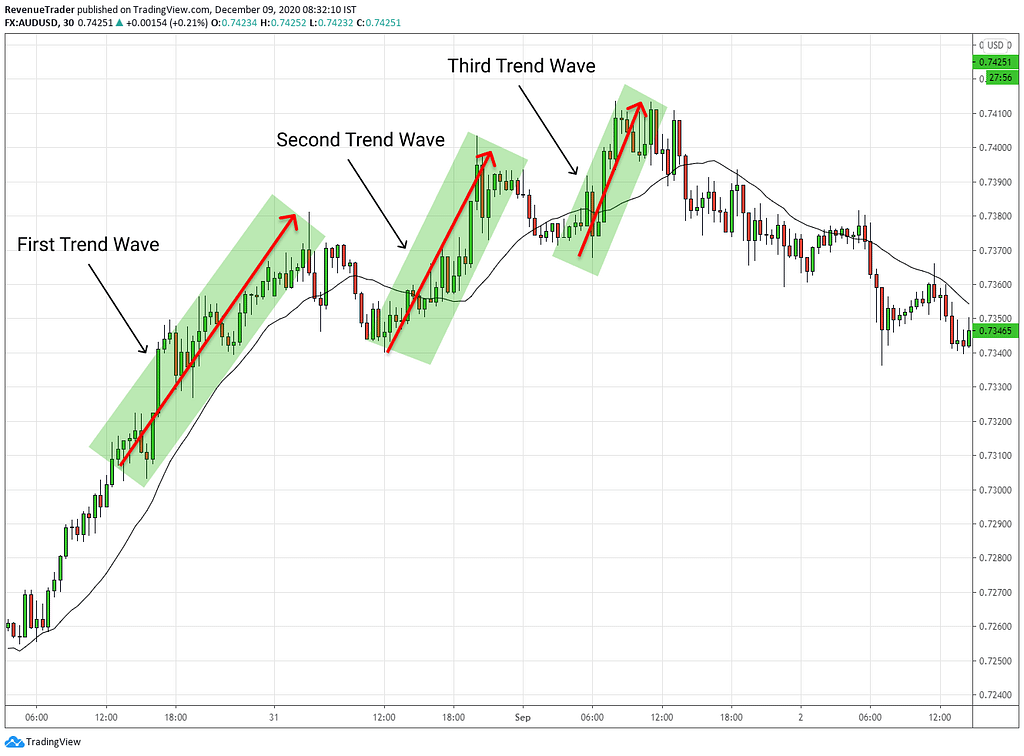
According to the above chart, the first trend wave is strong and large. However, the second and third trend waves are becoming smaller and smaller, indicating fading buying pressure as the uptrend continues.
This is a clear indication that telling the current uptrend is losing its momentum. Therefore, the possibility of a market reversal is high when this trading confluence occurs.
2. Size of the Retracement Move

This is the exact opposite of the previous confluence. Instead of the extension movement, this time we are looking at the retracement moves.
Now have a look at the first and second retracement, they are small, right?
But the third and fourth retracements are getting deeper, indicating an increase in the selling pressure during an uptrend.
Once again when you find this trading confluence during an uptrend, you can expect the current trend to reverse.
3. Support Or Resistance
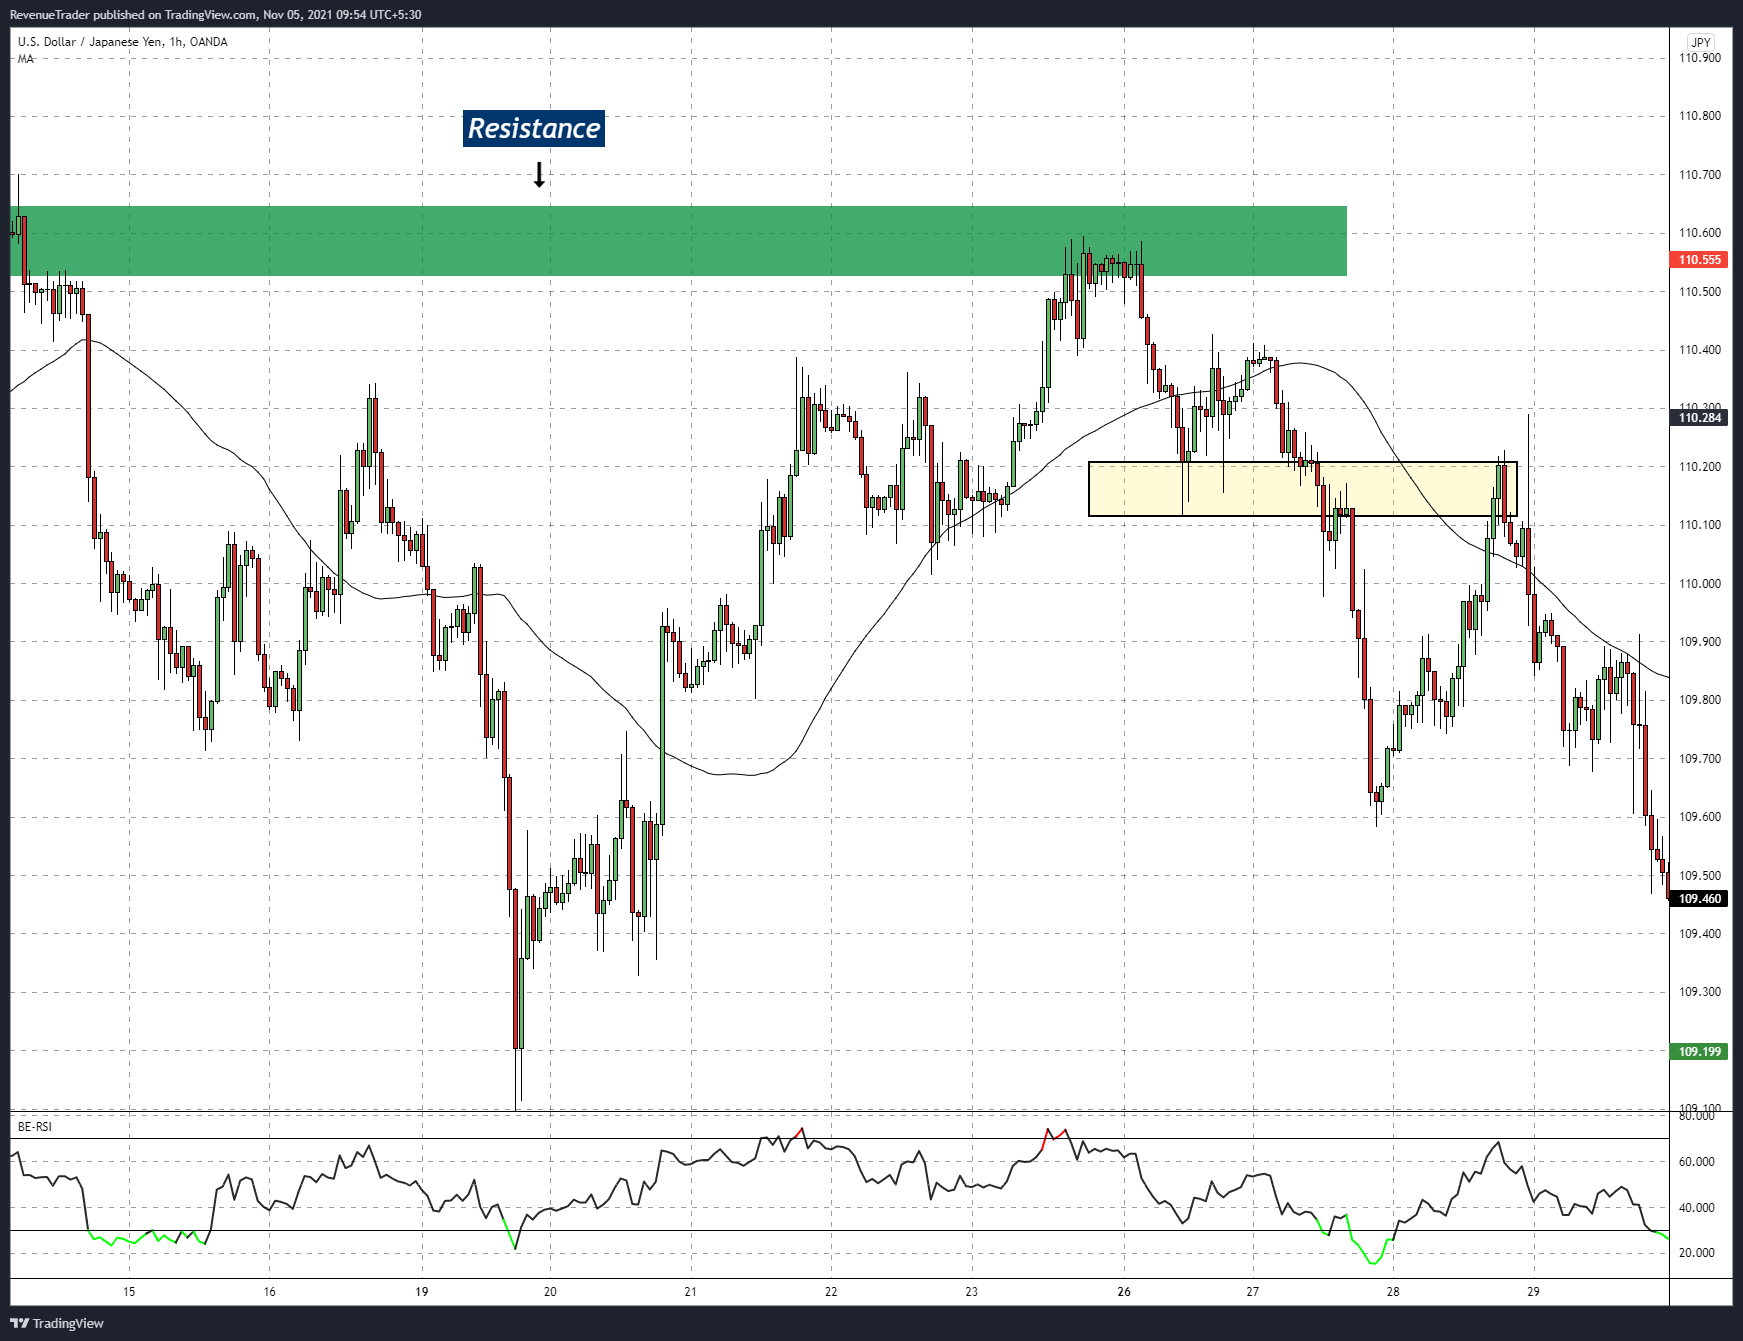
I know you probably heard about Support and resistance.
If support or a resistance level is aligned at the same area where you are looking for a market reversal then these levels can help you to increase the odds in your favour.
Since support and resistance levels are the natural reversal areas, As a reversal trader, combining this with your reversal trade setup will increase the chance of that trade working in your favour.
Related: How to Draw Support and Resistance in Forex (Easy & Profitable Way)
4. Trendline Bounce Failure
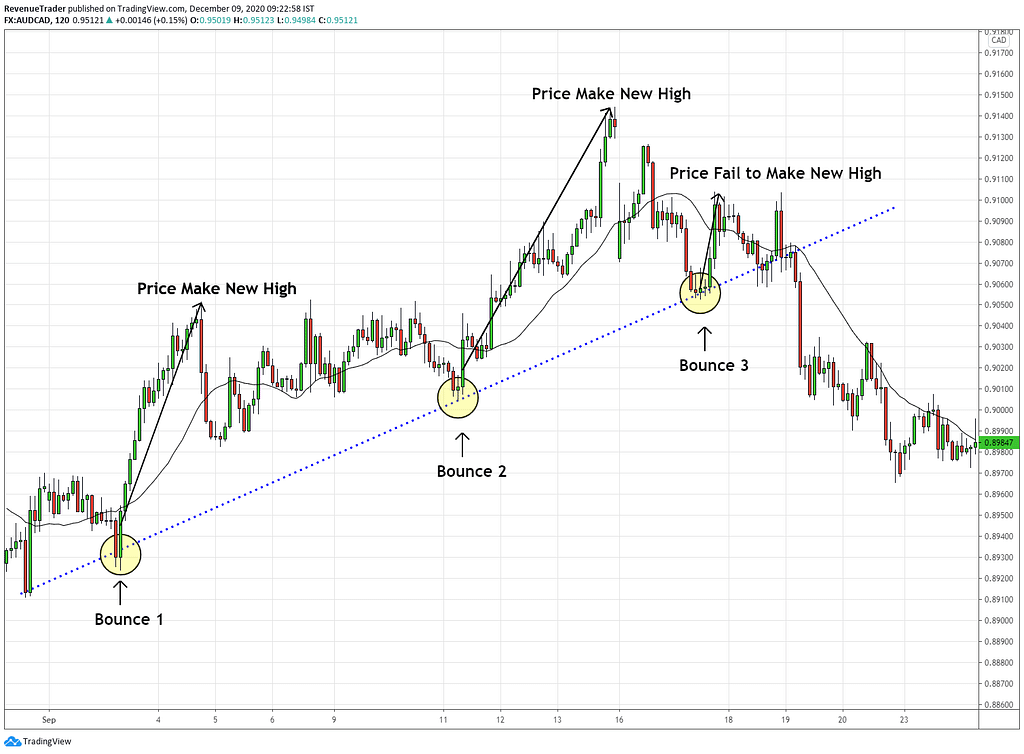
This is the last confluence we are looking for. This is a beautiful uptrend, price is just beautifully bouncing off the trendline, right?
Have a look at Bounce 1 and Bounce 2. After both bounce 1 and bounce 2 price ended up making another new high.
But,
After bounce 3, the price fails to make another new high. That is a clear indication that telling that there are no more buyers available at the current uptrend therefore we should look for a market reversal.
Okay, these are the 4 market confluences you are looking for after having the first 4 steps.
If Two Of These Confluences Align With Your Reversal Trade Setup, Then You Can Grade That Trade Setup As A Higher Probability Reversal Trade Setup.
Okay, there you have it. these are the 5-step process to identify profit-driven reversals when trading forex.
With that in mind, let’s take 4 reversal trade examples from the last few months and break them down step by step. So that if the information you gained from this article is hazy, it becomes clear.
Trend Reversal Trading Strategy – Trade Breakdowns
In this chapter, we are going to take 4 trade examples and break them down step by step manner so that you clearly get the idea of how this reversal trading strategy works.
With that let’s move into the first trade.
Trade 01 – CADJPY Reversal Trade
First, observe the above chart yourself and find out if you can break this trade step by step.
Step 01 (RSI OB/OS) – The first step is to find out that if the market is in the right location to look for a market reversal. Have a look at the 4-Hour chart above. On there we can clearly see that the RSI is showing oversold which mean we have a potential for a market reversal.
Step 02 (Divergence) – Upon identifying trade location on the first step, our next job is to identify weaknesses of the current trend and for that, we are going to use RSI divergence on the 2-Hour. In the above 2-hour chart, we can see that price action and the rsi is doing different things. RSI is making higher lows while price action making equal lows. This is the divergence and this indicates the lack of bearish momentum.
Step 03 (Momentum Shift) – Have look at the 50 SMA. It is reacting to the 2 Hour price action, right? Therefore no need to switch down the 1-hour timeframe in this case. Have a look at the marked circle in the 2-hour. On there price break above the 50 SMA, confirming the increase of momentum in the opposite direction AKA momentum shift.
Step 04 (Reversal Pattern) – What is the reversal pattern here? Double bottom pattern, right? So in the above chart, you can see that we have placed the entry at a few pips above the break of the double bottom pattern and stop loss is placed twice as the zone marked in the chart and the take profit is 4R.
Trade 02 – GBPJPY Reversal Trade
Step 01 (RSI OB/OS) – Have a look at the 4-Hour timeframe, on there RSI is oversold which indicate a potential for a market reversal.
Step 02 (Divergence) – On the 2-hour timeframe price action and RSI are out of sync. This resulted in RSI divergence, which clearly indicates a lack of selling pressure in the current trend.
Step 03 (Momentum Shift) – On the 1-hour timeframe, the price action retraces strongly and break above the 50 SMA. This is the momentum shift and this indicates the strong moment against the currency trend.
Step 04 (Reversal Pattern) – This time we have an inverted head and shoulders chart pattern. One of the most popular as well as most profitable reversal chart patterns out there. Have a look at the chart above, on there, just like the previous trade we place a buy order a few pips above the neckline (grey zone) and placed the stop loss twice as that grey zone and for we use 4R.
With that here are another two trend reversal trades we place. Have a look at the two youtube shorts we posted on our youtube channel.
Trade 03- USDJPY Reversal Trade
Trade 04 – EURJPY Reversal Trade
Trade 05 – USDCHF Reversal Trade
Finally…
That is it.
Now, what do you think about this trading strategy?
Do you like this reversal trading strategy?
If so let me know in the comment section why do like it? Is it because this trading strategy suits your day to day life or your personality?
With that let’s wrap this article here and if you have any questions let me know in the comment section and I will do my best to answer those.


